Chemical synthesis
Reagents were from commercial sources and used without further purification. 1H and 13C nuclear magnetic resonance (NMR) spectra were recorded on a Bruker Ultra-Shield 300 MHz spectrometer operating at 300 MHz, at probe temperature. Chemical shifts are quoted on the δ scale, in parts per million, using residual solvent peaks as the internal standard. Coupling constants (J) are reported in hertz with the following splitting abbreviations: s, singlet; br, broad; d, doublet; t, triplet; q, quartet; p, quintet; m, multiplet. Thin layer chromatography used 60 F254 silica gel. Flash column chromatography was performed using Merck 60 (230–400 mesh ASTM) silica gel. Ultraviolet (UV) spectra were traced in a Thermo Scientific Evolution 201 UV−visible spectrophotometer, and fluorescence measurements taken on a SHIMADZU RF-6000 instrument.
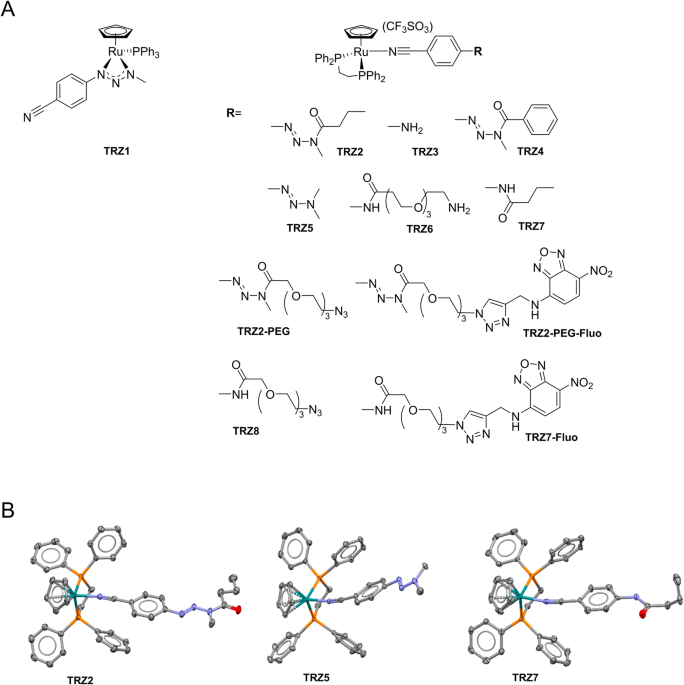
Detailed procedures for the synthesis of triazene, amide, and NBD-labeled ligands [49] are presented in Supplementary Methods, and NMR spectra added as Supplementary Figures (Figs. S1–11). Synthesis of TRZ1: to a Schlenk tube charged with 1-(4-cyanophenyl)-3-methyltriazene (0.25 mmol) and THF (5 mL), NaH (0.3 mmol) was added. After 1 h stirring, the mixture was transferred via cannula to a second Schlenk tube charged with [(η5-C5H5)RuCl(PPh3)2] (0.2 mmol), AgCF3SO3 (0.2 mmol) and THF (5 mL), and previously stirred for 1 h at room temperature. The mixture was then stirred overnight at room temperature, filtered, and pumped to dryness. The crude product was purified by column chromatography (DCM) affording the pure product as a dark orange solid (yield 37%). High-Resolution Mass Spectrometry (HRMS): C31H27N4PRu, theoretical m/z 611.0933 [M+Na]+, experimental m/z 611.0955. During synthesis of compounds TRZ2 to TRZ8, TRZ2-PEG, TRZ2-PEG-Fluo, and TRZ7-Fluo, to a Schlenk tube charged with [(η5-C5H5)RuCl(Dppe)] (0.2 mmol), AgCF3SO3 (0.2 mmol) and appropriate ligands (0.21 mmol) was added DCM (10 mL). After stirring overnight at room temperature, solutions were filtered to remove AgCl precipitate and pumped to dryness. Crude solids were washed with n-hexane (2 × 10 mL), dried, and next recrystalized by slow diffusion of n-hexane in DCM (or acetone for TRZ2) solutions of the compounds. TRZ2: red; yield 68%.1H NMR (300 MHz, DMSO-D6). HRMS: m/z 795.1990 (+3.5 ppm). TRZ3: pale yellow; yield 76%.1H NMR (300 MHz, DMSO-D6). HRMS: m/z 683.1322 (−0.3 ppm). TRZ4: yellow; yield 79%.1H NMR (300 MHz, DMSO-D6). HRMS: m/z 829.1838 (+3.8 ppm). TRZ5: orange; yield 64%.1H NMR (300 MHz, DMSO-D6). HRMS: m/z 739.1721 (+3.0 ppm). TRZ6: yellow; yield 55%.1H NMR (300 MHz, DMSO-D6). HRMS: m/z 886.2503 (+2.1 ppm). TRZ7: yellow; yield 87%.1H NMR (300 MHz, DMSO-D6). HRMS: m/z 753.1743 (+0.9 ppm). TRZ2-PEG: yellow; yield 65%.1H NMR (300 MHz, DMSO-D6). HRMS: m/z 940.2537 (+9.2 ppm). TRZ2-PEG-Fluo: dark orange; yield 57%.1H NMR (300 MHz, DMSO-D6). HRMS: m/z 1158.2917 (+2.1 ppm). TRZ8: yellow; yield 49%.1H NMR (300 MHz, DMSO-D6). HRMS: m/z 898.2243 (+1.2 ppm). TRZ7-Fluo: dark orange; yield 76%.1H NMR (300 MHz, DMSO-D6). HRMS: m/z 1116.2623 (−4.6 ppm).
X-ray diffraction studies
Single crystal X-ray diffraction experiments of TRZ2, TRZ5, and TRZ7 were performed with a Bruker X8APEX area detector diffractometer with graphite-monochromated Mo Kα (λ = 0.71073 Å) radiation. The crystals were mounted on a Kaptan loop with a protectant oil (Fomblin) to prevent air diffusion to the crystal and reduce exposure. Data were collected with the X-ray generator at 50 kV and 30 mA and monitored with APEX3 program. An empirical absorption correction was enforced using Bruker SADABS (Bruker Analytical Systems, Madison, WI, USA) and data reduction was done with Bruker SAINT program (SAINT+, release 6.22; Bruker Analytical Systems, Madison, WI). Structure was solved with Bruker SHELXS [50] and refined by full-matrix-least-squares on F2 using SHELXL [20] programs within WINGX-Version 2020.2 [51]. Non-hydrogen atoms were refined with anisotropic thermal parameters. Hydrogen atoms were placed in calculated positions and allowed to refine in the parent carbon atoms. Mercury 2020.3.0 was used for molecular representations [52]. PLATON was used for the determination of hydrogen bond interactions [53]. A summary of the crystal data, structure solution, and refinement parameters is given in Supplementary Table S1.
Cell culture and treatments
The L929 murine fibrosarcoma and the HT29 human colorectal adenocarcinoma cell lines were originally obtained from ATCC Collections. HCT116 human colorectal adenocarcinoma and HepG2 human liver cancer cells were from ECACC Culture Collection and AML12 murine hepatocytes from LGC Standards. AML12 RIPK3−/− cells were obtained using CRISPR/Cas9 technologies and kindly provided by Dr. Jérémie Gautheron (Sorbonne Université, Inserm, Centre de Recherche Saint‐Antoine, Paris, France). HepG2 and L929 cells were grown in DMEM, whereas HT29 cells were grown in RPMI 1640 and HCT116 cells in McCoy’s 5 A. Cell media were supplemented with 10% heat-inactivated fetal bovine serum (FBS) and 1% antibiotic/antimycotic solution. AML12 wild-type and RIPK3−/− cells were grown in DMEM-F12 supplemented with 10% FBS, 1% antibiotic/antimycotic, 1% insulin-transferrin-selenium (ITS), and 40 ng/ml of dexamethasone (Sigma-Aldrich, St. Louis, MO, USA). Cell culture media and supplements were acquired from Gibco (Thermo Fisher Scientific, Waltham, MA, USA). All cell lines were maintained at 37°C under a humidified atmosphere of 5% CO2.
As positive control for necroptosis induction, HT29 cells were treated with 20 ng/mL recombinant human TNF-α (#300-01A, PeproTech EC Ltd., London, UK), 10 μM Z-Val-Ala-Asp-fluoromethylketon (Z-VAD-FMK or Z-VAD) pan-caspase inhibitor (#ALX-260-020, Enzo Life Sciences, Farmingdale, NY, USA), and 250 nM BV6 Smac mimetic (#B4653, ApexBio, Houston, USA), L929 cells were treated with 10 ng/mL recombinant murine TNF-α (#315-01 A, PeproTech), and HepG2 cells were treated with 10 μM doxorubicin (DOXO) (#D1515, Sigma-Aldrich). Necrostatin-1 (Nec-1), a RIPK1 inhibitor (30 μM; #N9037, Sigma-Aldrich), and GSK872, a RIPK3 inhibitor (10 μM; HY-101872, MedChemExpress), were used as necroptosis inhibitors to confirm loss of cell viability by a necroptotic stimulus. To block apoptosis, cells were incubated with 10 μM Z-VAD. Dimethyl sulfoxide (DMSO; Sigma-Aldrich) was the vehicle control (0,001%, v/v). Sample size was estimated based on previous experience and is indicated in figure legends. Investigators were blinded to the group allocation when assessing the outcome.
Cell death assessments
For evaluation of cell death and viability, cells were plated in 96-well plates at 5 × 10³ cells/well for next-day treatments. MTS metabolism was evaluated as an indicator of cell viability using CellTiter 96® AQueous non-radioactive cell proliferation assay (Promega, Madison, WI, USA), according to the manufacturer’s instructions. Changes in absorbance were measured at 490 nm using a GloMax®-MultiDetection System (Promega). General cell death was evaluated using the ToxiLightTM BioAssay Kit (Lonza Walkersville Inc., Walkersville, MD, USA), by determining the quantities of adenylate kinase (AK) released from cells with permeabilized plasma membranes and present in the extracellular medium. The bioluminescent signals were recorded using also the GloMax®-MultiDetection System.
To determine caspase-3/7 activity, HT29 cells were seeded in 96-well plates at 5 ×10³ cells/well. Twenty-four hours later, cells were incubated with 10 µM Ru-TRZ, or vehicle control, for additional 24 h. Caspase-3 and -7 activation status was measured using the Caspase-Glo® 3/7 Assay (Promega), according to the manufacturer’s instructions. The luminescent signal was recorded using the GloMax®-MultiDetection System (Promega).
Apoptotic cell death was quantified by flow cytometry using the Guava Nexin Reagent kit (Luminex, Texas, USA). HT29 cells were plated in 24-well plates at 3 × 10⁴ cells/well. Twenty-four hours later, cells were exposed to 10 µM Ru-TRZ or vehicle control for additional 24 h. Briefly, cell supernatant and adherent cells were collected, centrifuged at 500 g for 5 min and resuspended in PBS containing 2% FBS. Next, equal volumes of the cell suspension and the Guava Nexin reagent were mixed, incubated for 20 min protected from light, and assayed promptly, using a Guava easyCyte 5HT flow cytometer (Luminex). Sample acquisition and analysis were performed using the InCyte software module.
Drug screening
The primary drug screen was performed using the HCT116 and HT29 cell lines. Cells were seeded in 96-well plates at 5 × 10³ cells/well and 24 h after, exposed to Ru-TRZ compounds and derivatives at a range of concentrations from 0.012 to 243 μM. Cell proliferation was assessed 72 h later using the MTS assay. As a secondary screen, selected hits were tested using HT29, HepG2, and AML12 wild-type cells seeded in 96-well plates at 5 × 10³ cells/well. In the following day, cells were exposed to selected compounds at the same range of concentrations for additional 24 h. Cell death was evaluated by the ToxiLight assay. All measurements were performed in duplicate. The half-maximal effective concentration (EC50) and half-maximal inhibitory concentration (IC50) were calculated using the GraphPad Prism Software version 8.0.2 (GraphPad Software, Inc., San Diego, CA, USA) with the log (inhibitor) versus response (variable slope) function.
Animal studies, injections, and monitoring
Male nude mice (8–10 weeks old) were purchased from Charles River (Barcelona, Spain). Animals were kept in individually ventilated cages, under strict hygiene conditions, on a 12 h light/12 h dark cycle, at 20–24 oC and 50–65% humidity. Mice had free access to sterilized diet and sterilized acidified water. All animal experiments were conducted according to the institutional Animal Welfare Body (ORBEA, Faculty of Pharmacy, Universidade de Lisboa, approved by the competent national authority Direção-Geral de Alimentação e Veterinária DGAV), EU Directive (2010/63/UE) and Portuguese laws (DR 113/2013, 2880/ 2015, 260/2016 and 1/2019) for the use and care of animals in research.
For xenograft tumor induction, a total of 1 × 10⁶ HT29 cells were suspended in 100 μL of PBS and injected subcutaneously in the right flank of nude (athymic) male mice [54]. When tumors reached a volume of around 200 mm3, treatment schedule was initiated. Male C57BL/6 mice 8–10 weeks old were purchased from Charles River (Barcelona, Spain) and randomly divided in 2 groups of 5 animals each. No statistical methods were used to determine sample size estimate in this pilot study. The test group received 5 mg/kg TRZ2 dissolved in 1% DMSO by intravenous route, in a total of ten administrations for 2 weeks, while the control group received the vehicle (1% DMSO in PBS). Mice were monitored every day for pain or distress and body weight was registered. Tumor size was measured over the treatment protocol using a digital calliper and volumes were calculated according to the formula: V (mm3) = (L × W2)/2, where L and W represent the longest and shortest axis of the tumor, respectively [54].Two days after the final administration, mice were sacrificed, and primary tumors were excised and weighed. Investigators were blinded to the group allocation when assessing the outcome.
Cell fractionation and subcellular ruthenium
HT29 cells were seeded in 100 mm culture dishes at 2 × 10⁶ cells/dish. In the next day, cells were incubated with 5 µM Ru-TRZ for additional 24 h. At this time-point, cells were collected by trypsinization, centrifuged at 500 g for 5 min, and washed twice with ice-cold PBS. Finally, cell pellets were resuspended in PBS for whole-cell acid digestion or subcellular fractionation. The FractionPREP™ Cell Fractionation kit (Biovision, Abcam, Cambridge, UK) was used to extract four subcellular protein fractions (cytosolic, nuclear, membrane/particulate, and cytoskeletal), according to the manufacturer’s protocol. To quantify the amount of intracellular Ru, an acid digestion was performed by treating whole-cell pellets or subcellular fractions with 500 µl of a mixture of acids containing 35% HNO3 and 65% HCl, in a glass tube and during 1 h, under agitation, in a 90°C water bath. After cooling, samples were treated with 500 µL H2O2 and incubated during 1 h, under agitation at 90°C. Digested samples were transferred to a clean 2 mL microtube, and the glass digestion tube was washed with 400 µL 1 M HCl. The washing content was transferred to the microtube containing the digested sample. Final samples were analyzed by inductively coupled plasma-mass spectrometry (ICP-MS) to determine the amount of Ru that was uptaken by cells.
Molecular analyses were performed using an ACQUITY ultra-performance liquid chromatography system (Waters, Mildford, MA, USA) coupled to a hybrid quadrupole orthogonal acceleration time-of-flight mass spectrometer Xevo G2 (Waters Corp, Manchester, UK). Data were acquired from m/z 50 to 1200 in data-independent acquisition mode to obtain information about the protonated molecule and adducts if present (e.g., sodium adducts) and fragment ions in a single run. MS data were acquired and processed using MassLynx data station operation software version 4.1 (Waters). Quantitative determination of Ru in the HNO3-digested samples was conducted with an iCAP-RQ ICP-MS instrument (Thermo Fisher Scientific, Bremen, Germany). A MicroFlow PFA ST nebulizer (Elemental Scientific, Omaha, NE, USA) and a double-pass quartz cyclonic spray chamber cooled to 2.7 °C were used. The generated aerosol was transferred into the plasma via a 2.5 mm quartz injector. Nickel Sampler and skimmer cones and a “high matrix” skimmer insert was mounted. All measurements were performed in collision mode using helium gas flow to improve sensitivity and to avoid polyatomic interferences. Samples were suitably diluted with double deionized water and nebulized into the ICP-MS. Signal at m/z 101, 102 was monitored. Concentration mean values from both m/z were obtained. An 8-point external calibration curve, from 0 to 25 ng mL−1, were used for the quantification. Each calibrating standard was freshly prepared by subsequent dilution from a certified Ru standard stock solution: VHG-PRUH-100, 1000 mg L−1 Ru in 20% HCl (LGC Standards, Barcelona, Spain). Reagents free of Ru were checked from the analysis of blank solutions with 1% HNO3.
Cellular uptake
HT29 cells were seeded on µ-Slide 8 well glass bottom (ibidi, Fitchburg, WI, USA) at 3 × 10⁴ cells/well and cultured for 24–36 h before each experiment. Fluorescently labeled compounds TRZ2-PEG-Fluo and TRZ7-Fluo, and their modified versions without Ru atom, or vehicle control, were added to cells at 1 µM in Dulbecco’s phosphate-buffered saline (DPBS) (Thermo Fisher Scientific) for 15 min. Then, a washing step with DPBS was included and cells were subsequently labeled with MitoTracker™ Deep Red and Hoechst 33342 dyes (both from Thermo Fisher Scientific), according to supplier’s instructions. Unbounded dyes were removed by washing with DPBS. Cells were then imaged using a laser scanning confocal microscope (Leica TCS-SP5; Leica, Germany) and a two-photon–excited fluorescence microscope (Ti:sapphire laser; Spectra-Physics Mai Tai BB). Images were collected with 512 × 512 pixels at a scan rate of 100 Hz with the 488 nm Ar+ laser line for fluorescent compounds, the 633 nm He-Ne laser line (for MitoTracker™ Deep Red; Thermo Fisher Scientific), and the 780 nm with the Ti:sapphire laser (for Hoechst 33342). A 63 × 1.2 N.A. water immersion objective was used (HCX PL APO CS 63.0 × 1.20 WATER UV; Leica).
Mitochondrial transmembrane potential
JC-1 (Sigma-Aldrich) is a cationic dye that represents a reliable fluorescent probe for the assessment of mitochondrial transmembrane potential (ΔΨm). JC-1 exhibits potential-dependent accumulation in mitochondria, indicated by a fluorescence emission shift from green (~530 nm), corresponding to JC-1 monomers and indicative of low membrane potential, to red (~590 nm), corresponding to JC1 aggregates and reflecting higher mitochondrial potential. HT29 or AML12 cells were plated on a 96-well plate at 5 × 10³ cells/well and on the next day treated with Ru-TRZ compounds (1 and 5 µM) for 2 h. Carbonyl cyanide m-chlorophenyl hydrazone (CCCP), a mitochondrial depolarizing agent, was used as positive control (200 µM; 4 h). Emitted fluorescence was measured at 530 nm and 590 nm using the GloMax®-MultiDetection System (Promega) and the ratio 590/530 emission intensity was calculated.
Mitochondrial ROS production
Mitochondrial superoxide abundance was quantified by fluorometric quantification. Briefly, HT29 or AML12 cells were plated on a 96-well plate at 5 ×10³ cells/well and on the next day treated with 10 µM Ru-TRZ, or vehicle control, for additional 15 min. MitoSOX™ Red (Invitrogen, Thermo Fisher Scientific) diluted 1:1000 in HBSS was added (100 μL per well) and incubated at 37 °C in a CO2 incubator for 10 min. Cells were then washed with PBS to remove the excess of dye and fluorescence intensity was measured using a Varioskan™ LUX multimode microplate reader (Thermo Scientific) with excitation and emission wavelengths of 510 and 580 nm, respectively. Fluorescence values were normalized by the cell mass content.
Steady state protein production
For isolation of total protein extracts, HT29 cells were seeded in 60 mm dishes at 4 × 10⁵ cells/dish. In the following day, cells were incubated with 10 µM Ru-TRZ, in the presence or absence of Nec-1 or Z-VAD, for additional 24 h. Fifty μg of total protein extracts were separated on 8% sodium dodecyl sulfate-polyacrylamide electrophoresis gels (SDS-PAGE), transferred onto nitrocellulose membranes (RTA Transfer Kit; Bio-Rad, Hercules, CA, USA) and blocked with 5% (w/v) non-fat dry milk in TBS-Tween-20 (0.5% v/v). Blots were incubated overnight at 4°C with primary rabbit antibodies reactive to p-MLKL (1:1000; ab187091; Abcam), MLKL (1:1000; ab183770; Abcam), p-RIPK3 (1:1000; D6W2T; Cell Signaling, Danvers, MA, USA), RIPK3 (1:1000; E1Z1D; Cell Signaling), p-RIPK1 (1:1000; D8I3A; Cell Signaling), RIPK1 (1:1000; D94C12; Cell Signaling) and PARP-1 (1:2000; sc-7150; Santa Cruz Biotech, Dallas, TX, USA). Following incubation with secondary antibody conjugated with horseradish peroxidase (1:5000, Bio-Rad) for 2 h at room temperature, membranes were processed for protein detection by chemiluminescence using SuperSignalTM West Femto Maximum Sensitivity Substrate (Pierce, Thermo Fisher Scientific) or Immobilon Western Chemiluminescent HRP Substrate (Millipore, Burlington, MA, USA), on a ChemiDoc XRS-imaging system (Bio-Rad). β-actin (1:40,000, A5541; Sigma-Aldrich) was used as loading control. Relative intensities of protein electrophoretic bands were analyzed using the ImageLabTM densitometric analysis software (version 6.0.1; Bio-Rad). Full and uncropped Western blots were uploaded as Supplementary Material (Figs. S12–14).
Drug combination index
In drug combination studies, cells were incubated with TRZ2 combined with 5-fluorouracil (5-FU), oxaliplatin (OXA), and irinotecan (IRI) chemotherapeutics (kindly provided by Hospital Santa Maria, Lisbon, Portugal) at a ratio of 1:1. The effect of combined treatments was evaluated using the CompuSyn software 1.0 (ComboSyn, Inc. and PD Science, LLC). Briefly, the combination index (CI) is a tool to analyze the interaction between drugs allowing to distinguish between synergistic, additive, and antagonistic effects. CI values are calculated considering the concentration of drugs in combination to produce a specific effect (Fraction affected—Fa) and the concentration of drugs to produce that same effect individually. The final CI value is calculated by the average of CI values at Fa 50, 75, 90, and 95%. CI value < 1 indicates synergism while a CI value > 1 indicates antagonism. Fa-CI plot between the levels of different fractions affected against the CI values was also created using CompuSyn software to interpret the type of interactions between TRZ2 and chemotherapeutic drugs. The data points below the additivity line (CI = 1) indicate synergism.