Preparation and characterization of catalyst
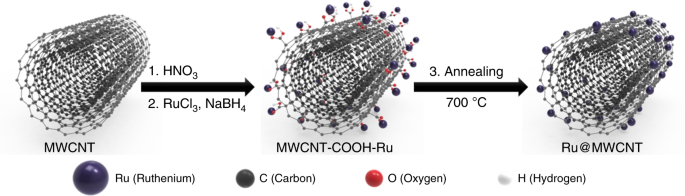
A simple schematic diagram of the Ru nanoparticle-impregnated MWCNT (Ru@MWCNT) catalyst is shown in Fig. 1. Commercial MWCNTs were mildly oxidized with nitric acid to introduce oxygenated functional groups (specifically, carboxylic acids, –COOH) on the surface of MWCNT. With abundant carboxylic acids on the surface of the MWCNT, the Ru ions (Ru3+) can be easily adsorbed on the surface of the MWCNT, by forming Ru carboxylate complexes43. Individual Ru3+ ions were then directly reduced to Ru0 nanoparticles in the presence of sodium borohydride (NaBH4) to form Ru@MWCNT. Subsequent heat-treatment (thermal reduction) under inert conditions further reduced the Ru nanoparticles and oxygenated groups for improved HER performance. Extended X-ray absorption fine structure (EXAFS) spectroscopy was used to analyze the formation of Ru carboxylate complex and local structural environment of Ru@MWCNT catalyst before and after heat-treatment (Supplementary Fig. 1). As a reference, Ru acetylacetonate, containing pristine Ru–O bonds was used to confirm Ru–O bonding. The Fourier-transformed (FT) k2-weighted EXAFS spectrum of the reference Ru acetylacetonate exhibits the major peak at around 1.5 Å, corresponding to Ru–O coordination. Ru@MWCNT before heat-treatment also has Ru–O coordination, which confirms the Ru carboxylate coordination. However, after heat-treatment, Ru@MWCNT shows that the peak at 1.5 Å was slightly shifted to 1.6 Å, indicating the formation of Ru–C coordination44. The main peak at 2.4 Å is associated with Ru–Ru coordination in Ru nanoparticles44. These results indicate the formation of Ru carboxylate complexes, which help to form the smaller and more uniform Ru nanoparticles during the heat-treatment. To determine the optimum conditions, the Ru@MWCNT samples were heat-treated at different temperatures. The sample annealed at 700 °C showed the best HER catalytic performance in both acid and alkaline electrolytes (Supplementary Fig. 2).
The crystal structure of the Ru@MWCNT was analyzed using a high-power X-ray diffraction (HP-XRD) pattern (Fig. 2a). The peak observed at 25.6° belongs to the (002) plane of the MWCNT. The other peaks at 38.5, 42.2, 44.1, 58.4 and 69.6° can be assigned to the (100), (002), (101), (102), and (110) planes of the hexagonal Ru crystals. The average size of the Ru nanoparticles on the Ru@MWCNT was calculated to be 3.4 nm using the Scherrer equation. X-ray photoelectron spectroscopy (XPS) was used to analyze the chemical composition of the Ru@MWCNT (Supplementary Fig. 3). In the high-resolution C 1 s spectrum, the peak at 284.6 eV is associated with the graphitic C–C bonds of the MWCNT. The peak at 280.4 eV is related to the atomic state of the Ru0 species in the Ru@MWCNT. The bulk Ru content of Ru@MWCNT was determined by thermogravimetric analysis (TGA) in air, and was ~12.8 wt% (Fig. 2b). The value is in good accordance with the elemental analysis (Supplementary Table 1). The nitrogen (N2) adsorption–desorption isotherm was obtained to calculate the specific surface area (SBET) using the Brunauer-Emmett-Teller (BET) method. The SBET of the Ru@MWCNT was found to be 231.82 m2 g−1 (Fig. 2c). Considering the high specific surface area and small Ru nanoparticles, the Ru@MWCNT catalyst was expected to display good HER performance.

a Powder XRD pattern. Asterisks in Ru@MWCNT denote Ru crystal (JCPDS 06-663). b TGA curve under air atmosphere at a ramping rate of 10 °C min−1. c Nitrogen (N2) adsorption–desorption isotherms at 77 K. The inset in c shows the pore size distribution. The specific surface area was calculated using the BET method. d, e TEM images. The inset in (d) shows the size distribution of Ru nanoparticles. f The HR-TEM image is focused on an Ru nanoparticle, showing the high crystallinity of the Ru elements, and their compact packing in the lattice. The inset in f is the corresponding FFT pattern. g High-angle annular dark-field scanning transmission electron microscopy (HAADF-STEM) image and scanning transmission electron microscopy coupled energy-dispersive X-ray spectroscopy (STEM-EDS) element mapping of Ru@MWCNT. Scale bar: d 50 nm; e 10 nm; f 2 nm; g 100 nm.
The morphology of the Ru@MWCNT was explored by field emission scanning electron microscope (FE-SEM) and transmission electron microscopy and (TEM). The SEM images of the Ru@MWCNT revealed a clean and smooth surface morphology (Supplementary Fig. 4). The TEM images of the Ru@MWCNT clearly confirmed that the Ru nanoparticles were uniformly anchored to the surface of the MWCNT. The particle size distribution was in the range of 2–5 nm and the average size was 3.4 nm (Fig. 2d, e and Supplementary Fig. 5). Due to small particle size, and the uniform and narrow particle size distribution, a large number of Ru active sites are likely to be exposed, while the MWCNT provides an efficient electron pathway. High-resolution TEM images of the single Ru nanoparticle and the corresponding fast Fourier transform (FFT) pattern showed that the Ru elements were compactly packed into the hexagonal lattice (Fig. 2f)25, which precisely agreed with the XRD pattern (Fig. 2a). The uniform distribution of Ru nanoparticles on the surface of the MWCNT was further confirmed by scanning transmission electron microscopy (STEM) image and corresponding energy-dispersive X-ray spectroscopy (EDS) elemental mapping images (Fig. 2g).
Electrochemical HER activity and stability of Ru@MWCNT catalyst
The Ru@MWCNT catalyst was evaluated for electrochemical HER performance in a N2-saturated 0.5 M aq. H2SO4 solution. As references, commercial Pt/C and bare MWCNT were also tested under the same conditions and compared. The MWCNT did not show catalytic activity toward HER in the range of applied potential. On the other hand, both the Pt/C and Ru@MWCNT required an overpotential of ~0 mV to induce hydrogen evolution (Fig. 3a).

a, b Polarization curves and corresponding Tafel plots in N2-saturated 0.5 M aq. H2SO4 solution and 1.0 M aq. KOH solution. Scan rate: 5 mV s−1. c Overpotentials at 10 mA cm−2 and exchange current density in N2-saturated 0.5 M aq. H2SO4 solution and 1.0 M aq. KOH solution. d Comparison of the overpotentials at 10 mA cm−2 with recently reported HER catalysts in both acidic and alkaline conditions.
Notably, the HER current density of Ru@MWCNT sharply increased as the overportential increased, with a Tafel slope of 27 mV dec–1 similar to Pt/C (Fig. 3b). The small Tafel slope indicates that the rate determining step is the recombination of chemisorbed hydrogen, following the Volmer-Tafel mechanism45,46,47.
As a critical parameter for practical evaluation, the overpotential at a current density of 10 mA cm−2 was evaluated for each catalyst. Ru@MWCNT displayed an overpotential of 13 mV and Pt/C required 16 mV to deliver a current density of 10 mA cm−2. From the Tafel slope, the exchange current density of Ru@MWCNT was 2.8 mA cm−2, which was similar to the Pt/C (2.7 mA cm−2), indicating Ru@MWCNT electrode’s rapid HER kinetics (Fig. 3c). In acidic conditions, electrochemical impedance spectroscopy (EIS) analysis of the Ru@MWCNT catalyst exhibited a charge transfer resistance of 1.81 Ω cm2 at an overpotential of 35 mV, which was lower than the Pt/C (2.23 Ω cm2 at 35 mV). This implies fast electron/proton transfer at the interface of the Ru@MWCNT and the electrolyte (Supplementary Fig. 6). This remarkably improved HER performance is believed to be due to favorable charge transfer between the active sites and the working electrode, which is attributed to the highly conductive MWCNT substrate.
The HER efficiencies of the Ru@MWCNT and commercial Pt/C catalysts were evaluated in N2-saturated 1.0 M aq. KOH solution (Fig. 3a). Interestingly, the Ru@MWCNT catalyst exhibited a smaller Tafel slope of 27 mV dec–1 than the Pt/C (43 mV dec–1). The smaller Tafel slope indicates that Ru@MWCNT catalyzed the reaction faster than Pt/C (Fig. 3b). The exchange current density (2.4 mA cm−2) of the Ru@MWCNT was also higher than the Pt/C (1.4 mA cm−2), indicating it had higher electrocatalytic HER activity in alkaline medium (Fig. 3c). As a result, the overpotential required to generate a current density of 10 mA cm−2 was only 17 mV, smaller than the benchmark Pt/C (33 mV). The charge transfer resistance of the Ru@MWCNT calculated from EIS was 2.38 Ω cm2 at an overpotential of 45 mV, while that of Pt/C was 4.22 Ω cm2 (Supplementary Fig. 6). The lower charge transfer resistance of Ru@MWCNT also indicates efficient HER charge transfer kinetics compared to Pt/C in alkaline conditions.
The overpotentials of Ru@MWCNT at 10 mA cm−2 in acidic (Fig. 3d and Supplementary Table 2) and alkaline media (Fig. 3d and Supplementary Table 3) were compared with other HER catalysts reported in recent studies18,25,48,49,50. The substrate, MWCNT, did not show any HER catalytic activity, while Ru@MWCNT exhibited excellent HER performance due to the presence of the small Ru nanoparticles (average 3.4 nm) stably anchored on its surface (Supplementary Fig. 7).
To evaluate the electrochemical surface area (ECSA) of the catalysts, the underpotential deposition of copper (Cu-UPD) on Ru@MWCNT and Pt/C were carried out. The ECSA of Ru@MWCNT was 7996.15 m2g−1Ru, which was approximately two times higher than commercial Pt/C (3638.67 m2g−1Pt) (Supplementary Fig. 8).
In order to identify the active sites on the Ru@MWCNT, thiocyanate ions (–SCN), an active site toxin of metal catalysts, was added to the 0.5 M aq. H2SO4 electrolyte. The addition of −SCN dramatically reduced the activity of the Ru@MWCNT, indicating that the Ru nanoparticles on the Ru@MWCNT were the active sites for HER catalysis (Supplementary Fig. 9).
To evaluate the long-term stability of Ru@MWCNT and Pt/C catalysts in both 0.5 M aq. H2SO4 (Figs. 4a) and 1.0 M aq. KOH solutions (Fig. 4b), cyclic stability tests were conducted at a scan rate of 100 mV s−1. In acidic conditions, the commercial Pt/C showed an 8 mV negative shift at a current density of 10 mA cm−2, while the Ru@MWCNT catalyst displayed only a 4 mV negative shift after 10,000 cycles. In alkaline conditions, the Ru@MWCNT exhibited 20 times better electrochemical stability than Pt/C (Fig. 4c). Stability was also examined via chronoamperometry technique at the applied potentials 20 and 35 mV, respectively, in acidic and alkaline media for 50 h, and the Ru@MWCNT exhibited no apparent loss in current density compared to Pt/C (Supplementary Fig. 10). In addition, TEM images of the Ru@MWCNT after the long-term stability test showed no change in morphology (Supplementary Fig. 11). These results indicate the exceptional stability of Ru@MWCNT compared to commercial Pt/C in both acidic and alkaline media.

a, b The polarization curves were recorded before and after 10,000 CV potential cycles. c Comparison of overpotential changes at 10 mA cm−2 after 10,000 CV potential cycles in acidic and alkaline conditions. d Specific activities at different overpotentials (10, 20, and 30 mV) in N2-saturated acidic and alkaline conditions, respectively. e Comparison of TOF values of the Ru@MWCNT and Pt/C with other recently reported HER catalysts in acidic and alkaline conditions, respectively. f Mass activities in N2-saturated 0.5 M aq. H2SO4 and 1.0 M aq. KOH solutions, respectively.
For a fair comparison of catalytic activity, the polarization curves of Ru@MWCNT and Pt/C were normalized by ECSA. In 0.5 M aq. H2SO4 solution, the Ru@MWCNT showed slightly higher specific activity than Pt/C for a series of overpotentials (Fig. 4d). A more dramatic difference was observed in the specific activity between Ru@MWCNT (0.315 mA cm−2) and Pt/C (0.122 mA cm−2) in 1.0 M aq. KOH solution (Fig. 4d). At an overpotential of 30 mV, the Ru@MWCNT showed ~2.5 times higher specific activity than the Pt/C. This result indicates superior inherent catalytic activity, which is associated with the stronger H2O binding energy and faster H2O dissociation at the surface of the Ru nanoparticles on the Ru@MWCNT catalyst25. As a result, Ru@MWCNT can supply protons faster for more efficient hydrogen generation. Given its fast proton adsorption and reduction via appropriate hydrogen bond energy, fast proton supply, and rapid release of product (H2), the Ru@MWCNT is a highly active HER catalyst.
To compare and evaluate the HER performance of the catalyst, we evaluated its turnover frequency (TOF), which is an important criterion for HER catalysts. TOF is the basis for determining inherent electrocatalytic efficiency, and the overpotential at 10 mA cm−2 predicts the actual HER applicability. The TOF values for the active sites of the catalysts were calculated under acidic and alkaline conditions, following the previously reported method22,23. In 0.5 M aq. H2SO4 solution, the TOF value of Ru@MWCNT at 25 mV was 0.70 H2 s−1, which is very competitive compared to Pt/C (0.67 H2 s−1 at 25 mV) and other reported HER catalysts (Fig. 4e and Supplementary Table 4). In addition, in an alkaline solution, the TOF value of Ru@MWCNT at 25 mV was 0.40 H2 s−1, which is higher than that of Pt/C (0.25 H2 s−1) (Fig. 4e and Supplementary Table 5). The TOF values of the reference Pt/C are also reliable compared to other HER catalysts reported in recent studies (Supplementary Tables 4, 5). Hence, the TOF values in both conditions indicate that Ru@MWCNT outperforms Pt/C HER activity.
To further examine the catalysts from different perspectives, the mass activity of each catalyst was evaluated by normalizing the polarization curves with the masses of Ru and Pt. Mass activity is closely related to cost for practical applications. As shown in Fig. 4f, at the overpotential of 20 mV, the mass activity of Ru@MWCNT was 380 mA mg−1Ru in acidic medium and 186 mA mg−1Ru in alkaline medium. These values were much higher than Pt/C (165 and 52 mA mg−1Pt, respectively). Therefore, it can be safely stated that Ru@MWCNT has significant advantages over Pt/C in terms of overall catalytic performance and cost.
The full water-splitting system analysis
To further demonstrate an advanced practical use of Ru@MWCNT for water-splitting using an alkaline electrolyte (1.0 M aq. KOH solution), two-electrode devices with oxygen and hydrogen evolution electrodes were fabricated. The carbon papers (CPs) used as substrates for the electrodes were coated with the catalysts by electrospray (Supplementary Fig. 12). Both Ru@MWCNT and Pt/C coated on CP, as well as bare CP, was tested as a HER electrode. As the oxygen evolution reaction (OER) electrode, commercial iridium oxide (IrO2) was coated on the CP. In order to accurately determine the actual amount of hydrogen generation, a systematic experiment was conducted by connecting a closed water-splitting device (HER + OER) directly to a gas chromatography (GC) instrument (Fig. 5a). The area of each electrode was 1 cm2. Prior to the two-electrode evaluation, a three-electrode experiment was conducted to confirm the HER performance of the prepared electrodes. Current densities of devices with different HER electrodes were obtained (Fig. 5b). The Ru@MWCNT electrode showed overpotentials of 10.4, 19.4, and 28.4 at 10, 20, and 30 mA cm−2, respectively, while the Pt/C electrode showed 26.4, 40.4, and 50.4 mV at each corresponding current density.

a Schematic diagram of the two-electrode system measurement. b Polarization curves in N2-saturated 1.0 M aq. KOH solution. Scan rate: 5 mV s–1. c–e The voltage changes at constant current and the corresponding hydrogen production per voltage at specific currents of 10, 15, and 20 mA. f Hydrogen production per power consumption at specific current (10, 15, and 20 mA). The error bar reflects the three device results. g Faradaic efficiency at a specific voltage (1.5, 1.6, 1.7, and 1.8 V). The error bar reflects the three device results.
A constant current was applied to the system for 20 h and the amount of hydrogen generated was measured every hour. As shown in Fig. 5c–e, the hydrogen production of the Ru@MWCNT per voltage was 2222.3, 3221.9, and 4194.0 μmol V–1 meaning it produced 15.6% more than the Pt/C (Supplementary Tables 6–8). In addition, the hydrogen production of Ru@MWCNT per power consumption was also 15.4% higher than the Pt/C (Fig. 5f and Supplementary Table 9). Faradaic efficiency was also determined in the range of 1.5–1.8 V (Fig. 5g). The bare CP showed a Faradaic efficiency of only 11.4% at 1.8 V and there was no HER activity in the range of 1.5–1.7 V. The Pt/C electrode showed Faradaic efficiencies of 46.99, 81.98, 85.88, and 85.97% at 1.5, 1.6, 1.7, and 1.8 V, respectively, while the Ru@MWCNT electrode showed 85.88, 87.31, 92.24, and 92.28% at each corresponding voltage. Once again, the results indicated that the Ru@MWCNT catalyst was superior to the benchmark Pt/C (Supplementary Table 9).
The Ru@MWCNT catalyst was also coated on a large size titanium (Ti) mesh type electrode to check the practical application of the catalyst (Supplementary Video 1).
Active site identification by DFT calculations
First-principle density functional theory (DFT) calculations were also performed to gain more insight into the enhanced electrocatalytic activity of Ru@MWCNT active sites for hydrogen evolution reaction. It is widely known that the formation energy of metal-hydrogen (M–H) bond plays an important role in hydrogen evolution. Being at the center of volcano plot for electrocatalysts, Pt displays the optimal M−H binding energy, which is neither too weak nor too strong25. Catalysts having M−H binding energy similar or close to Pt−H (0.53 eV) will efficiently promote hydrogen evolution. The DFT calculations were performed based on previously reported Ru@C2N for a clear comparison25. To sustain the catalytic activity of Ru nanoparticles, the important point is to prevent their aggregation (Ostwald ripening). The calculation showed that Ru nanoparticles on Ru@MWCNT have closer Pt−H binding energy than on Ru@C2N (Supplementary Fig. 14). This result indicates that Ru@MWCNT can have better HER performance than Ru@C2N. For more details, hydrogen binding energies of possible H binding sites are identified, and the four most stable energies are 0.58, 0.64, 0.64, and 0.62 eV (Supplementary Fig. 15). All stable configurations of Ru@MWCNT show lower energies than Ru@C2N (0.68 eV), suggesting that Ru@MWCNT can display enhanced catalytic activity. An important point to be noted is that the Ru@MWCNT has an energy of −5.23 eV (10 Ru–C bonds) (Supplementary Fig. 16), implying that there are strong Ru–C bonds between Ru nanoparticles and MWCNT. This result reflects the stability of Ru nanoparticles on the surface of MWCNT (Ru@MWCNT) during long cycling test. Furthermore, the formation of Ru–C bonds was confirmed by EXAFS results (Supplementary Fig. 1), supporting that the aggregation (Ostwald ripening) of Ru nanoparticles can be hampered by forming strong bonds between Ru and MWCNT.