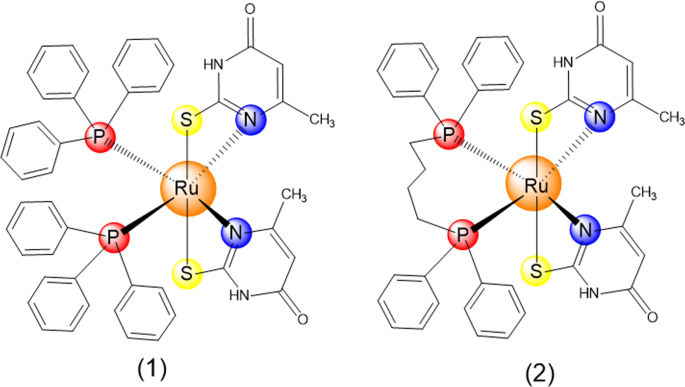
Synthesis of ruthenium(II) complexes with 6-methyl-2-thiouracil
Ruthenium(II) complexes with 6-methyl-2-thiouracil ligand, cis-[Ru(6m2tu)2(PPh3)2] (1) and [Ru(6m2tu)2(dppb)] (2), were obtained as previously described by Correa20. Briefly, synthesis of 1 and 2 were carried out in a Schlenk reaction flask containing 0.25 mmol of 6-methyl-2-thiouracil ligand dissolved in a methanol (10 mL) solution with 20 μL of triethylamine. After, 0.12 mmol of [RuCl2(PPh3)3] or [RuCl2(PPh3)(dppb)] precursor was added to the reaction medium. The mixture was maintained under stirring at room temperature for 3 h. Then, the volume was reduced to c.a. 2 mL and a yellow solid was formed. The solid was collected by filtration, washed with methanol, diethyl ether and dried under vacuum. All manipulations were performed under argon. All reagents were purchased from Sigma-Aldrich (Sigma-Aldrich Co., Saint Louis, MO, USA) and were used as received.
In vitro assays
Cells
HL-60 (human acute promyelocytic leukemia), K-562 (human chronic myelogenous leukemia), HCT116 (human colon carcinoma), HepG2 (human hepatocellular carcinoma), HSC-3 (human oral squamous cell carcinoma), SCC-9 (human oral squamous cell carcinoma), B16-F10 (mouse melanoma), MRC-5 (human lung fibroblast), WT SV40 MEF (wild-type immortalized mouse embryonic fibroblast) and BAD KO SV40 MEF (BAD gene knockout immortalized mouse embryonic fibroblast) cell lines were obtained from American Type Culture Collection (ATCC, Manassas, VA, USA). Human peripheral blood mononuclear cells (PBMC) were isolated using standard Ficoll density gradient from heparinized blood collected from 20- to 35-year-old, non-smoker healthy donors with informed consent (number 031019/2013) approved by Human Ethics Committee of Gonçalo Moniz Institute from Oswaldo Cruz Foundation (IGM-FIOCRUZ/BA), and all experiments were performed in accordance with relevant guidelines and regulations. Cells were cultured as recommended by ATCC guidelines and a mycoplasma stain kit (Sigma-Aldrich) was used to validate the use of cells free from contamination. Cell viability in all experiments was examined using the trypan blue exclusion (TBE) assay. Over 90% of the cells were viable at the beginning of the culture.
Cytotoxicity assay
Cytotoxicity was measured using alamar blue assay and was performed following the procedure that was described previously21,22. Briefly, cells were inserted in 96-well plates and incubated overnight. Then, the complexes were dissolved in dimethyl sulfoxide (DMSO, LGC Biotechnology, São Paulo, SP, Brazil) and added to each well and incubated for 72 h. Doxorubicin (purity ≥95%, doxorubicin hydrochloride, Laboratory IMA S.A.I.C., Buenos Aires, Argentina) and oxaliplatin (Sigma-Aldrich Co.) were used as positive controls. Before the end of treatment (4 h for cell lines and 24 h for PBMC), 20 μL of a stock solution (0.312 mg/mL) of alamar blue (resazurin, Sigma-Aldrich Co.) were added to each well. Absorbance at 570 nm and 600 nm was measured using SpectraMax 190 Microplate Reader (Molecular Devices, Sunnyvale, CA, USA).
Trypan blue exclusion method
The number of viable cells and non-viable (take up trypan blue) were counted by TBE method. Shortly, 90 μL was removed from the cell suspension and 10 μL of trypan blue (0.4%) was added. Cell counting was performed using a light microscope with a neubauer chamber.
Intracellular ruthenium quantification
Intracellular ruthenium quantification in HL-60 cells was evaluated by energy dispersive X-ray spectrometer (EDS)23. Cells were fixed in sodium cacodylate buffer (0.1 M sodium cacodylate solution pH 7.4, plus 2.5% glutaraldehyde and 2% paraformaldehyde) for at least 2 h. After washing, cells were dehydrated in an acetone series and embedded in polybed epoxy resin (Polysciences; Warrington, PA). Ultrathin sections were examined under a JEM-1230 transmission electron microscope (TEM) integrated with an EDS microanalytics system (JEOL USA, Inc., Peabody, MA, USA).
Morphological analysis
To cell morphology evaluation, slides were prepared using cytospin and stained with May-Grunwald-Giemsa. Morphological changes were assessed by light microscopy (Olympus BX41, Tokyo, Japan) using Image-Pro software (Media Cybernetics, Inc. Silver Spring, USA). Light scattering features were determined by flow cytometry. At least 104 events were recorded per sample using a BD LSRFortessa cytometer along with BD FACSDiva Software (BD Biosciences, San Jose, CA, USA) and Flowjo Software 10 (Flowjo LCC, Ashland, OR, USA). Cellular debris was omitted from the analysis.
Apoptosis quantification assay
FITC Annexin V Apoptosis Detection Kit I (ID 556547) (BD Biosciences) was used for apoptosis quantification and the analysis was performed according to the manufacturer’s instructions. Shortly, cells were washed twice with saline solution and resuspended in 100 μL of binding buffer plus 5 μL of propidium iodide (PI) and 5 μL of FITC Annexin V. Then, cells were gently mixed by vortexing and incubated for 15 min at room temperature in the dark. Finally, 400 μL of binding buffer was added to each tube, and the cell fluorescence was determined by flow cytometry, as described above. Percentage of viable, early apoptotic, late apoptotic and necrotic cells were measured. Protection assays using a pan-caspase inhibitor (Z-VAD(Ome)-FMK, Cayman Chemical; Ann Arbor, MI, USA), JNK/SAPK inhibitor (SP 600125; Cayman Chemical), p38 MAPK inhibitor (PD 169316; Cayman Chemical) and MEK inhibitor (U-0126; Cayman Chemical), were also evaluated. In these assays, cells were preincubated for 2 h with 50 µM Z-VAD(Ome)-FMK, 5 µM U-0126, 5 µM SP 600125 or 5 µM PD 169316, followed by incubation with 4 µM of complexes 1 and 2 for 24 h. Cells were then analyzed by FITC Annexin V Apoptosis Detection assay as described above.
Measurement of mitochondrial transmembrane potential
Mitochondrial transmembrane potential was determined by retention of dye rhodamine 123 as described previously24. Briefly, cells were incubated with rhodamine 123 (5 μg/mL, Sigma-Aldrich Co.) at room temperature for 15 min in dark and washed with saline solution. Cells were incubated again in saline solution for more 30 min in dark and cell fluorescence was determined by flow cytometry as described above.
Caspase-3, -8 and -9 activation assays
To investigate the activation of caspase-3, -8 and -9, we used caspase-3 colorimetric assay kit (ID K106-100), caspase-8 colorimetric assay kit (ID K113-100) and caspase-9 colorimetric assay kit (ID K119-100) (all from BioVision Inc.; Milpitas, CA, USA), and the analysis were performed according to the manufacturer’s instructions. Enzyme reactions were performed in a 96-well microplate, and to each reaction mixture, 5 μL of cell lysate was added. Total protein quantification was performed in each sample by Bradford assay using bovine serum albumin (BSA) as standard. Absorbance at 405 nm was measured using a SpectraMax 190 Microplate Reader (Molecular Devices).
Measurement of cellular reactive oxygen species levels
The levels of intracellular reactive oxygen species (ROS) were measured according to previously described25 using 2′,7′-dichlorofluorescin diacetate (DCF-DA, Sigma-Aldrich Co.). Shortly, cells were washed with saline solution and resuspended in saline solution containing 5 μM of DCF-DA for 30 min in dark at room temperature. Finally, cells were washed with saline solution and cell fluorescence was measured by flow cytometry as described above. Protection assay using the antioxidant N-acetyl-L-cysteine (NAC, Sigma-Aldrich Co.) was also evaluated. In brief, cells were preincubated for 1 h with 5 mM of NAC, followed by incubation with 4 µM of complexes 1 and 2 for 24 h. Cells were then analyzed by FITC Annexin V Apoptosis Detection assay as described above.
Phospho-specific ELISA
Phosphorylated histone H2AX (S139) (ID DYC2288-2), JNK2 (T183/Y185) (ID DYC2236-2), p38α (T180/Y182) (DYC869B-2) and ERK1 (T202/Y204) (ID DYC1825-2) expressions were quantified in cell lysates using sandwich ELISA kits (all from R&D Systems, Inc. Minneapolis, MN, USA), and the analysis was performed according to the manufacturer’s instructions. Shortly, cells were lysed in a buffer solution containing 100 mM tris, pH 7.4, 150 mM NaCl, 1 mM EGTA, 1 mM EDTA, 1% triton X-100 and 0.5% sodium deoxycholate plus phosphatase inhibitor cocktail, protease inhibitor cocktail and 1 mM PMSF immediately before use (all from Sigma-Aldrich Co.). Total protein quantification was performed in each sample by Pierce Protein Assay (Thermo Fisher Scientific, Waltham, MA, USA) using BSA as standard. Absorbance at 450 nm was measured using a SpectraMax 190 Microplate Reader (Molecular Devices, Sunnyvale, CA, USA).
In vivo assays
Animals
Fifty six specific-pathogen-free (SPF) C.B–17 severe combined immunodeficient (SCID) mice (females, 23–26 g) were used in this study. The animals were obtained and maintained at animal facilities from Gonçalo Moniz Institute-FIOCRUZ (Salvador, Bahia, Brazil), and housed in cages with free access to food and water, and kept under a 12:12 h light-dark cycle (lights on at 6:00 a.m.). The animals were treated according to ethical principles for animal experimentation of SBCAL (Brazilian Association of Laboratory Animal Science), Brazil. Experimental protocol have been approved (number 06/2015) by Animal Ethics Committee of Gonçalo Moniz Institute-FIOCRUZ (Salvador, Bahia, Brazil).
Human myeloid leukemia xenograft model
Human myeloid leukemia xenograft model was carry out as described previously by Rodrigues et al.26 with minor modifications. HL-60 cells (2.5 × 10⁷ cells/500 µL) were implanted subcutaneously into the left front armpit of the mice. At the beginning of the experiment, mice were randomly divided into four groups: group 1 animals treated with the vehicle 5% DMSO solution (negative control, n = 14); group 2 animals treated with doxorubicin (positive control, 0.1 mg/kg, n = 14); group 3 animals treated with complex 1 at 20 mg/kg (n = 14); and group 4 animals treated with complex 1 at 40 mg/kg (n = 14). When the tumors reached 100 to 200 mm3 (22 days after HL-60 cells injection), the animals were treated through the intraperitoneal route (200 µL per animal) once a day for 13 consecutive days. One day after the end of the treatment, the animals were anesthetized, and peripheral blood samples were collected from brachial artery. Animals were euthanized by anesthetic overdose, and tumors were excised and weighed.
Toxicological evolution
To assess toxicological aspects, mice were weighed at the beginning and at the end of the experiment as described previously by Rodrigues et al.26. Animals were observed for signs of abnormalities throughout the study. Hematological analysis was performed using the Advia 60 hematology system (Bayer, Leverkusen, Germany). Livers, kidneys, lungs and hearts were removed, weighed and examined for any signs of macroscopic lesions, color changes and/or hemorrhages. After macroscopic examination, tumors, livers, kidneys, lungs and hearts were fixed in 4% formalin buffer and embedded in paraffin. Tissue sections were stained with hematoxylin/eosin staining, and a pathologist performed the histological analyses under optical microscopy.
Statistical analysis
Data are presented as mean ± S.E.M. or inhibitory concentration of 50% (IC50) values with their respective 95% confidence intervals obtained by nonlinear regression. Analysis of variance (ANOVA) followed by Student–Newman–Keuls test was used to check differences between experimental groups (p < 0.05). Statistical analysis was carry out using GraphPad Prism software (Intuitive Software for Science, San Diego, CA, USA).