Characterization of Ru-N-C catalyst
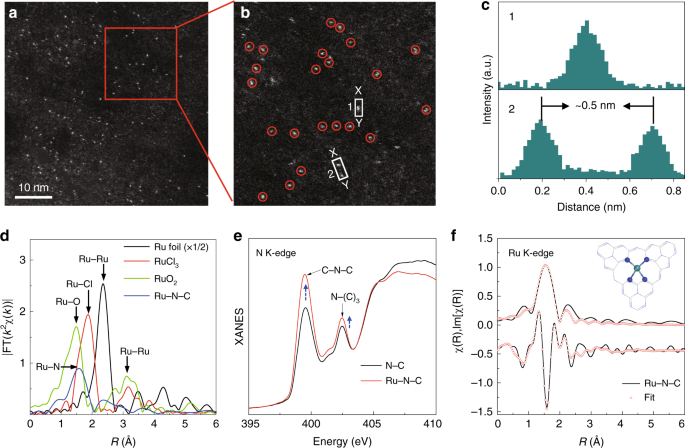
The single-atom Ru catalyst was prepared via a facile wetness impregnation of Ru precursor ruthenium chloride (RuCl3) into the dispersion of phosphide carbon nitride, followed by pyrolysis reaction under argon atmosphere (see Methods). The as-prepared Ru-N-C catalyst shows a two-dimensional nano-sheet structure with no obvious particles or clusters of Ru species, as shown by high-resolution transmission electron microscopy image (Supplementary Fig. 1). Inductively coupled plasma optical emission spectrometry results reveal that the mass loading of the Ru is 1.0 wt. %. Note that carbon nitride with abundant unsaturated N with rich electron lone pairs is an ideal anchoring site for immobilizing metal ions to achieve atomic dispersion. The atomic dispersion of Ru species was confirmed by the high-angle-annular-dark-field scanning transmission electron microscopy (HAADF-STEM) characterization with sub-Å resolution. As shown in Fig. 1a, b, the bright spots corresponding to single Ru atoms (sizes of the bright spots are ~0.2 nm) were homogeneously distributed across the entire N-C framework in Ru-N-C33,34. Moreover, the intensity profiles along with the direction of X–Y in Fig. 1b uncover that the smallest separated distance of Ru atoms is at least ca. 0.5 nm (Fig. 1c), exceeding the Ru-effective atomic radius, verifying the atomically dispersed Ru on the supports. X-ray diffraction (XRD) results (Supplementary Fig. 2) further confirm the absence of Ru particles or clusters in Ru-N-C35,36. Subsequent composition analysis by energy dispersive spectroscopy (EDS) confirms that the obtained Ru-N-C possesses a uniform, uncorrelated spatial distribution of Ru elements throughout the entire sample (Supplementary Fig. 3).

Structural characterizations of Ru-N-C. a Representative HAADF-STEM image of Ru-N-C catalyst. b Magnified HAADF-STEM image of Ru-N-C form the highlighted area of (a), showing that the only bright dots corresponding to isolated Ru atoms exist in Ru-N-C. c Intensity profiles along the lines X–Y in (b). d The Ru k-edge k2-weighted Fourier transform spectra for Ru foil, RuCl3, RuO2, and Ru-N-C. e N K-edge XANES of pristine N-C and Ru-N-C catalysts. f The R-space curve-fitting of ex situ Ru-N-C. Top and bottom curves are magnitude and imaginary part, respectively. Insert shows the structure of the Ru site in Ru-N-C. The balls in gray, blue, and light green represent C, N, and Ru atoms, respectively
Ru K-edge XAFS measurements were conducted to investigate the Ru local environment at atomic-level. As shown in Fig. 1d, the Fourier transform (FT) of the extended XAFS (EXAFS) curve of Ru-N-C catalyst shows only one dominant peak at 1.5 Å, assigned to the nearest shell coordination of Ru-N/C bond, without the appearance of the Ru–Ru peaks at ~2.3 and 3.1 Å in the FT curves of Ru foil and RuO2, respectively. This precludes the aggregation of Ru-related oxides and clusters, in agreement with the above electron microscopy results. Furthermore, the formation of Ru-N coordination can be confirmed by the soft X-ray absorption spectroscopy at N K-edge and C K-edge. Significant variations in the peaks’ intensity can be observed in the N K-edge spectra for the Ru-N-C, whereas no obvious change can be found in C K-edge spectra (Fig. 1e and Supplementary Fig. 4), indicating the strong interaction between N and Ru atoms37. Also, the Cl species in the precursor can be reduced and washed out after pyrolysis and calcination, as demonstrated by ion chromatography and XAFS results in Supplementary Fig. 5. It also should be mentioned that the formation of Ru-O-C structures in the as-obtained Ru-N-C catalyst can be excluded, as confirmed by the O K-edge XAS and O 1s XPS measurements (Supplementary Fig. 6). Meanwhile, the P XPS and 31P solid-state NMR results further demonstrate that partial C atoms have been replaced by P atom, but does not affect the framework (Supplementary Fig. 7). The main purpose of phosphorization is only to improve electrical conductivity of catalyst (Supplementary Fig. 8). Accordingly, the EXAFS fitting analyses were performed as shown in Fig. 1f, and the parameters are summarized in Table S1. The best-fitting results for Ru-N-C clearly show that the major coordination peak originated from the four Ru-N coordination in the form of Ru1-N4configuration with a mean Ru-N bond length of 2.08 Å, suggesting the successful incorporation of the single Ru atoms into the N cavity. Combining the above results, we can conclude that the Ru atoms are atomically dispersed on the N-C support, via bounding with the adjacent four pyridinic-N atoms.
OER performance of Ru-N-C catalyst
The electrocatalytic OER activities of Ru-N-C were evaluated in O2-saturated 0.5 m H2SO4 electrolyte with catalyst-modified glassy carbon electrodes (GCE), along with the results of pristine N-C and commercial RuO2/C for comparison. Figure 2a displays the linear sweep voltammetry curves of all catalysts. Obviously, the as-obtained Ru-N-C exhibits the best acidic OER activity, requiring the lowest overpotential of just 267 mV and 340 mV to achieve a current density of 10 and 100 mA cm−2, respectively, outperforming the RuO2/C (300 mV and 515 mV, respectively). The electrochemically active surface area (ECSA) of Ru-N-C was calculated to be 1.42 cm2 with the roughness factor (RF) of 20, which is twice as high as that of RuO2/C (0.86 cm2 and RF = 12) (Supplementary Fig. 9 and Supplementary Note 1). When normalizing the current density to per ECSA, the specific activity of Ru-N-C still surpasses RuO2/C (Fig. 2b). These results clearly show that the atomic Ru coordinated with N is responsible for the high OER activity.

Electrochemical OER properties. a Electrocatalytic OER performances of the Ru-N-C and commercial RuO2/C in 0.5 m H2SO4 electrolyte. b Normalized linear sweep voltammetry curves to electrochemically active surface area. c TOF and mass activities for Ru-N-C and RuO2/C electrocatalysts. d Tafel slopes for Ru-N-C and RuO2/C electrocatalysts. e Plot of current density and Ru dissolved mass ratio versus time for Ru-N-C at a constant anode voltage of 1.49 V versus RHE in 0.5 m H2SO4 electrolyte. f Time profiles of O2 and H2 evolutions in overall water splitting. All potentials are normalized to RHE
Next, the intrinsic activity of single Ru site was assessed by calculated the TOF (Supplementary Note 2). Notable, the Ru-N-C catalyst displays extremely high intrinsic activity with TOF values up to 3348 O2 h−1 and 13392 O2 h−1 at the overpotential of 267 and 300 mV (Fig. 2c, Supplementary Fig. 10a), respectively, 394 and 503 times relative to those for RuO2/C (8.5 and 26.6 O2 h−1, respectively). Meanwhile, the mass activities of the Ru-N-C are as high as 3571 and 14284 A gmetal−1 at the overpotential of 267 and 300 mV (Fig. 2c, Supplementary Fig. 10b and Supplementary Note 3), respectively, which are 322 and 410 times relative to those of RuO2/C (11.1 and 34.8 A gmetal−1 at 267 and 300 mV, respectively). Moreover, for Ru-N-C, a smaller Tafel slope of 52.6 mV dec−1 and interfacial charge-transfer resistance of 178 Ω were obtained (Fig. 2d and Supplementary Fig. 11), suggesting the faster OER kinetics and electron transfer occurred on single-atomic Ru site. In summary, the performance of the developed Ru-N-C is comparable or superior to other excellent OER catalysts reported to date, such as IrOx/SrIrO338, in acidic media (Supplementary Table 3). Compared with other best catalysts those usually need more-precious metals to deliver activity and reasonable stability in acidic electrolyte, our catalyst is much cheaper, only containing C, N, and Ru (low to 1.0 wt.%).
The stability of the catalyst is another essential figure-of-merit for real application, especially in acidic conditions. The stability of the Ru-N-C was assessed via chronoamperometry method at the applied 1.5 V vs. revised hydrogen electrode (RHE) potential. There is a slight degradation (~5 %) over the 30-hour operation (Fig. 2e), in consistent with the results of 1000th cyclic voltammogram (CV) cycles (Fig. 2a). Furthermore, the excellent structural stability of Ru-N-C can also be verified by detecting the dissolution rate of Ru in acidic solution (Fig. 2e). It can be found that the Ru dissolution ratio of as low as 5% can be detected within 30-h operation for Ru-N-C catalyst. Moreover, the morphology and structure remain nearly unchanged after long-time electrolysis, as demonstrated by TEM, XRD, and XAFS results (Supplementary Fig. 12).
Inspired by the excellent acidic OER performance, we conducted the test of overall water splitting in a two-electrode configuration to directly mimic the PEMWE. The Ru-N-C and commercial Pt/C were used as the anode and cathode, respectively, with the device shown in Supplementary Fig. 13. The amounts of evolved H2 and O2 gas were quantified by means of gas chromatography (Supplementary Fig. 14). Obviously, the Ru-N-C||Pt/C combination exhibits highly full-water splitting activity with mean O2 and H2 evolution rate up to 52 and 104 mmol h−1 cmg−2 (where cmg2 is the electrode area) under the applied voltage of 1.5 V vs. RHE in Fig. 2f, respectively. The quantitative Faradaic gas evolution was at the predicted 2:1 ratio for H2 to O2, within experimental error. Moreover, the electrolyzer can work continuously for 24 h to produce H2 and O2 gaseous products without notable degradation. Considering the exceptional activity and high stability in acidic media, as well as the low cost, the Ru-N-C electrocatalyst may be highly competitive for potential large-scale industrial applications.
Operando SR-FTIR and XAFS during OER
To probe the catalytic intermediate, operando SR-FTIR measurements were conducted, as shown in Fig. 3a. At first sight, there is no obvious absorption band can be discerned over the low-vibration frequency region of 900–600 cm−1 for the catalyst at 1.2 V vs. RHE or lower potentials. When the higher potentials of 1.5 and 1.6 V vs. RHE were applied, however, a new prominent absorption band appeared at ~764 cm−1 in the FTIR spectra (Fig.3b), suggesting the emergence of a crucial intermediate during the OER process. Moreover, when reversing the potential from 1.6 to 1.2 V vs. RHE, the new absorption band gradually disappeared, indicating the reversible adsorption and desorption of intermediate. To clarify the origin of this vibrational absorption band, we calculated via density functional theory (DFT) the different vibrational absorption bands in several possible configurations. As summarized in Supplementary Table 2, we can find that the wavenumber of vibrational absorption band for single oxygen adsorption in the O-Ru1-N4 configuration is quite close to the new peak position observed in the operando SR-FTIR spectra, suggesting that the intermediate species comes from the single oxygen adsorption (O*).

Operando SR-FTIR spectroscopy and XAFS measurements. a Operando SR-FTIR spectroscopy measurements for Ru-N-C during the acid OER. b The enlarged infrared signal at ~764 cm−1. All potentials are normalized referred RHE. c Operando EXAFS spectra and first-shell fitting curves for Ru-N-C at different applied voltages from the open circuit condition to 1.5 V during OER. d Operando XANES spectra for Ru-N-C during OER. Inset: magnified pre-edge XANES region. e Schematic illustration of the effect of oxygen adsorption on the electronic structure of Ru-N-C. f Electron density difference plot of the O-Ru1-N4. Yellow and light green contours represent the electron accumulation and deletion, respectively. The balls in gray, blue, red, white, and light green represent C, N, O, H, and Ru atoms, respectively. All potentials are normalized to RHE
Operando XAFS measurements using a homemade cell were further conducted to access atomic-level insights into the OER process occurred on single-site Ru-N-C catalyst. The micro-interspace porous carbon clothes were used as working electrode for loading catalysts, so as to assure that nearly all the Ru atoms probed by XAFS are participated into the reaction. The applied working potential was 1.5 V versus RHE in O2-saturated H2SO4 electrolyte, and the OER has already occurred at this voltage. Figure 3c displays the EXAFS spectra of the catalyst under open circuit and OER condition. The k2χ(k) functions show different oscillating shape at the low-k range of 4.0–8.0 Å−1 (Supplementary Fig. 15), suggesting the variations of local structures of the single Ru sites. Furthermore, it can be found that, for the FT-EXAFS curve of Ru-N-C catalyst under working conditions (Fig. 3c), the first coordination peak displays low-R shift by 0.07 Å, along with the intensified intensity. As is known, various oxo-containing intermediate species (i.e., O*, OH*, OOH*) would bind on the metal active center during OER process32,39,40,41. Therefore, the variations in FT curves are possibly induced by the adsorption of oxygen-related species. The EXAFS curve-fitting analysis for the first-shell coordination of the catalyst under operando conditions was conducted by considering Ru-N and Ru-O scattering paths, which produce best-fitting quality as shown in Supplementary Figs. 16–17 and Supplementary Table 1. Accordingly, for the catalyst under working condition, the average bond length of Ru-N/O is 2.05 Å, shorter than that of Ru-N (2.08 Å) in the ex situ sample. Meanwhile, the fitted Ru-N bond distance is obviously larger than that of Ru-O bond, which we consider is due to the strong interaction and hybridization for Ru-O coordination. This is also in consistent with the structural relaxation in the theoretical calculations. Moreover, the slight shrinkage in Ru-N bonds could further fix Ru atom on the surface, thus avoiding possible dissolution when facilitating OER, thus improving the stability of Ru single-atom catalyst.
Accompanied by the evolution of local geometric structure, the changes of the Ru electronic structure can be revealed by the operando X-ray absorption near-edge structure (XANES) results at the Ru K-edge (Fig. 3d). Notably, compared with the highly symmetrical RuO2 octahedron, an apparent pre-edge characteristic feature at around 22115 eV, which arises from the dipole-forbidden but quadrupole-allowed transition of Ru 1 s to the unoccupied Ru 4d level, emerges for the catalyst under ex situ and open circuit conditions. The intensity of this shoulder peak is directly proportional to the unoccupied Ru 4d-state15,42. Hence, the unoccupied Ru 4d level in the ex situ catalyst results from electrons transfers from Ru 4d state to N 2p state via strong Ru-N hybridization in the Ru-N4 site. However, under the working conditions of 1.5 V vs RHE, this pre-edge peak intensifies in relation to that under open circuit condition. This suggests the distortion of Ru coordination geometry and more electron transfers from Ru 4d state to the nearby atoms under the working state, which may be induced by the additional oxygen adsorption on the Ru, as demonstrated by the operando SR-FTIR and XAFS analysis. Note that although the average valence state of Ru is slightly increased, it still lies between +3 and +4 valence states, as can be reflected by the absorption edges of XANES spectra for Ru-N-C, RuO2, and RuCl3. However, this weak change of Ru oxidation state are hardly to be discerned by the shift of Ru absorption edge, in consistent with the previous reports43,44. As schematically shown in Fig. 3e, the oxygen adsorption downshifts the Ru 4d band, resulting in greater covalency of the Ru-N/O bond. This point can be reflected by the more charge donations from Ru obtained by the charge density difference via computational simulation (Fig. 3f). Apparently, compared with ex situ Ru-N-C, the Ru atoms donates its electrons mainly to adjacent N atoms and the adsorbed O atom through orbital hybridization in O-Ru-N-C. Consequently, we consider the single-atomic Ru has favorable binding energy with OH*, O*and OOH* intermediates, and is responsible for the high OER activity.
Theoretical insights on OER activity
To gain further insights into the nature of the high activity of the Ru-N-C and its OER mechanism, DFT calculations were conducted (Supplementary Note 4). For the initial Ru-N-C, the model of single Ru atoms coordinated to four neighboring N atoms was simulated (Supplementary Fig. 18), and the average Ru-N bond distance is obtained as 2.02 Å, which is in good agreement with the EXAFS fitting value. Generally, the conventional OER in an acidic medium involves four concerted proton–electron transfer steps on surface metal sites, generating three different intermediate adsorbates: OH*, O*, and OOH* (the asterisk denotes the adsorption site)40. As the Ru site is believed to be the catalytically active center, Fig. 4a and Supplementary Table 4 show the calculated free energy profiles of the OER steps on the Ru site. Obviously, the overpotential-determining step for all the evaluated structural models is the third proton–electron transfer steps of forming OOH* from O*. For the ex situ Ru1-N4, the theoretical overpotential is 0.83 V, significantly larger than the experimental value. It has been reported that, under the OER working potentials, many catalysts would pre-adsorb oxygen species38,45,46. Accordingly, we consider that the equilibrium phase of the Ru-N-C catalyst might be covered by oxygen species, that is, \({\mathrm{Ru}}_1{\hbox{-}}{\mathrm{N}}_{\mathrm{4}} + {\mathrm{H}}_{\mathrm{2}}{\mathrm{O}} \leftrightarrow {\mathrm{H}}_{\mathrm{n}}{\mathrm{O{\hbox{-}}Ru}}_{\mathrm{1}}{\mathrm{\hbox{-}}{N}}_{\mathrm{4}} + {\mathrm{(2}}{\hbox{-}}{\it{n}}{\mathrm{)}}\,{\mathrm{(H}}^{\mathrm{ + }}{\mathrm{ + e}}^{\mathrm{ – }}{\mathrm{)}}\), where n (=0/1) is dependent on the applied potential U. Therefore, O or OH pre-adsorption on the Ru-N-C was considered and computed, and the corresponding free energies of O-Ru1-N4 and HO-Ru1-N4 are calculated by the equation: \(\Delta G = G_{{\mathrm{surf{\hbox{-}}ads}}} – G_{{\mathrm{surf}}} – G_{{\mathrm{H}}_{2}{\mathrm{O}}} + \frac{{{\mathrm{2 – n}}}}{2}G_{{\mathrm{H}}_{2}} – \left( {{\mathrm{2}}{\hbox{-}}n} \right){\mathrm{e}}U.\) As depicted in Supplementary Fig. 19, the Ru atom is likely covered by a single O atom at 1.5 V versus RHE, forming the O-Ru1-N4 configuration. Hence, the resultant overpotential for O-Ru1-N4 is 0.59 V, much lower than that for the ex situ Ru1-N4 and also the HO-Ru1-N4 (0.71 eV) (Fig. 4a and Supplementary Figs. 20–22). It should be noted that the theoretical overpotential might slightly higher than the experimental value because of the simplified models used in the calculation32. Therefore, the theoretical calculations also corroborate our in situ XAFS findings of the oxygen-species adsorption on the Ru. And the decrease of overpotential confirms that the adsorption of single oxygen atom is beneficial for reducing limiting reaction barrier.

Density functional theory calculation for the OER mechanism. a Free energy diagram for OER on Ru1-N4 (red line), O-Ru1-N4 (blue line), and HO-Ru1-N4 (green line). b Schematic of the whole OER mechanism on Ru-N-C catalyst in the acidic electrolyte. The balls in gray, blue, red, white, and light green represent C, N, O, H, and Ru atoms, respectively. All potentials are normalized to RHE
The corresponding adsorption configurations of the intermediate species, and the complete OER mechanism, which enlists several steps are summarized in Fig. 4b. The first activation step consists of the adsorption of single oxygen atom on Ru site to form O-Ru1-N4 site, which then reacts with water through nucleophilic attack followed by deprotonation to generate OOH*. A further proton-coupled electron transfer resulted in the release of O2. To understand why O-Ru1-N4 is the facile phase of the OER, the Bader charges of O-Ru1-N4 and ex situ Ru-N4 were investigated accordingly47. Ru atom donates 0.88 e and 1.17 e in Ru1-N4 and O-Ru1-N4, respectively, implying the slightly increased average valence state of Ru in O-Ru1-N4 during the OER. Hence, we consider that the O-Ru-N4 with higher Ru oxidation state is the real active site for the high OER activity. Therefore, our simulation results give strong support to the vital responsibility of the isolated Ru site coupled to four N coordination together with single oxygen atom adsorption under operando condition for the superior OER activity of Ru-N-C catalyst.