

Central banks led by China and Poland have stepped up gold purchases in 2026, and that backdrop is drawing fresh attention to Gold.com (GOLD) as investors reassess listed exposure to physical metal flows.
See our latest analysis for Gold.com.
Recent trading in Gold.com has been choppy, with the share price falling 5.42% over the last day and 10.32% over the past week. However, the year-to-date share price return of 13.46% and 1-year total shareholder return of 67.55% indicate that longer-term momentum remains positive.
If you are looking beyond Gold.com and want to see how other gold producers are responding to renewed interest in the metal, it is worth checking out the 33 elite gold producer stocks
Gold.com has grown into a sizeable, diversified precious metals business, yet the recent pullback in the share price puts the spotlight on a different issue: is this still a strong company that is simply mispriced, or not mispriced at all?
Most Popular Narrative: 40.9% Undervalued
The most followed narrative currently puts Gold.com’s fair value at $66.75 compared with a last close of $39.45. This points to a sizable valuation gap that hinges on how its growth and margins evolve from here.
The recent string of strategic acquisitions (SGI, Pinehurst, AMS, SGB, LPM) and their ongoing integration are creating operational synergies, broadening distribution channels, and driving efficiencies, positioning A-Mark to capture greater operating leverage and expand net margins as integration matures.
Want to understand why this narrative supports a much higher price for Gold.com? It leans on faster revenue growth, richer margins, and a punchy future earnings multiple. Curious which specific assumptions really move the fair value?
The narrative uses a discount rate of 8.26% to bring those future cash flows and earnings back to today, then applies a higher valuation multiple than before on projected profits. That mix of stronger top line expectations, lower modeled margins than in earlier versions, and a richer future P/E is what lifts the fair value to $66.75 and creates the 40.9% undervaluation signal relative to the current share price of $39.45.
Result: Fair Value of $66.75 (UNDERVALUED)
Have a read of the narrative in full and understand what’s behind the forecasts.
However, the Gold.com story could still be upended if acquisition driven growth fails to deliver cost savings, or if weaker organic demand and higher SG&A persist.
Find out about the key risks to this Gold.com narrative.
Another View: SWS DCF Flags Downside Versus Gold.com Narrative
There is a sharp contrast between the narrative fair value of $66.75 and the Simply Wall St DCF model, which estimates Gold.com’s future cash flow value at $10.21 with the stock trading at $39.45. That gap points to possible overvaluation. The key question is which set of assumptions investors regard as more reliable.
Look into how the SWS DCF model arrives at its fair value.
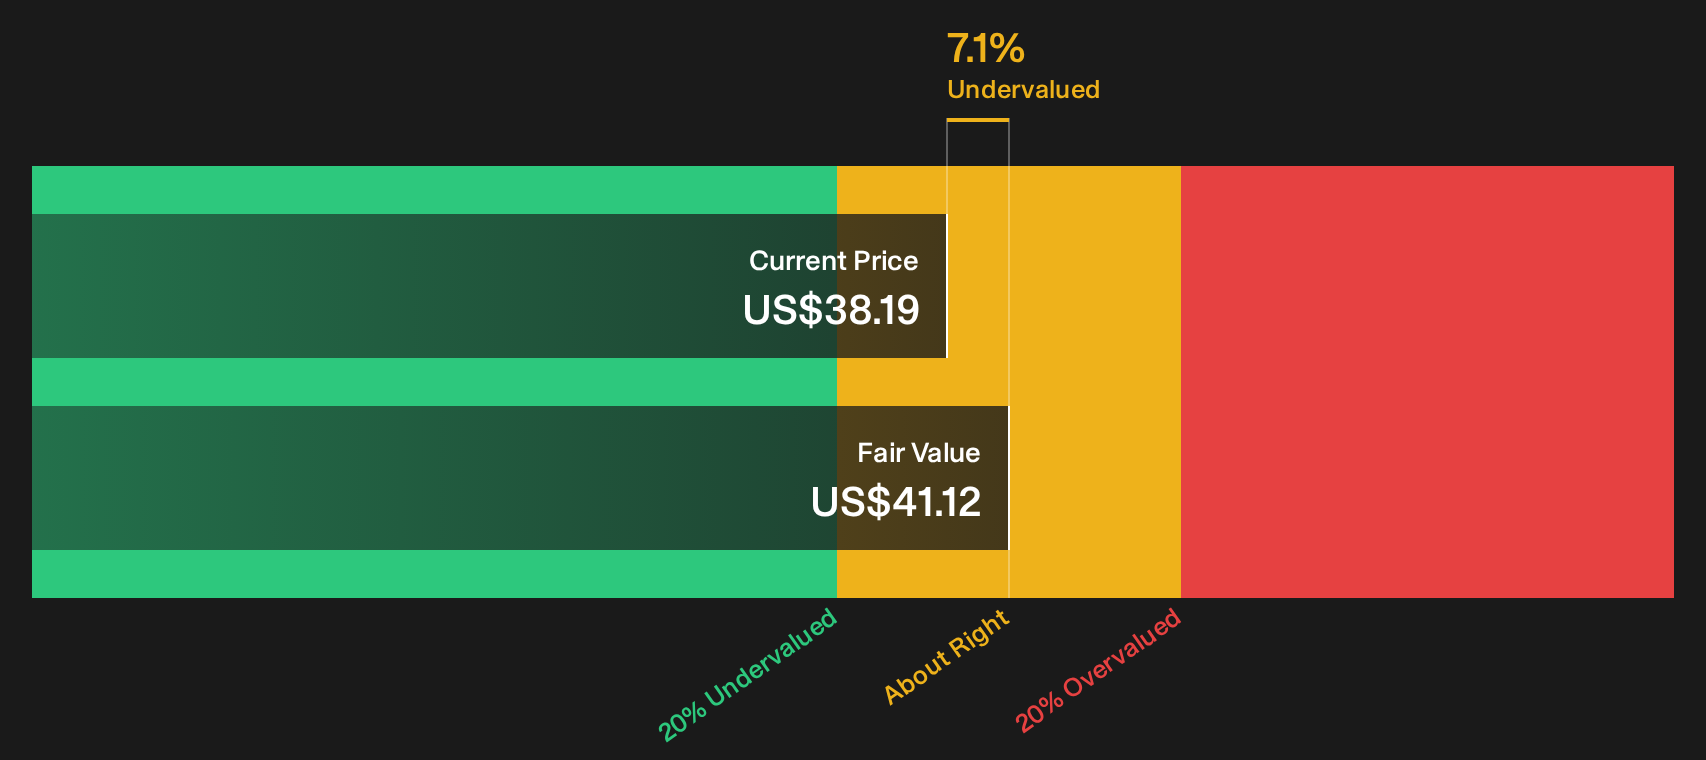
Simply Wall St performs a discounted cash flow (DCF) on every stock in the world every day (check out Gold.com for example). We show the entire calculation in full. You can track the result in your watchlist or portfolio and be alerted when this changes, or use our stock screener to discover 44 high quality undervalued stocks. If you save a screener we even alert you when new companies match – so you never miss a potential opportunity.
Next Steps
Conflicted by the mix of enthusiasm and caution around Gold.com? Take a moment to review the key data points, then weigh up the 3 key rewards and 3 important warning signs
Looking for more investment ideas beyond Gold.com?
If Gold.com has your attention, do not stop there. Broadening your watchlist with other focused stock ideas can help you spot opportunities you might otherwise miss.
Use the Simply Wall St Screener to uncover stocks and themes that match your style before the crowd catches on.
This article by Simply Wall St is general in nature. We provide commentary based on historical data
and analyst forecasts only using an unbiased methodology and our articles are not intended to be financial advice. It does not constitute a recommendation to buy or sell any stock, and does not take account of your objectives, or your
financial situation. We aim to bring you long-term focused analysis driven by fundamental data.
Note that our analysis may not factor in the latest price-sensitive company announcements or qualitative material.
Simply Wall St has no position in any stocks mentioned.
New: Manage All Your Stock Portfolios in One Place
We’ve created the ultimate portfolio companion for stock investors, and it’s free.
• Connect an unlimited number of Portfolios and see your total in one currency
• Be alerted to new Warning Signs or Risks via email or mobile
• Track the Fair Value of your stocks
Have feedback on this article? Concerned about the content? Get in touch with us directly. Alternatively, email editorial-team@simplywallst.com