

Silver continues to balance between its dual role as an industrial metal and so-called refuge asset, and this combination largely explains the lack of a clear trend in recent weeks. Shifting expectations for central bank interest rates can influence the appeal of a non-yielding asset such as silver, while the structural supply deficit remains supported by growing investment demand, offsetting more subdued industrial consumption. These opposing forces help explain why silver prices continue to trade within a broad range, with the market still lacking a decisive catalyst for a sustained directional move.
XAG/USD: Technical Picture
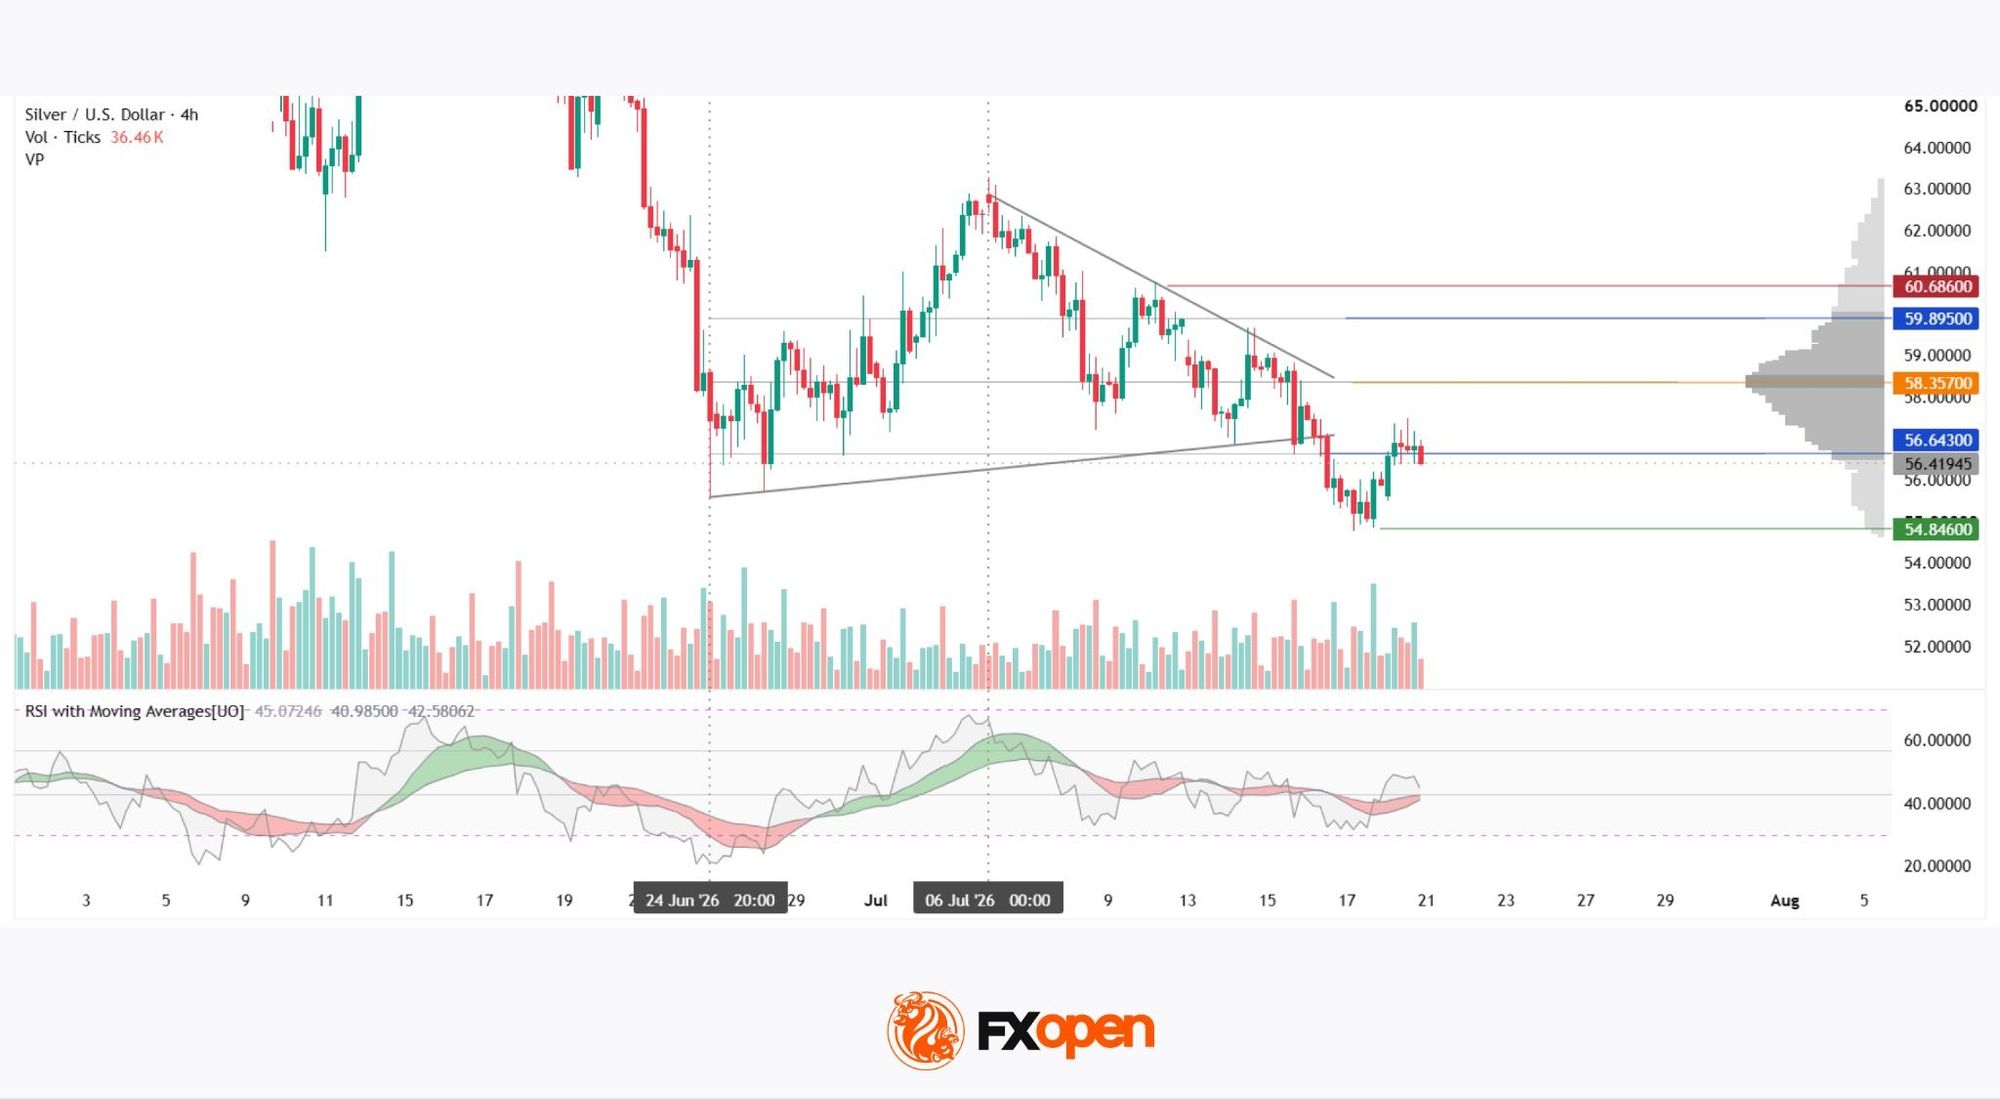
On the four-hour chart, silver (XAG/USD) is trading within a structure resembling a triangle. The descending trendline connects the swing highs formed after the peak near $63.000, while the ascending trendline links the series of higher lows from the $56 area. Their convergence coincides with the current high-volume area of the market profile.
Following an attempted breakout, the price is now testing the lower boundary of the profile at $56.643 from below. If this level continues to act as resistance, the next notable support could be found near $54.846.
Should the price move back into the range, the Point of Control (POC) at $58.357 and the upper boundary of the profile at $59.895 could become the primary upside reference levels, followed by the red resistance level at $60.686.
At the same time, vertical volume has not shown the decline in trading activity that is typically associated with a triangle pattern as the range narrows. The RSI + MAs indicator currently shows readings of 45, 40, and 42. The moving averages remain red, are pointing higher, and are positioned just below the neutral zone, while the RSI line itself has yet to break out of that neutral range.
Summary
The attempted breakout from the triangle has so far failed to gain momentum, with the price returning to the market profile boundary. Meanwhile, the RSI + MAs indicator does not yet confirm either a bullish or bearish scenario. The Federal Reserve meeting on 28–29 July could become the next major catalyst, potentially determining the market’s next directional move.
Start trading commodity CFDs with tight spreads (additional fees may apply). Open your trading account now or learn more about trading commodity CFDs with FXOpen.
This article represents the opinion of the Companies operating under the FXOpen brand only. It is not to be construed as an offer, solicitation, or recommendation with respect to products and services provided by the Companies operating under the FXOpen brand, nor is it to be considered financial advice.