
Theoretical design of Rh single-atom catalysts
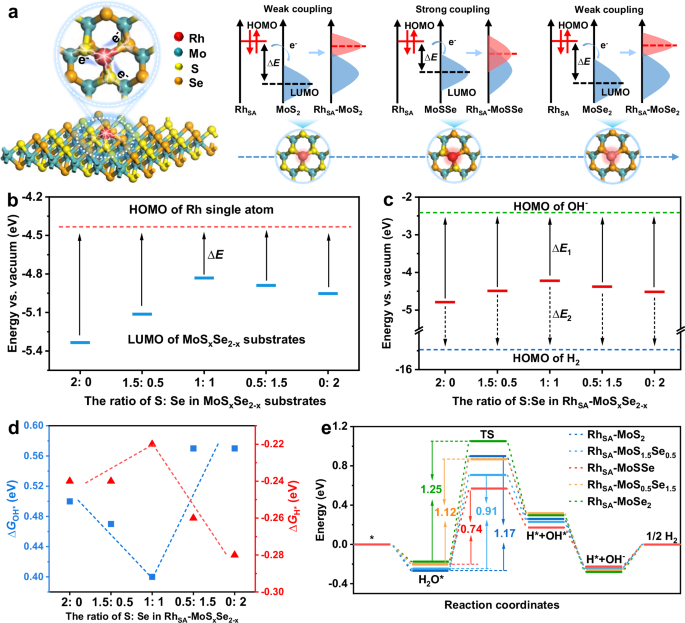
To gain a comprehensive understanding of metal-support frontier orbital interactions, we construct a model system of Rh single-atom catalysts (SACs), in which the HOMO of the Rh single atoms (RhSA) can be effectively modulated by tuning the anion composition in the support (Fig. 1a). First principal density functional theory (DFT) calculations were conducted to investigate the MSIs effects based on the MoSxSe2-x and RhSA-MoSxSe2-x (0 ≤ x ≤ 2) structure models (Supplementary Data 1, Supplementary Figs. 1 and 2). The density of states (DOS) suggests that the incorporation of Rh single-atoms significantly increases the DOS of MoSxSe2-x near the Fermi level (Supplementary Fig. 3). Moreover, the band gap of RhSA-MoSSe (0.68 eV) is narrower than those of RhSA-MoS2 (0.88 eV), RhSA-MoS1.5Se0.5 (0.73 eV), RhSA-MoS0.5Se1.5 (0.70 eV), and RhSA-MoSe2 (0.73 eV), and MoSxSe2-x substrates, thereby promoting accelerated electron transfer and optimizing the adsorption and desorption of reaction intermediates. The calculated HOMO position of freestanding Rh atom is predicted to be around -4.50 eV, whereas the LUMO of MoSxSe2-x substrates exhibit a volcano-type trend with the S: Se ratio, with MoSSe appearing near the volcano apex (Fig. 1b, Supplementary Fig. 4, and Supplementary Note 1). According to the FMO theory32,33,34, the elevated LUMO of MoSSe support narrows the energy gap with the highest occupied molecular orbital (HOMO) of Rh atoms, which promotes orbital hybridizations between Rh atoms and support to lead to a high stability.

a Schematic illustration of modulating MSIs in RhSA-MoSxSe2-x by varying the S: Se ratio of MoSxSe2-x supports. b Calculated LUMO positions of MoSxSe2-x substrates with different S: Se ratios and the HOMO of unsupported Rh atom relative to vacuum. Black arrows highlight the energy discrepancies (ΔE) between the MoSxSe2-x LUMOs and the Rh atom HOMO. c Calculated LUMO positions of Rh single atoms anchored on MoSxSe2-x substrates (red solid line) and the HOMO of OH– (green dashed line) and H2 (blue dashed line) relative to vacuum. Black arrows highlight the energy discrepancies (ΔE1) between the RhSA LUMOs and the OH– HOMO. Black dashed arrows highlight the energy discrepancies (ΔE2) between the RhSA LUMOs and the H2 HOMO. d Correlation between the S: Se ratio and ΔGOH*, and ΔGH* in RhSA-MoSxSe2-x. (e) Gibbs free energy diagram for the HER process at Rh sites of RhSA-MoSxSe2-x. Source data are provided as a Source Data file.
When electrons are transferred from Rh to MoSxSe2-x substrates, the anchored Rh atoms exhibit an unoccupied or partially occupied state (or LUMO) in RhSA-MoSxSe2-x. Therefore, regulating Rh-MoSxSe2-x orbital coupling may facilitate charge transfer and effectively modulate the LUMO position of anchored Rh atoms. As shown in Supplementary Fig. 4c, the projected density of states (PDOS) analysis suggests the LUMO position of Rh atoms exhibits a volcano-type relationship with the S: Se ratio in MoSxSe2-x substrates. The higher LUMO of Rh atoms on MoSSe exhibits smaller energy gaps (∆E1) with the HOMO of OH– and larger energy gaps (∆E2) with the HOMO of H2 molecules (Fig. 1c), which might directly alter the adsorption energies of
key intermediates through systematic tuning of the S: Se ratio in the support. Moreover, the S: Se ratio in RhSA-MoSxSe2-x series exhibits a volcano-type relationship with both the free energy of hydrogen adsorption (ΔGH*) and hydroxide adsorption (ΔGOH*), with RhSA-MoSSe located at the volcano apex, displaying optimal adsorption strengths for both species (H and OH) (Fig. 1d and Supplementary Figs. 5 and 6). To further elucidate the impact of MSIs, we evaluated ΔGH* and ΔGOH* at all possible and thermodynamically stable adsorption sites on both pristine MoSxSe2-x and regions surrounding the Rh atoms in RhSA-MoSxSe2-x. It is worth noting that the introduction of Rh single-atom appears to substantially promote the adsorption of H and OH at Rh sites, synergistically improving both the thermodynamics and kinetics of HER (Supplementary Fig. 7). Gibbs free energy differences for the alkaline HER process in RhSA-MoSxSe2-x and MoSxSe2-x were calculated in Supplementary Figs. 8–23. H2O adsorption at Rh sites in RhSA-MoSxSe2-x is thermodynamically barrier-free and more favorable than at S/Se sites in RhSA-MoSxSe2-x or MoSxSe2-x. The rate-determining step (RDS) for alkaline HER in both systems is H2O dissociation. Moreover, the water dissociation free energy of RhSA-MoSxSe2-x exhibits a volcano-type relationship with the S: Se ratio, with the lowest energy barrier observed at an S: Se ratio of 1: 1 (volcano’s apex). Significantly, the incorporation of a Rh single-atom in RhSA-MoSxSe2-x appears to lower the energy barriers for H2O dissociation, effectively promoting the water dissociation.
Synthesis and characterizations of RhSA-MoSxSe2-x catalysts
Inspired by these DFT results, we synthesized Rh single atoms anchored on a series of MoSxSe2-x with different S and Se ratios to validate the findings. The synthesis strategy for RhSA-MoSxSe2-x is illustrated in Supplementary Fig. 24. First, MoSxSe2-x with different S and Se contents (denoted as MoSxSe2-x, 0 ≤ x ≤ 2) were prepared via a hydrothermal method followed by annealing. Then Rh single-atoms were anchored on the MoSxSe2-x substrates (denoted as RhSA-MoSxSe2-x, 0 ≤ x ≤ 2) using an electrochemical deposition method. The Rh loadings were comparable across the samples (RhSA-MoS2: 0.37 wt.%, RhSA-MoS1.5Se0.5: 0.42 wt.%, RhSA-MoSSe: 0.49 wt.%, RhSA-MoS0.5Se1.5: 0.44 wt.%, and RhSA-MoSe2: 0.39 wt.%), as determined by inductively coupled plasma optical emission spectrometry (ICP-OES) (Supplementary Fig. 25). Given that all RhSA-MoSxSe2-x samples were synthesized using the same Rh precursor concentration, number of scanning cycles, and scanning rate, the observed variation in Rh loading is attributed to differences in substrates conductivity and the strong metal-support interactions35. The principle is as follows: According to the hard-soft acid-base (HSAB) principle36,37,38, the soft acid Rh³⁺ preferentially interacts with the softer base Se over S. Consequently, the higher conductivity of Se than S results in a higher Rh mass loading on MoSe2 than MoS2. Owing to the built-in electric field caused by the electron transfer from Se to S39,40, the MoSxSe2-x with both S and Se anions exhibits superior conductivity and stronger metal-support interaction than MoS2 and MoSe2. In addition, the adsorption energies of Rh atoms on MoS2, MoSSe, and MoSe2 calculated by DFT are -3.66 eV, -3.91 eV, and -3.85 eV, respectively (Supplementary Fig. 26), indicating the stronger metal-support interaction between the Rh atom and MoSSe compared to both MoS2 and MoSe2. Therefore, the mass loading of Rh species on MoSxSe2-x substrates is in the order of MoSSe > MoS0.5Se1.5 ≈ MoS0.5Se1.5 > MoSe2 > MoS2.
Scanning electron microscope (SEM) (Supplementary Fig. 27) and transmission electron microscopy (TEM) (Supplementary Figs. 28 and 29) characterizations revealed that all RhSA-MoSxSe2-x exhibit a similar nanoflower morphology, which promotes the exposure of active sites
and enhances mass transfer. Energy-dispersive X-ray (EDX) spectroscopy elemental analysis confirms the uniform distribution of Rh, Mo, and Se in RhSA-MoSxSe2-x. As shown in Supplementary Figs. 30 and 31, the X-ray diffraction (XRD) patterns and corresponding Raman spectra indicate that all MoSxSe2-x samples maintain the same crystal structures as their parent structures of 2H phase MoS2 (PDF#37-1492) and MoSe2 (PDF#20-0757) without the impurity phase. Moreover, all main diffraction peaks of MoSxSe2-x are shifted toward a small angle with the Se concentration increasing, which is due to the gradual expansion of unit cells upon the substitution of S atoms by larger Se atoms41,42. Additionally, the synthesized RhSA-MoSxSe2-x possess the same crystal structure as the 2H phase of MoSxSe2-x43,44, and no distinct Rh-containing phases detected after Rh electrodeposition. In addition, high-resolution transmission electron microscopy (HRTEM) results (Supplementary Figs. 32 and 33) further confirm that the crystal structures of RhSA-MoSxSe2-x remain well-preserved following Rh decoration.
The structural models of the RhSA-MoS2, RhSA-MoSSe, and RhSA-MoSe2 catalysts are presented in Fig. 2a–c, respectively. The aberration-corrected high-angle annular dark-field scanning TEM (HAADF-STEM) detects the atomically dispersed Rh atoms (bright spots) on the MoSxSe2-x nanosheets (Fig. 2d–f). Furthermore, the different intensity profiles along the dashed yellow rectangles in the HAADF-STEM images confirm the single-atom dispersion of Rh atoms. The Fourier transformed extended X-ray absorption fine spectroscopy (FT-EXAFS) spectra of Rh K-edge in RhSA-MoS2, RhSA-MoSSe, and RhSA-MoSe2 all display a main characteristic peak below 3 Å (Fig. 2g), matching to the Rh-S/Se coordination22,33. In contrast to the Rh foil reference, the absence of a metallic Rh-Rh scattering signal rules out the presence of Rh nanoparticles or clusters, confirming the atomic dispersion of Rh species in RhSA-MoS2, RhSA-MoSSe, and RhSA-MoSe2. The Rh K-edge EXAFS data fitting curves in Supplementary Fig. 34 and corresponding fitting data in Supplementary Table 1 unveiled the mean Ru-S/Se coordination number of the three catalysts was about 3.5, which was consistent with theoretical calculation models. Given the higher ionic radius and relative atomic mass of Se2- compared to S2,3,4,5,6,7,8,9,10,11,12,13,14,15,16,17,18,19,20,21,22,23,24,25,26,27,28,29,30,31,32,33,34,35,36,37,38,39,40,41,42,45, the bond distance of Rh-S (2.3 Å) is shorter than Rh-Se (2.5 Å). Furthermore, Wavelet transformed EXAFS (WT-EXAFS) contour plots reveal single intensity maxima for Rh in RhSA-MoS2, RhSA-MoSSe, and RhSA-MoSe2 at approximately 6.7, 8.0, and 9.4 Å-1 (Fig. 2h), corresponding to the Rh-S, Rh-S/Se, and Rh-Se coordination paths34, respectively. Notably, both the coordination path lengths and k-space positions of Rh-S/Se exhibit a linear correlation with the S: Se ratio in RhSA-MoSxSe2-x (Fig. 2i), providing further evidence that Rh single-atoms are covalently bonded to S/Se and that their coordination environment can be precisely tuned by adjusting the Se: S ratio in MoSxSe2-x substrates.

Structural models of a RhSA-MoS2, b RhSA-MoSSe, and c RhSA-MoSe2. HAADF-STEM images of d RhSA-MoS2, e RhSA-MoSSe, and f RhSA-MoSe2, with corresponding intensity profiles derived from the regions marked by red dashed rectangles (yellow dashed circles highlight selected single-atomic Rh sites). g Rh K-edge EXAFS spectra in R-space for Rh foil, RhSA-MoS2, RhSA-MoSSe, and RhSA-MoSe2. h WT-EXAFS contour plots of Rh for RhSA-MoS2, RhSA-MoSSe, and RhSA-MoSe2. i Correlation between the S: Se ratio, Rh-S/Se coordination path length, and the k-space positions in RhSA-MoSxSe2-x. Source data are provided as a Source Data file.
As shown in Fig. 3a, the synergistic electronic interactions among Rh, S, and Se in RhSA-MoSxSe2-x are characterized through Rh-S, S-Rh-Se, and Rh-Se coordination units. Owing to the higher polarizability volume and larger covalent radii of Se than S41,42,45, the closer size match between S 3p and Rh 4 d orbitals and the shorter Rh-S bond facilitates more effective orbital overlap, resulting in strong σ-bonding and weak π-back bonding in Rh-S bond. Moreover, the higher polarizability and more diffuse 4p orbitals of Se enhance its π-acceptor capacity, leading to stronger π-back bonding and weak σ-bonding in Rh-Se bond. The bonding characteristics and strength of the Rh-S and Rh-Se bonds in RhSA-MoSxSe2-x were investigated using crystal orbital Hamilton population (COHP) and integrated COHP (ICOHP) analysis (Fig. 3b). The COHP curves of All three systems show dominant bonding states below the Fermi level, confirming stable Rh-S and Rh-Se bonds46,47, with ICOHP values of -1.16 (RhSA-MoS2), -1.21 (RhSA-MoSSe), and -1.17 (RhSA-MoSe2). Notably, the more negative ICOHP value of Rh-MoSSe indicates a stronger covalent interaction due to the asymmetric structure that polarizes the electron density and enhances orbital overlap. However, the three systems exhibit slightly different anti-bonding characteristics near the Fermi level. RhSA-MoS2 displays more pronounced anti-bonding features suggestive of partial occupation of destabilizing states than RhSA-MoSe2, while RhSA-MoSSe exhibits an intermediate level that reflects its asymmetric chalcogen environment. Charge density difference (CDD) analyses reveal charge redistribution between Rh single-atoms and coordinated S/Se atoms48,49, resulting in a marked reduction of electron density around Rh atoms (Supplementary Fig. 35a). Bader charge analysis quantifies such electron transfer, affording positive values of 0.22 |e| (Rh-MoS2), 0.14 |e| (Rh-MoSSe), and 0.01 |e| (Rh-MoSe2), which further confirm the electron donation from Rh to the substrates. The substantial transfer in Rh-MoS₂ (0.22 |e | ) signifies strong ionic character, while the negligible transfer in Rh-MoSe₂ (0.01 |e | ) confirms a nearly non-ionic interaction. Thus, the decreasing Bader charges quantitatively capture the transition from polar ionic-covalent bonding in Rh-MoS2 to weak covalent bonding in Rh-MoSe2, fully consistent with the CDD observations.

a Schematic depiction of electronic interactions among Rh, S, and Se in RhSA-MoSxSe2-x. b The COHP analysis of Rh-S, Rh-S/Se, and Rh-Se bonds in RhSA-MoS2 (left), RhSA-MoSSe (middle), and RhSA-MoSe2 (right). c Rh K-edge XANES spectra for RhSA-MoS2, RhSA-MoSSe, and RhSA-MoSe2. d Fitted average oxidation states of Rh derived from XANES spectra. e Rh 3 d XPS spectra for RhSA-MoS2, RhSA-MoS1.5Se0.5, RhSA-MoSSe, RhSA-MoS0.5Se1.5, and RhSA-MoSe2. f Correlation between the S: Se ratio, Rh oxidation state, and Rh 3d5/2 binding energy in RhSA-MoSxSe2-x. Source data are provided as a Source Data file.
X-ray photoelectron spectroscopy (XPS) and X-ray absorption near-edge structure (XANES) analyses were performed to elucidate the electronic structures and chemical compositions of RhSA-MoSxSe2-x catalysts. Rh K-edge XANES spectra (Fig. 3c) reveal a positive shift in edge absorption energies of Rh single-atoms with increasing Se content, confirming effective modulation of the Rh electronic structure through variation of the Se: S ratio. Quantitative analysis of the XANES data indicates oxidation states of Rh single-atom in RhSA-MoS2, RhSA-MoSSe, and RhSA-MoSe2 are +1.67, +1.36, and +0.74, respectively (Fig. 3d). Relative to Rh0 foil (4d85s1) and RhⅢ2O3 (4d55s1) standards, the d-band hole count for RhSA-MoSSe is estimated to be 3.36, lower than that of RhSA-MoS2 (3.67) but higher than RhSA-MoSe2 (2.74), reflecting moderate d-orbital vacancy induced by d–p orbital hybridization in RhSA-MoSxSe2-x50. High-resolution Rh 3 d XPS spectra (Fig. 3e) show a negative shift in binding energies with increasing Se contents, consistent with XANES results. Both the Rh oxidation state and Rh 3d5/2 binding energy exhibit a linear correlation with the S: Se ratio in RhSA-MoSxSe2-x (Fig. 3f). High-resolution Mo 3 d, S 2p, and Se 3 d spectra further confirm
the successful synthesis of RhSA-MoSxSe2-x variants with distinct S:Se ratios43,50 (Supplementary Fig. 35b–d). Collectively, these electronic structure characterizations demonstrate that the d-band structure of Rh single-atoms can be precisely tuned by modulating the S: Se ratio of MoSxSe2-x supports via MSIs. The electronic properties of RhSA-MoSxSe2-x and MoSxSe2-x were further probed through work function (Wf) measurements using ultraviolet photoelectron spectroscopy (UPS). As shown in Supplementary Fig. 36, Wf displays a volcano-type dependence on the S: Se ratio for both RhSA-MoSxSe2-x and MoSxSe2-x, with RhSA-MoSSe exhibiting a significantly lower Wf (3.54 eV) compared to RhSA-MoS2 (3.75 eV), RhSA-MoSe2 (4.04 eV), and pristine MoSxSe2-x substrates (5.51 ~ 5.71 eV). The incorporation of Rh single atoms and the precise tuning of the S: Se ratio in MoSxSe2-x markedly enhance electron transfer capabilities, thereby facilitating the adsorption and activation of reactants.
Electrocatalytic HER performance of RhSA-MoSxSe2-x
Electrochemical measurements were performed to elucidate the impact of the d-band structure of Rh single atoms on alkaline HER performance. As shown in the 95% iR-compensated linear sweep voltammetry (LSV) curves (Fig. 4a and Supplementary Fig. 37c and d), RhSA– MoSSe exhibits HER activity, achieving a low overpotential of 46 mV at a current density of 10 mA cm-2, outperforming RhSA-MoS2 (122.5 mV), RhSA-MoS1.5Se0.5 (65.5 mV), RhSA-MoS0.5Se1.5 (70.5 mV), RhSA-MoSe2 (91 mV), pristine MoSxSe2-x substrates, and commercial Pt/C catalysts. Moreover, the LSV curves of all samples without iR calibration were provide in Supplementary Fig. 37a and b. Specifically, RhSA-MoSSe demonstrates a high mass activity of 3.48 A mg-1 (normalized to Rh loading) at an overpotential of 100 mV, approximately 50-fold higher than that of commercial Pt/C (0.07 A mg-1). Tafel plots were analyzed to probe HER kinetics51 (Supplementary Fig. 37c and d), revealing that RhSA-MoSSe possesses a significantly lower Tafel slope (56 mV dec-1) compared to RhSA-MoS2 (111 mV dec-1), RhSA-MoS1.5Se0.5 (94 mV dec-1), RhSA-MoS0.5Se1.5 (84 mV dec-1), RhSA-MoSe2 (99 mV dec-1), Pt/C (40-121 mV dec-1), and MoSxSe2-x substrates, indicating accelerated Volmer reaction kinetics. Moreover, we have added the relationship between the computed ∆G(H2O) and experimental overpotential required to achieve a current density of 10 mA cm-2 (ŋ10) based on the Brønsted-Evans-Polanyi (BEP) relationship7. As shown in Supplementary Fig. 40c, a lower ∆G(H2O) corresponds to a smaller overpotential and thus significantly enhanced alkaline HER activity, suggesting the critical role of water dissociation kinetics in determining the overall alkaline HER performance. In this work, the water dissociation barrier of RhSA-MoSxSe2-x is limited to 0.74 eV due to the modulation scope of EMSI in TMD-based supports. Therefore, future high-performance alkaline HER electrocatalysts should be rationally designed by constructing active sites with intrinsically low water-dissociation energy and by optimizing electronic structures to further reduce ΔG(H2O), thereby promoting water-dissociation kinetics and enhancing alkaline HER activity.

a HER polarization curves for RhSA-MoS2, RhSA-MoS1.5Se0.5, RhSA-MoSSe, RhSA-MoS0.5Se1.5, RhSA-MoSe2, and Pt/C catalysts, with 95% iR compensation. The electrolyte resistance (Rs) is 1.4 ohm and the electrode surface area is 1 cm-2. b Radar chart illustrating Overpotential (at 10 mA cm-2), Tafel slope, TOF (at −100 mV vs. RHE), Cdl, and intrinsic activity for RhSA-MoS2, RhSA-MoS1.5Se0.5, RhSA-MoSSe, RhSA-MoS0.5Se1.5, and RhSA-MoSe2. c Correlation between the S: Se ratio and the H and OH adsorption strengths of RhSA-MoSxSe2-x. d Enhancement rates of RhSA-MoSxSe2-x relative to pristine MoSxSe2-x in terms of HER activity, Tafel slope, ECSA, and intrinsic activity. e Stability evaluation of RhSA-MoSSe under step-change current density of 10, 50, 100, and 200 mA cm-2. f Chronoamperometric (CP) curves of Pt/C, MoSSe, RhSA-MoS2, RhSA-MoSSe, and RhSA-MoSe2 at a current density of 1 A cm-2. g Polarization curve of RhSA-MoSSe | |NiFe LDH@NF, MoSSe | |NiFe LDH@NF, and Pt/C | |NiFe LDH@NF in the AEMWE operated in 1 M KOH at 80 °C. h Stability test of RhSA-MoSSe | |NiFe LDH@NF, MoSSe | |NiFe LDH@NF, and Pt/C | |NiFe LDH@NF in the AEMWE at 1 A·cm-2. Inset: schematic diagram of an AEMWE. Source data are provided as a Source Data file.
The catalyst’s mass activity is fundamentally determined by the product of the electrochemically active surface area (ECSA, normalized by mass) and the specific activity (SA, catalytic current normalized by ECSA)52,53,54. In contrast to the geometrical surface area, the ECSA represents the actual surface area accessible to the electrolyte. The ECSA were estimated via double-layer capacitances (Cdl) measurements derived from cyclic voltammogram (CV) (Supplementary Figs. 38 and 39). Owing to the built-in electric field and in-plane dipole moment caused by the electron transfer from Se to S39,40, the MoSxSe2-x with both S and Se anions exhibits superior conductivity and hydrophilic than MoS2 and MoSe2. Moreover, the introduction of Rh increases the number of active sites and enhances charge transfer efficiency. Therefore, RhSA-MoSSe exhibits the highest Cdl (92.6 mF cm-2) compared to RhSA-MoS2 (52.4 mF cm-2), RhSA-MoS1.5Se0.5 (65.5 mF cm-2), RhSA-MoS0.5Se1.5 (74.4 mF cm-2), RhSA-MoSe2 (52.5 mF cm-2), and pristine MoSxSe2-x substrates, suggesting a greater abundance of exposed active sites. Normalizing activity by ECSA thus offers a more accurate and meaningful metric for evaluating the catalytic properties of diverse electrocatalysts, accounting for variations in size, shape, morphology, topography, and porosity55,56. Therefore, polarization curves of RhSA-MoSxSe2-x and MoSxSe2-x samples, normalized to ECSA, confirm the superior intrinsic activities of RhSA-MoSSe (Supplementary Fig. 40).
The turnover frequency (TOF) of RhSA-MoSSe at -100 mV vs. RHE (19.34 s-1) surpasses that of RhSA-MoS2 (2.15 s-1), RhSA-MoS1.5Se0.5 (6.05 s-1), RhSA-MoS0.5Se1.5 (9.89 s-1), RhSA-MoSe2 (6.97 s-1), and is competitive with most reported noble metal-based and transition metal dichalcogenide (TMD) catalysts12,13,17,50,57,58,59,60,61,62 (Supplementary Fig. 41d and Supplementary Table 2). Moreover, the faradaic efficiency of RhSA-MoSSe surpasses that of RhSA-MoS2 (2.15 s-1), RhSA-MoS1.5Se0.5 (6.05 s-1), RhSA-MoS0.5Se1.5 (9.89 s-1), RhSA-MoSe2 (6.97 s-1), MoSxSe2-x substrates, and Pt/C (Supplementary Fig. 41e). Notably, the S: Se ratio in RhSA-MoSxSe2-x exhibits a volcano-type relationship with HER activity, Tafel slope, Cdl, intrinsic activity, and TOF, with RhSA-MoSSe at the volcano’s apex displaying optimal overall HER performance (Supplementary Fig. 41a–c). This underscores the effectiveness of precisely tuning the d-band structure of Rh single-atoms to enhance HER activity and kinetics. To further quantify the impact of MSIs modulation via the S:Se ratio variation in MoSxSe2-x supports, the enhancement rates of RhSA-MoSxSe2-x relative to pristine MoSxSe2-x substrates were evaluated for activity, Tafel slope, ECSA, and intrinsic activity, based on the following equation:
$${\delta }_{{{\rm{Enhancerate}}}}=\frac{\left|{N}_{{{{\rm{Rh}}}}_{{{\rm{SA}}}}-{{{\rm{MoS}}}}_{{{\rm{x}}}}{{{\rm{Se}}}}_{2-{{\rm{x}}}}}-{N}_{{{{\rm{MoS}}}}_{{{\rm{x}}}}{{{\rm{Se}}}}_{2-{{\rm{x}}}}}\right|}{{N}_{{{{\rm{MoS}}}}_{{{\rm{x}}}}{{{\rm{Se}}}}_{2-{{\rm{x}}}}}}\times 100\%$$
The enhancement rate (δEnhance rate) is defined as the ratio of the performance metrics (activity, Tafel slope, ECSA, and intrinsic activity) for RhSA-MoSxSe2-x (NRhSA-MoSxSe2-x) relative to those for pristine MoSxSe2-x (NMoSxSe2-x). Notably, the enhancement rates for activity, Tafel slope, ECSA, and intrinsic activity exhibit a volcano-type dependence on the S: Se ratio, with the highest enhancement rate observed at an S: Se ratio of 1: 1 (volcano’s apex) (Fig. 4d). Moreover, the Pt and Ru single atoms anchored on MoSxSe2-x were also successfully synthesized to demonstrate the generality of the design strategy. The XRD of RuSA-MoSSe and PtSA-MoSxSe2-x was shown in Supplementary Fig. 42, confirming that no diffraction peaks of Ru or Pt nanoparticles were observed. Additionally, the SEM and corresponding elemental mapping results reveals the uniform distribution of every element (Supplementary Figs. 43 and 44). Notably, the S: Se ratio in both RuSA-MoSxSe2-x and PtSA-MoSxSe2-x exhibits a volcano-type relationship with HER activity and Tafel slope, with RuSA-MoSSe and PtSA-MoSSe at the volcano’s apex displaying optimal overall HER performance (Supplementary Figs. 45 and 46).
The strong interaction between OH* species and catalysts surfaces is well-established for accelerating water dissociation in the HER4,7. To probe the OH adsorption capacity at CO adsorption sites9, CO-stripping voltammetry was employed to assess the water dissociation capabilities of the RhSA-MoSxSe2-x catalysts (Supplementary Fig. 47a). Among them, RhSA-MoSSe exhibited the lowest onset potential for CO oxidation (0.28 V), compared to RhSA-MoS2 (0.31 V), RhSA-MoS1.5Se0.5 (0.30 V), RhSA-MoS0.5Se1.5 (0.30 V), and RhSA-MoSe2 (0.32 V), indicating a stronger Rh-OH interaction and enhanced water dissociation kinetics. The H adsorption ability of RhSA-MoSxSe2-x catalysts was evaluated through the desorption of underpotential-deposited hydrogen (Hupd)9,10,63. As shown in Supplementary Fig. 47b, RhSA-MoSSe displayed a notably low Hupd potential (0.12 V), compared to RhSA-MoS2 (0.26 V), RhSA-MoS1.5Se0.5 (0.15 V), RhSA-MoS0.5Se1.5 (0.15 V), and RhSA-MoSe2 (0.16 V), facilitating H recombination during HER. Furthermore, the S: Se ratio in RhSA-MoSxSe2-x catalysts exhibited a volcano-type correlation with both OH and H adsorption strengths, with RhSA-MoSSe at the volcano’s apex demonstrating optimal adsorption capabilities for both H and OH (Fig. 4c), consistent with theoretical predictions. The catalyst’s stability across varying current densities was evaluated through multi-step current experiments, where the potential rapidly stabilized at each step, indicating efficient mass transport at the electrode surface during the HER (Fig. 4e). Long-term durability of RhSA-MoSSe was assessed via chronopotentiometry, demonstrating negligible potential decay over 450 h at a high current density of 1 A cm-2, outperforming the commercial Pt/C, MoSSe, RhSA-MoS2, and RhSA-MoSe2 (Supplementary Fig. 48). The experimental findings are fully consistent with the trends predicted by the above DFT calculations. Moreover, the stability time of RhSA-MoSSe at 1 A cm-2 is competitive with most reported noble metal-based and transition metal dichalcogenide (TMD) catalysts (Fig. 4f and Supplementary Table 3)13,17,51,57,58,59,64,65,66,67,68,69,70,71,72,73,74,75,76. These findings underscore the catalyst’s robust electrochemical stability and potential for industrial applications. Structural integrity of RhSA-MoSSe post long-term HER testing was investigated using XRD, SEM, HAADF-STEM, and XPS. XRD analysis (Supplementary Fig. 49) confirmed that the crystal structure of RhSA-MoSSe remained intact after extended HER operation. SEM (Supplementary Fig. 50) and HAADF-STEM (Supplementary Fig. 51) images verified that RhSA-MoSSe retained its original morphology and atomic dispersion of Rh after 500 h testing. XPS analysis (Supplementary Fig. 52) further revealed that the oxidation states of Rh, Mo, S, and Se in RhSA– MoSSe remained stable and unaltered post testing. Collectively, these structural characterizations demonstrate that RhSA-MoSSe exhibits HER activity and stability, attributed to the precise tuning of the Rh single-atoms d-band structure, which optimizes intermediate adsorption energies and significantly enhances alkaline HER performance.
The anion exchange membrane water electrolyzer (AEMWE) tests were employed to further evaluate the application potential of RhSA-MoSSe catalyst for industrial water splitting. The homemade NiFe LDH@NF as an anode electrocatalyst (Supplementary Fig. 53) was assembled with RhSA-MoSSe and operated in 1.0 M KOH electrolyte at 80 °C. The polarization curves showed the RhSA-MoSSe | |NiFe LDH@NF exhibit a cell voltage of 1.58 V and 1.70 V at current densities of 0.5 A cm-2 and 1.0 A cm-2 for AEMWE, respectively, which is superior to commercial Pt/C | |NiFe LDH@NF and MoSSe | |NiFe LDH@NF systems (Fig. 4g). Furthermore, the AEMWE of RhSA-MoSSe | |NiFe LDH@NF was continuously operated for over 500 h at a current density of 1 A cm-2 (Fig. 4h). The overpotential at 1.0 A cm-2 and stability time of were comparable to those of recently reported catalysts for AEMWE (Supplementary Table 4)9,59,66,67,68,69,70,73,76,77. The above results confirm the advanced and reliable potential of the RhSA-MoSSe catalyst for industrial water-splitting applications.
Mechanism insights into catalytic activity
Operando electrochemical impedance spectroscopy (EIS) was conducted to probe charge-transfer kinetics and elucidate HER78. The equivalent circuit for both RhSA-MoSxSe2-x and pristine MoSxSe2-x comprises four components: electron transfer resistance (R) from the cathode to the interface (R1, part 1), accumulation of reaction intermediate (Volmer step, R2, part 2), charge transfer during the interfacial reaction (Heyrovsky step, R3, part 3), and electrolyte resistance (Rs, part 4) (Fig. 5a). The low-frequency region is primarily associated with the Volmer step, while the high-frequency region reflects electron transfer from the catalyst’s inner layer to surface-active sites, driven by distinct relaxation time. Bode plots at overpotential of 100 mV (Fig. 5b) reveal significantly reduced phase angles at low frequencies for RhSA-MoSxSe2-x compared to MoSxSe2-x supports, indicating that Rh single-atoms enhance the Volmer step kinetics. Analysis of Nyquist plots and optimized fitting parameters (Fig. 5c–f) shows that RhSA-MoSxSe2-x catalysts exhibit substantially lower charge transfer resistances than their pristine MoSxSe2-x counterparts. Notably, R1, R2, and R3 display a volcano-type dependence on the S: Se ratio in both RhSA-MoSxSe2-x and MoSxSe2-x, with RhSA-MoSSe at the volcano’s top exhibiting the lowest R1, R2, and R3 values, signifying accelerated HER charge transfer kinetics and a rapid Faradaic reaction at the catalyst-electrolyte interface. Operando EIS measurements at varying applied biases further clarify the charge transfer dynamics and HER mechanism of RhSA-MoSxSe2-x. Bode plot (Fig. 5g) for RhSA-MoS2, RhSA-MoSSe, and RhSA-MoSe2 reveal a single phase-angle peak spanning low-frequency (Volmer step) and mid-frequency (Heyrovsky step) regions as the applied bias decreases, suggesting that RhSA-MoSxSe2-x follows a mixed Heyrovsky-Volmer and Tafel-Volmer mechanism rather than a singular Heyrovsky-Volmer pathway. Notably, RhSA-MoSSe exhibits a smaller phase angle and a faster phase-angle decrease rate (0.05 to -0.05 V) compared to RhSA-MoS2 and RhSA-MoSe2 (Fig. 5h), further confirming its superior HER kinetics.

a Equivalent circuit-fitted EIS date and schematic representation of the mass and charge transfer processes for RhSA-MoSxSe2-x and pristine MoSxSe2-x. b Corresponding Bode plots and c Nyquist plots of RhSA-MoSxSe2-x and MoSxSe2-x at −0.1 V vs. RHE. Correlation between the S: Se ratio and the resistance (R) components d R1, e R2, and f R3 in RhSA-MoSxSe2-x and MoSxSe2-x. g In situ bode plots for RhSA-MoS2, RhSA-MoSSe, and RhSA-MoSe2. h Frequency dependence of phase changes in Bode plots for RhSA-MoS2, RhSA-MoSSe, and RhSA-MoSe2. Source data are provided as a Source Data file.
To elucidate the enhanced alkaline HER activity of RhSA-MoSSe, operando infrared absorption (IR) spectroscopy and in situ Raman spectroscopy were employed to investigate adsorption site and binding energy dynamics of reaction intermediates under HER operating conditions (Supplementary Figs. 54 and 55). As shown in Fig. 6a, with decreasing bias potential, distinct absorption peaks emerged at approximately 1030, 1621, and 3200 ~ 3600 cm-1. The peak at ~1030 cm-1 is attributed to S/Se-OH formation, while the broad peak at 3200 ~ 3600 cm-1 and the peak located at ~1621 cm-1 for RhSA-MoS2, RhSA-MoSSe, and RhSA-MoSe2 correspond to the O-H stretching and δ(H-O-H) bending modes of interfacial water molecules, respectively63,79. Moreover, water-related peaks for RhSA-MoSSe appeared at a more positive potential (0.15 V) compared to RhSA-MoS2 (0.1 V) and RhSA-MoSe2 (0.1 V), indicating that RhSA-MoSSe facilitates water dissociation more effectively. The vibrational Stark effect, which describes potential-dependent shifts in adsorbate vibrational frequencies3, reveals that S/Se-OH in RhSA-MoSSe is more responsive to the local electric field than in RhSA-MoS2 and RhSA-MoSe2, as evidenced by steeper Stark slopes (Fig. 6b). In-situ Raman spectroscopy further probed the catalytic processes in RhSA-MoSxSe2-x during alkaline HER. As presented in Fig. 6c, Raman peaks at ~1522 and ~1395 cm-1 for RhSA-MoSSe emerged at 0.15 V, corresponding to adsorbed OH species generated during the HER58. In contrast, OH-related Raman peaks for RhSA-MoS2 and RhSA-MoSe2 appeared at 0.1 V, underscoring the stronger OH binding and accelerated water dissociation kinetics of RhSA-MoSSe. Additionally, the Stark slopes for *OH in RhSA-MoSSe indicate greater sensitivity to the local electric field compared to RhSA-MoS2 and RhSA-MoSe2 (Fig. 6d). These findings suggest that precise modulation of the S: Se ratio optimizes OH adsorption at Rh single atom sites, thereby enhancing H2O adsorption and dissociation (Fig. 6e).

a Operando attenuated total reflectance Fourier-transform infrared (ATR-FTIR) spectra of RhSA-MoS2, RhSA-MoSSe, and RhSA-MoSe2. b Frequency dependence of S/Se-OH modes variations in ATR-FTIR spectra at different potentials. c In situ Raman spectra of RhSA-MoS2, RhSA-MoSSe, and RhSA-MoSe2. d Frequency dependence of stretching mode variations in Raman spectra at different potentials. e Schematic illustration of the water dissociation trends for RhSA-MoS2, RhSA-MoSSe, and RhSA-MoSe2. Source data are provided as a Source Data file.