
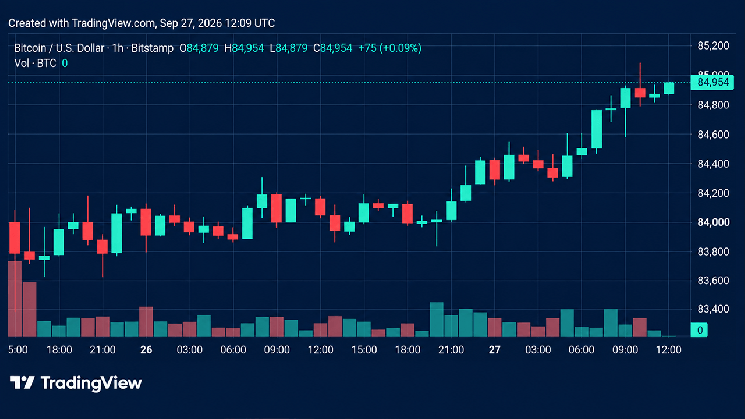
One-Hour Chart: Bitcoin Takes Another Crack at $85,000
The one-hour chart shows bitcoin’s price steadily clawing back ground following its Sept. 23 retreat into the low-$83,000s. After spending Sept. 24-25 trading between approximately $83,300 and $85,300, $BTC has worked its way toward $84,870, putting the $85,000 threshold squarely in the spotlight.
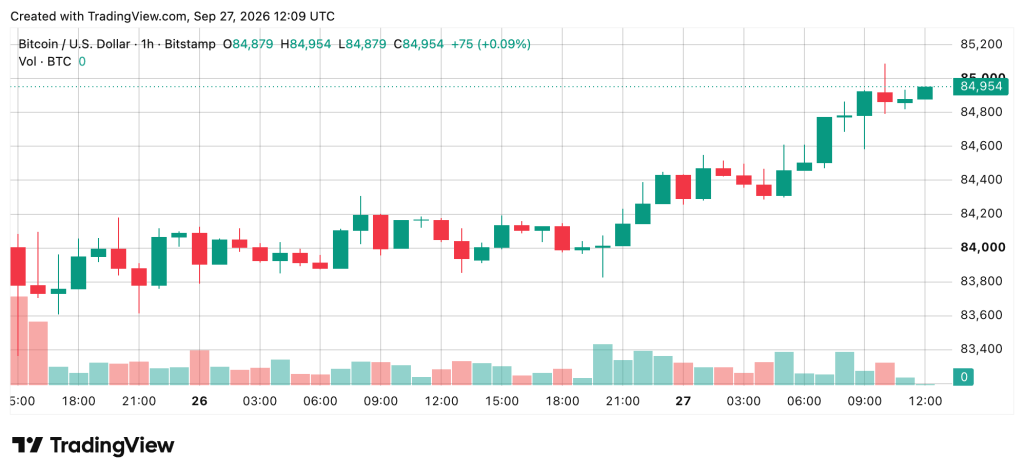
However, the latest advance has unfolded on considerably lighter volume than the Sept. 21-23 trading activity. A sustained move above $85,000 would bring $85,300 and eventually $87,374 back into focus, while rejection at the overhead barrier could keep $BTC confined to its recent trading range. Losing $84,000, followed by $83,300, would put the two-day recovery in a bind.
Four-Hour Chart: Recovery Gains Ground, but Resistance Awaits
The four-hour chart tells a similar story, although the broader picture reveals just how far bitcoin’s price range has traveled since its mid-September low of $74,913. Following the sharp advance into $87,374 between Sept. 18 and Sept. 22, $BTC took it on the chin, retreating into the 83,000-84,000 neighborhood before gradually recovering toward $85,000.
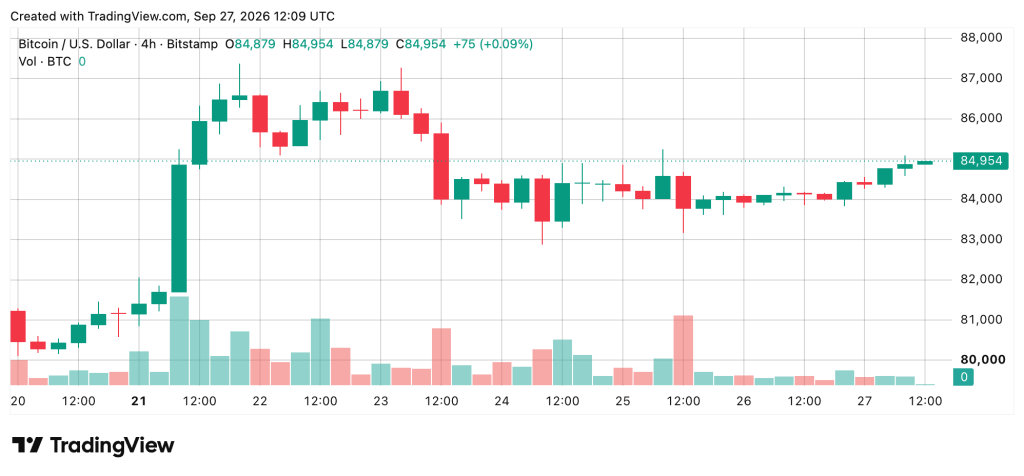
That puts the immediate resistance line within striking distance, with $86,500 and $87,374 representing subsequent upside reference points. On the flip side, the 83,000-84,000 shelf remains an important defensive position. Should that support give way, $80,106 and eventually $74,913 return to the technical conversation.
Daily Chart: Bulls Hold Their Ground After September’s Rally
Bitcoin’s price on the daily chart continues to reflect a substantial recovery from its June low of $57,735, with July and August establishing a base before September’s advance carried prices to $87,374. The latest candles show $BTC holding in the mid-$84,000s, comfortably above its summer trading range, although daily volume has cooled following the initial rally.
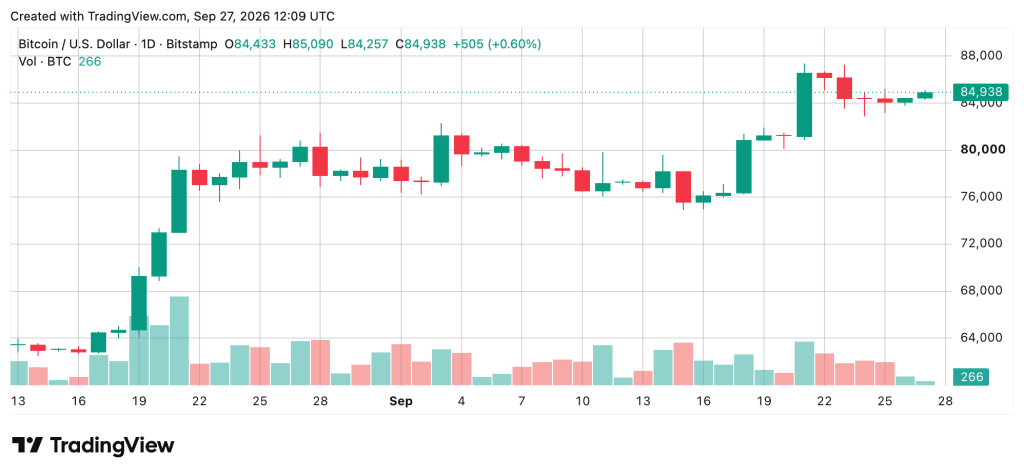
The $87,374 swing high remains the big hurdle, and a daily close above that figure would establish a fresh high relative to the visible September structure. Meanwhile, losing the mid-$84,000s could expose the previous launch area, with the $74,900-$80,000 range providing a deeper reference zone. For the time being, buyers remain above the principal daily moving averages.
Oscillators: Momentum and MACD Carry the Bullish Argument
The daily chart’s oscillator readings show nine neutral signals, two positive signals and zero negative signals. The relative strength index (RSI) registers 66, Stochastic stands at 77, the commodity channel index (CCI) reads 91, and the average directional index (ADX) sits at 44, all neutral.
The Awesome oscillator (AO) prints 4,693 today, while Stochastic RSI fast registers 66, Williams percent range stands at minus 20, bull bear power measures 3,937, and the Ultimate oscillator (UO) reads 63, also indifferent. Momentum, however, is cooking with gas at 8,491, accompanied by the moving average convergence divergence (MACD) level at 2,473, with both indicators delivering bullish readings.
Moving Averages: Fourteen Positive Signals Keep Bulls Sitting Pretty
The 24-hour timeframe’s moving averages (MAs) present a considerably stronger technical picture, registering 14 positive readings, one neutral, and zero bearish. Bitcoin’s price trades above every listed exponential moving average (EMA) and simple moving average (SMA), including the 10-period EMA at $83,328, 10-period SMA at $83,818, 20-period EMA at $81,433, and 20-period SMA at $80,449.
Further down the line, the 50-period EMA stands at $77,058, while the 200-period EMA and SMA register $74,142 and $71,076, respectively. The volume-weighted moving average (VWMA) at $80,290 and Hull moving average (HMA) at $84,516 also remain positive this weekend. Only the Ichimoku baseline at $81,144 is neutral, leaving the daily MA configuration firmly in positive territory.
Bull Verdict
Bitcoin’s price position above its major daily moving averages, coupled with positive momentum and MACD readings, supports the prevailing bullish technical structure. A convincing break above $85,000, followed by $85,945, would put the Sept. 22 high of $87,374 back on the radar.
Bear Verdict
The latest recovery has arrived on lighter volume, leaving buyers with unfinished business around $85,000. A rejection followed by a loss of $84,000 and $83,300 would weaken the short-term structure, potentially reopening the door to $80,106.