
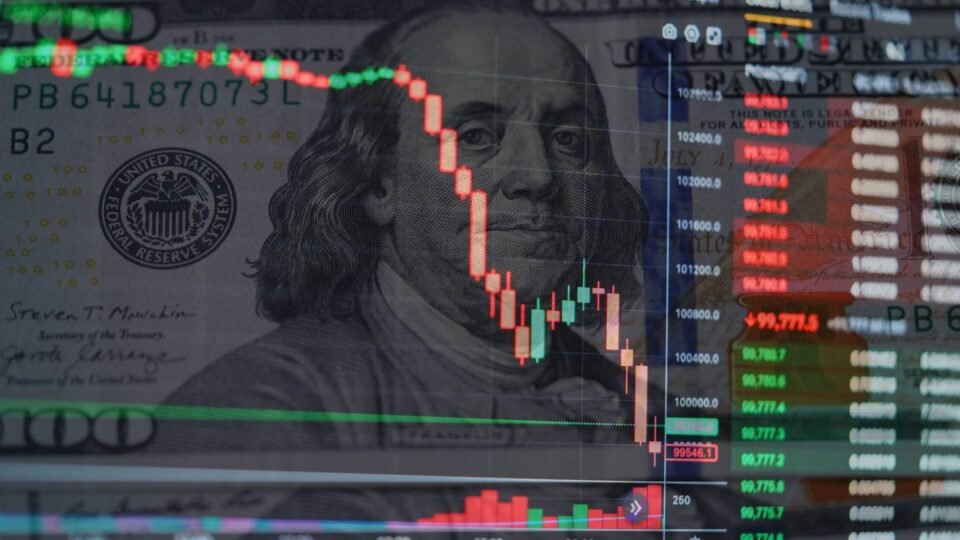
Bitcoin (CRYPTO: BTC) has once again fallen below $80,000, briefly hitting $79,973 before buyers stepped in and pushed it back up to $80,287. This decline followed a sharper drop the day before, when Bitcoin sank to $79,220 on Binance, marking…
This post may contain links from our sponsors and affiliates, and Flywheel Publishing may receive compensation for actions taken through them.
Bitcoin (CRYPTO: BTC) has once again fallen below $80,000, briefly hitting $79,973 before buyers stepped in and pushed it back up to $80,287. This decline followed a sharper drop the day before, when Bitcoin sank to $79,220 on Binance, marking weekly lows at $79,107, its weakest point in over a month.
While this drop may seem limited, Bitcoin is down 3.3% for October but still up 26.8% over the last 90 days; the $80,000 threshold matters to its largest holders. Bitcoin last traded at or below $77,600 on September 18, so what caused this dip, and how much further could it fall?
Iran Concerns and ETF Outflows Drive Bitcoin Lower
External factors largely drove the downturn. Reports on October 24 indicated that the U.S. was rapidly evacuating personnel from embassies and military bases across the Middle East, citing intelligence about potential attacks by Iran on Americans. Additionally, comments from the President at a Florida rally on October 23 hinted that tensions with Iran might escalate again after the midterms.
As stock and bond markets close on weekends, investors often sell cryptocurrency to reduce risk, and Bitcoin is typically the most liquid option. Concerns about rising oil prices—West Texas Intermediate crude reached $107.89 a barrel on October 20, a spike of 13.1% in just a week—fueled inflation worries.
Further compounding the situation, U.S. spot Bitcoin ETFs saw a staggering net outflow of $635.5 million on October 22, the largest daily outflow since June, erasing the $528.4 million influx from the day before.
Interest rates don’t seem to be the primary driver of this drop. On October 22, the 10-year Treasury yield fell to 4.96% from 5.31% earlier in the month, and lower yields usually support Bitcoin. Meanwhile, the VIX, a measure of expected stock market volatility, rose from 14.84 to 19.03, indicating growing apprehension among stock investors.
Leveraged Longs Near $81,993 Could Deepen the Drop
Leveraged traders could deepen the current downturn. Coinbase (NASDAQ: COIN | COIN Price Prediction) noted that the largest cluster of net long Bitcoin positions—trades made with borrowed money that profit from rising prices—averaged at $81,993, with 64% of their dollar value entered at prices above where Bitcoin currently trades.
Liquidation occurs when an exchange must forcibly close a borrowed position because significant losses consume the trader’s collateral. Each liquidation triggers a market sale that can drive further price drops, creating a chain reaction that continues until all over-leveraged positions are cleared. This type of selling often happens quickly and doesn’t necessarily reflect real demand.
Bitcoin Trades Inside Its $80,000 to $81,500 Cost-Basis Band
Currently, Bitcoin is trading below both its 50-day average of $81,798 and its 20-day average of $82,539, suggesting that many recent buyers are now at a loss, giving short-term sellers an advantage.
Cost basis, or the average price paid by a group of investors, is crucial here. According to Glassnode data, the cost basis for spot ETF holders and treasury companies—public firms holding Bitcoin on their balance sheets—falls between $80,000 and $81,500. A decline below $80,000 could push this group, including ETF buyers who put $6.3 billion into ETFs in Q3 alone, into paper losses.
Glassnode warned in its October 14 report that the largest buy orders on Binance were clustered around $80,000. A close below this ETF cost basis could eliminate the nearest support identified in Bitcoin’s on-chain data. However, the dip occurred on relatively low trading volume compared to the October 24 selloff and quickly reversed, indicating a lack of strong conviction.
Bitcoin Outperforms Ethereum and Solana
Bitcoin has dropped just 3.9%, while Ethereum (CRYPTO: ETH) has fallen 12.5% and Solana (CRYPTO: SOL) has lost 16.1%.
This resilience may stem from Bitcoin’s broader base of long-term buyers, as ETFs and treasury companies hold significant amounts near their cost basis and have an incentive to defend it. In contrast, Ethereum and Solana operate in smaller markets where leveraged trading plays a larger role, and investors tend to sell riskier assets first during periods of uncertainty.
Is $77,600 Next After Bitcoin Fell Below $80,000?
If Bitcoin cannot reclaim $81,500, $77,600 appears to be the next significant level to watch. This target aligns with Glassnode’s True Market Mean—the average price paid by active investors, excluding coins that have remained inactive for years—and sits about 3.3% below the current price. ETF buyers previously positioned to defend the $80,000 floor turned sellers on October 22, while long positions near $81,993 add to the strain.
The outcome hinges on investor sentiment and external factors affecting the market.
Contact [email protected] for any questions or corrections.