
Private residential price growth picked up in 3Q 2026
Private residential prices rose 1.4% quarter-on-quarter in 3Q2026, accelerating from the 0.5% increase in 2Q2026.
This was the fastest pace of growth this year.
On a year-on-year basis, private residential prices rose 3.4% in 3Q2026.
| Price index of residential market in 3Q26 | |||||
| 3Q25 | 2Q26 | 3Q26 | QoQ | YoY | |
| Private residential price index | 215.1 | 219.4 | 222.5 | 1.40% | 3.40% |
| Landed | 244.8 | 258.4 | 265.9 | 2.90% | 8.60% |
| Non-Landed | 208.5 | 210.6 | 212.7 | 1.00% | 2.00% |
| – Core Central Region | 163.4 | 161.5 | 162 | 0.30% | -0.90% |
| – Rest of Central Region | 225.5 | 226.2 | 226.2 | 0.30% | |
| – Outside Central Region | 263 | 271.1 | 277.3 | 2.30% | 5.40% |
| HDB Resale Price Index | 203.7 | 202.8 | 202.5 | -0.10% | -0.60% |
| Source: URA | |||||
This brought cumulative price growth for the first nine months of 2026 to 2.8%. Prices rose by an average of 0.9% per quarter, unchanged from the same period in 2025.
The increase was led by landed homes.
Landed property prices rose 2.9% quarter-on-quarter in 3Q2026, extending the 2.5% gain in 2Q2026. Compared with a year ago, landed prices were 8.6% higher.
Landed home sales reached 588 units in 3Q2026, the highest quarterly volume this year.
Non-landed property prices rose 1.0% quarter-on-quarter, reversing the 0.1% decline in the previous quarter.
However, the faster price growth may partly reflect the mix of homes sold rather than a broad-based acceleration.
With fewer launches in the quarter, a larger share of new sales came from higher-priced homes.
Homes priced between S$2 million and S$5 million made up 68.2% of new home sales in 3Q2026, up from 49.2% in 2Q2026.
HDB resale prices fall for a third consecutive quarter
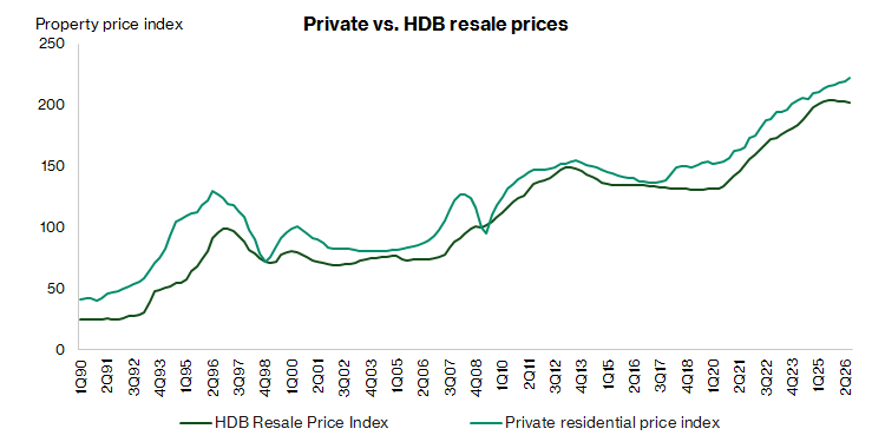
The HDB Resale Price Index fell 0.1% quarter-on-quarter to 202.5 in 3Q2026, following a 0.3% decline in 2Q2026.
This marks the third consecutive quarterly decline. The decline was slightly smaller than the 0.2% fall indicated by the flash estimate.
On a year-on-year basis, HDB resale prices fell 0.6%.
For the first nine months of 2026, HDB resale prices declined about 0.5%.
Transaction volumes rose sharply despite the softer prices. This reflects the ample supply of new flats in attractive locations, alongside price resistance among buyers, which weighed on overall HDB resale prices.
About 7,645 resale flats changed hands in 3Q2026, up 19.5% from 6,396 in 2Q2026.
Larger flats recorded the strongest increases. Five-room flat transactions rose 26.7% to 1,867, while executive and multi-generation flat transactions rose 41.6% to 545.
This was likely supported by the removal of the 15-month wait-out period for private property downgraders on 28 July 2026, which allowed them to buy non-subsidised resale flats immediately after selling their private homes.
At the same time, million-dollar flat transactions reached a fresh quarterly record of 596 deals, up 21.6% from 490 in 2Q2026. About half of these deals involved flats aged 15 years or less.
Looking ahead, the November 2026 BTO sales exercise, which offers 7,690 new flats, could temper demand for resale flats.
Outside Central Region led non-landed price growth
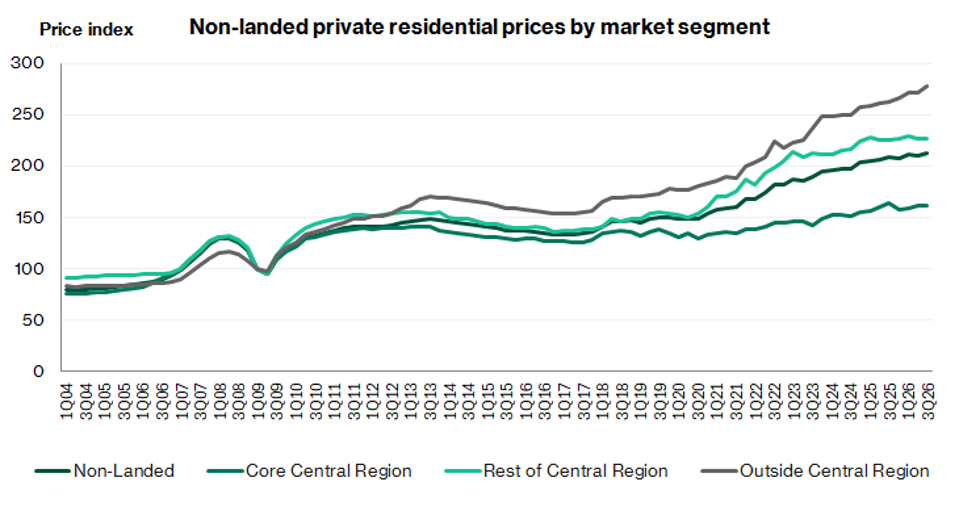
Price performance was uneven across the non-landed private residential market in 3Q2026.
In the Outside Central Region, non-landed prices rose 2.3% quarter-on-quarter, reversing the 0.1% decline in 2Q2026.
This was the strongest performance among the three market segments. On a year-on-year basis, prices in the Outside Central Region were up 5.4%.
In the Core Central Region, non-landed prices rose 0.3% quarter-on-quarter, slowing from the 1.8% increase in 2Q2026. Prices in the segment were 0.9% lower than a year ago.
Prices in the Rest of Central Region were unchanged, after falling 1.2% in the previous quarter.
New launches were limited in the quarter. Projects launched in 3Q2026 included Lentor Gardens Residences in the Outside Central Region, as well as Dunearn House and Amberwood At Holland in the Core Central Region.
Dunearn House sold about 56% of its units at launch, while take-up at Amberwood At Holland was about 11%, according to ERA.
Meanwhile, the median resale price of non-landed homes eased 1.1% to S$1,771 per square foot, suggesting that buyers in the secondary market remained price-sensitive.
New home sales fell as launches slowed
|
|
3Q25 |
2Q26 |
3Q26 |
QoQ |
YoY |
|
Private residential volumes |
7,404 |
6,148 |
5,146 |
-16.3% |
-30.5% |
|
Primary sales |
3,288 |
2,141 |
1,183 |
-44.7% |
-64.0% |
|
Secondary sales |
4,116 |
4,007 |
3,963 |
-1.1% |
-3.7% |
|
– Resales |
3,881 |
3,813 |
3,801 |
-0.3% |
-2.1% |
|
– Subsales |
235 |
194 |
162 |
-16.5% |
-31.1% |
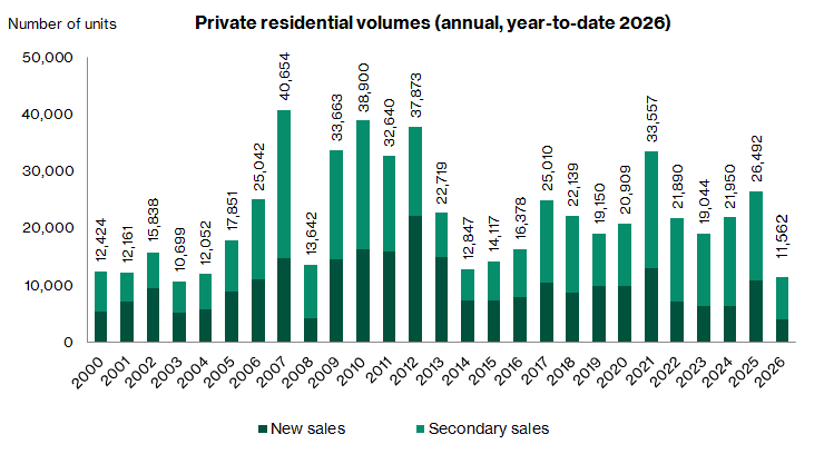
Market activity softened during the quarter, reflecting the seasonal slowdown typically associated with the Lunar Seventh Month.
Developers launched 1,140 uncompleted private residential units, excluding executive condominiums, in 3Q2026.
This was below the 1,783 units launched in 2Q2026.
With fewer launches, developers sold 1,183 units in 3Q2026.
This was down 44.7% quarter-on-quarter and 64.0% year-on-year. The year-on-year decline came off a high base of 3,288 units sold in 3Q2025.
For the first nine months of 2026, developers sold 5,337 new homes, 32.2% fewer than the 7,875 units sold over the same period in 2025.
Resale activity moderated.
There were 3,801 resale transactions in 3Q2026, broadly similar to the 3,813 in 2Q2026.
Resale homes accounted for 73.9% of all sale transactions, compared with 62.0% in the previous quarter.
Sub-sales fell to 162 units, making up about 3.1% of total transactions.
Overall, total private residential transactions fell 16.3% quarter-on-quarter to 5,146 units, the lowest since 2Q2025.
Among the new launches in 3Q26, Lentor Gardens Residences and Dunearn House are two top selling projects in 3Q26.
New home sales could pick up in the fourth quarter as more projects are launched. Realion noted that Thomson Reserve, a 1,268-unit project, could also lift the price index in 4Q2026.
BTO and EC income ceilings raised
At the National Day Rally on 23 August 2026, the Government announced higher income ceilings for new public housing.
The income ceiling for families buying BTO flats was raised to S$16,000 a month, from S$14,000. For singles, the ceiling was raised to S$8,000, from S$7,000.
The BTO changes apply to households applying for an HDB Flat Eligibility letter from 24 August 2026.
The income ceiling for executive condominiums was raised to S$18,000 a month, from S$16,000.
This applies to EC projects on land sites with tenders closing on or after 24 August 2026. Existing EC projects remain under the S$16,000 ceiling.
Families applying for new flats will also get an extra ballot chance for each child they have or are expecting.
The changes widen the pool of eligible buyers for BTO flats and ECs.
Some higher-income households that would previously have bought larger HDB resale flats may now opt for BTO flats or ECs instead. This could weigh on demand for larger resale flats.
For ECs, the impact is likely to be gradual. The higher ceiling will only apply to future launches from sites tendered under the revised framework.
For the broader private property market, the impact is likely to be limited in the near term.
Mortgage rates edged higher but remained low
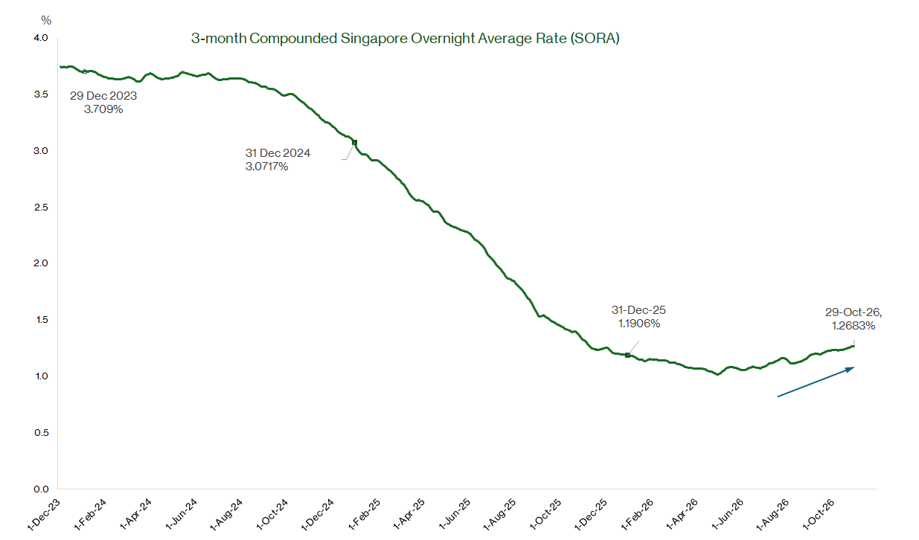
Singapore dollar interest rates have remained low, in line with the broader easing cycle since 2025.
The 3-month compounded Singapore Overnight Rate Average, or SORA, has edged up to about 1.27% as of 29 October 2026, from around 1.16% as of 28 July 2026.
Despite the increase, it remains well below the peak levels seen in 2023 and is still low by historical standards.
The lowest floating-rate mortgage packages were priced at about 1.52%, while the lowest fixed-rate packages started at about 1.80%, according to MortgageWise.
Low borrowing costs continue to support housing affordability. However, Realion noted that some buyers may exercise caution, as interest rates could continue to rise in the months ahead.
Rental growth accelerated, led by the Outside Central Region
|
|
3Q25 |
2Q26 |
3Q26 |
QoQ |
YoY |
|
Private residential rent index |
161.7 |
162.5 |
164.6 |
1.3% |
1.8% |
|
Landed |
156.8 |
156.4 |
159.7 |
2.1% |
1.8% |
|
Non-Landed |
161.5 |
162.5 |
164.5 |
1.2% |
1.9% |
|
– Core Central Region |
149.3 |
152.9 |
152.4 |
-0.3% |
2.1% |
|
– Rest of Central Region |
171.6 |
172.3 |
174.9 |
1.5% |
1.9% |
|
– Outside Central Region |
171.2 |
169.0 |
174.2 |
3.1% |
1.8% |
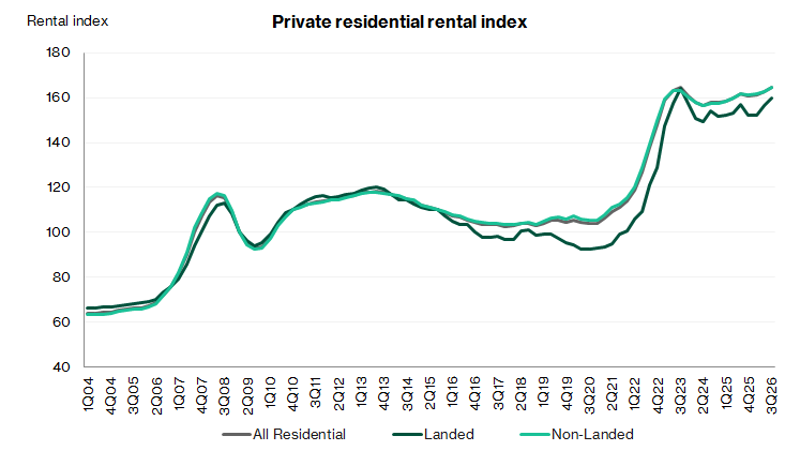
Rental demand remains robust. Private residential rents rose 1.3% quarter-on-quarter in 3Q2026, picking up from the 0.7% increase in 2Q2026.
On a year-on-year basis, the overall rental index rose 1.8% to 164.6.
Landed rents rose 2.1% quarter-on-quarter in 3Q2026, slowing from the 2.7% increase in 2Q2026.
Non-landed rents rose 1.2% quarter-on-quarter, up from 0.4% in the previous quarter.
Within the non-landed segment, the Outside Central Region was the strongest performer.
Rents in the Outside Central Region rose 3.1% quarter-on-quarter, reversing the 0.3% decline in 2Q2026.
Rents in the Rest of Central Region rose 1.5%, after staying flat in the previous quarter.
The Core Central Region underperformed, with rents falling 0.3% quarter-on-quarter after rising 1.2% in 2Q2026.
The rental increase came even as more newly completed homes entered the market, suggesting that tenant demand remained firm.
Vacancy rate rose as completions picked up
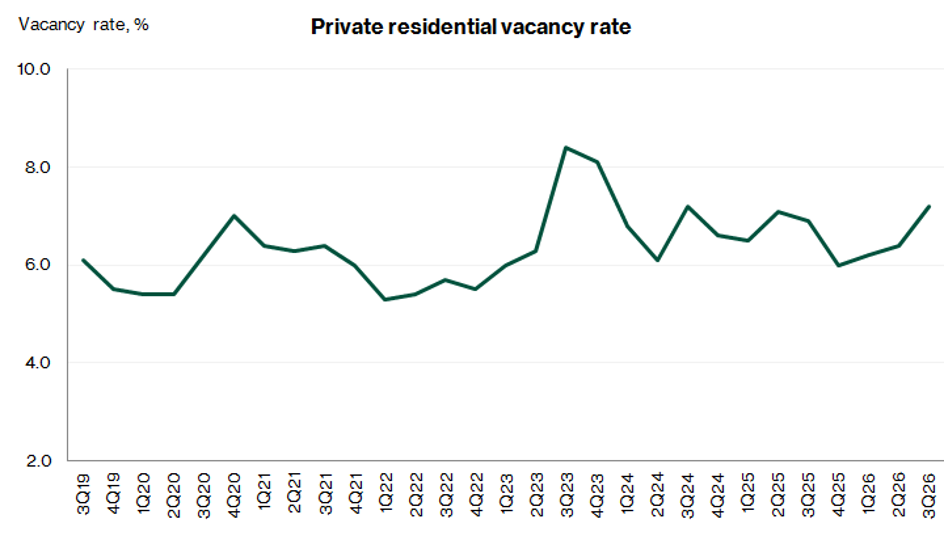
The vacancy rate for completed private residential units, excluding executive condominiums, rose to 7.2% as at end-3Q2026, from 6.4% in 2Q2026.
This was the highest level since 2Q2025.
The increase was driven by a pickup in completions.
The stock of completed private homes, excluding executive condominiums, increased by 3,491 units in 3Q2026, up from 416 units in the previous quarter.
At the same time, the stock of occupied units fell by 305 units, which pushed the vacancy rate higher.
By segment, vacancy was highest in the Core Central Region at 8.4%, up slightly from 8.3% in the previous quarter.
The Rest of Central Region rose to 7.4%, from 6.1%.
The Outside Central Region rose to 6.5%, from 5.6%.
Unsold inventory rose as more projects entered the pipeline
Unsold inventory rose in 3Q2026, even though new home sales slightly exceeded new launches.
Unsold uncompleted private residential units, excluding executive condominiums, rose 26.3% quarter-on-quarter to 18,853 units, from 14,929 units in 2Q2026.
This likely reflected new projects that obtained planning approval during the quarter.
Including completed but unsold units, total unsold inventory rose 26.7% to 19,076 units.
The increase was concentrated in the Rest of Central Region, where unsold units rose 56.9% to 6,899, and the Outside Central Region, where they rose 33.7% to 6,893. Unsold units in the Core Central Region fell 4.0% to 5,284.
Total unsold inventory remains well below the last peak of 37,799 units in 1Q2019.
Based on the five-year average annual new home sales of 8,766 units from 2021 to 2025, current unsold inventory represents a little over two years of supply.
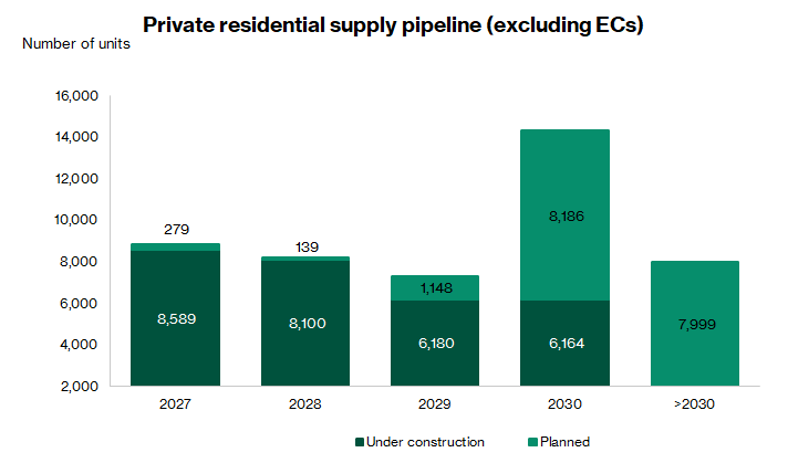
Completions are expected to remain elevated. About 2,613 private residential units are expected to be completed in the rest of 2026, followed by 8,868 units in 2027 and 8,239 units in 2028.
Government sustaining elevated private housing supply
The Government continues to keep private housing supply elevated through the Government Land Sales programme.
For 2H2026, 4,745 private residential units, including 735 executive condominium units, will be launched under the Confirmed List.
This brings the full-year Confirmed List supply to 9,320 units, more than 50% above the 10-year annual average.
Developer interest in land tenders remained healthy. Four residential Government Land Sales sites closed in 3Q2026, attracting an average of 3.8 bidders each.
As at end-3Q2026, there were 44,738 uncompleted private residential units, including executive condominiums, in the pipeline with planning approval.
Of these, about 20,300 units remained unsold.
Looking further ahead, about 57,200 private residential units, including executive condominiums, are expected to be completed over the coming years.
This includes about 22,300 units by 2028, and another 34,900 units from 2029 onwards.
Office rents rose as vacancy fell
Office rents in the Central Region rose 0.8% quarter-on-quarter in 3Q2026, the same pace as in 2Q2026.
Office prices rose 0.8% quarter-on-quarter, faster than the 0.4% increase in 2Q2026.
Island-wide office vacancy fell to 10.0%, from 11.0% in the previous quarter.
This came as occupied office space rose by 17,000 square metres, while total office stock shrank by 72,000 square metres.
Demand for prime office space remained firm. According to JLL, Grade A office rents in the CBD rose 1.0% to S$12.32 per square foot per month, while CBD vacancy fell to 5.9%, the lowest in 10 quarters.
AI and technology firms were a key source of demand. With very limited new office supply expected before 2028, CBRE expects Grade A rents in the core CBD to grow by more than 5% in 2026.
In the retail segment, rents improved modestly, rising 0.7% quarter-on-quarter. Prices of retail space rose 1.1%. Retail vacancy was unchanged at 6.5%.
Valuation of Singapore listed developers
Singapore-listed property companies have delivered mixed operating performances, reflecting differences in their business models, geographic exposure and development pipelines.
The sector trades at an average 2026 price-to-book ratio of 1.2 times.
Most property developers continue to trade below book value, reflecting their relatively modest returns on equity, cyclical earnings and exposure to financing costs.
City Developments, Bukit Sembawang Estates and Far East Orchard trade at relatively low P/B multiples of 0.3–0.7x,
The segment offers average dividend yield of 3.6%, with APAC Realty (8.1%), PropNex (5.7%) and Bukit Sembawang Estates (5.0%) standing out for income potential.
However, sustained dividend growth will depend on earnings recovery, cash flow generation and capital management, with net cash positions providing greater financial flexibility.
Overall, the latest data suggests that the outlook for property developers remains balanced. While price growth picked up in 3Q2026, rising completions and elevated land supply could cap further gains.
Thus, we prefer the REITs over the developers as the REITs are trading at very attractive yields compared to their historical levels.
If you are interested in Singapore REITs, check out our analysis on whether Singapore REITs are more attractive with interest rates falling.
Download the full report here.
Check out Beansprout’s guide to the best stock trading platforms in Singapore with the latest promotions to invest in Singapore property stocks in Singapore.
Join the Beansprout Telegram group for the latest insights on Singapore stocks, REITs, bonds and ETFs.
Important Disclosures
Analyst Certification and Disclosures
The analyst(s) named in this report certifies that (i) all views expressed in this report accurately reflect the personal views of the analyst(s) with regard to any and all of the subject securities and companies mentioned in this report and (ii) no part of the compensation of the analyst(s) was, is, or will be, directly or indirectly, related to the specific views expressed by that analyst herein. The analyst(s) named in this report (or their associates) does not have a financial interest in the corporation(s) mentioned in this report.
An associate is defined as (i) the spouse, or any minor child (natural or adopted) or minor step-child, of the analyst; (ii) the trustee of a trust of which the analyst, his spouse, minor child (natural or adopted) or minor step-child, is a beneficiary or discretionary object; or (iii) another person accustomed or obliged to act in accordance with the directions or instructions of the analyst.
Company Disclosure
Global Wealth Technology Pte Ltd (“Beansprout”) does not have any financial interest in the corporation(s) mentioned in this report.
Disclaimer
This report is provided by Beansprout for the use of intended recipients only and may not be reproduced, in whole or in part, or delivered or transmitted to any other person without our prior written consent. By accepting this report, the recipient agrees to be bound by the terms and limitations set out herein.
You acknowledge that this document is provided for general information purposes only. Nothing in this document shall be construed as a recommendation to purchase, sell, or hold any security or other investment, or to pursue any investment style or strategy. Nothing in this document shall be construed as advice that purports to be tailored to your needs or the needs of any person or company receiving the advice. The information in this document is intended for general circulation only and does not constitute investment advice. Nothing in this document is published with regard to the specific investment objectives, financial situation and particular needs of any person who may receive the information.
Nothing in this document shall be construed as, or form part of, any offer for sale or subscription of or solicitation or invitation of any offer to buy or subscribe for any securities. The data and information made available in this document are of a general nature and do not purport, and shall not in any way be deemed, to constitute an offer or provision of any professional or expert advice, including without limitation any financial, investment, legal, accounting or tax advice, and shall not be relied upon by you in that regard. You should at all times consult a qualified expert or professional adviser to obtain advice and independent verification of the information and data contained herein before acting on it. Any financial or investment information in this document are intended to be for your general information only. You should not rely upon such information in making any particular investment or other decision which should only be made after consulting with a fully qualified financial adviser. Such information do not nor are they intended to constitute any form of financial or investment advice, opinion or recommendation about any investment product, or any inducement or invitation relating to any of the products listed or referred to. Any arrangement made between you and a third party named on or linked to from these pages is at your sole risk and responsibility.
You acknowledge that Beansprout is under no obligation to exercise editorial control over, and to review, edit or amend any data, information, materials or contents of any content in this document. You agree that all statements, offers, information, opinions, materials, content in this document should be used, accepted and relied upon only with care and discretion and at your own risk, and Beansprout shall not be responsible for any loss, damage or liability incurred by you arising from such use or reliance.
This document (including all information and materials contained in this document) is provided “as is”. Although the material in this document is based upon information that Beansprout considers reliable and endeavours to keep current, Beansprout does not assure that this material is accurate, current or complete and is not providing any warranties or representations regarding the material contained in this document. All opinions contained herein constitute the views of the analyst(s) named in this report, they are subject to change without notice and are not intended to provide the sole basis of any evaluation of the subject securities and companies mentioned in this report. Any reference to past performance should not be taken as an indication of future performance. To the fullest extent permissible pursuant to applicable law, Beansprout disclaims all warranties and/or representations of any kind with regard to this document, including but not limited to any implied warranties of merchantability, non-infringement of third-party rights, or fitness for a particular purpose.
Beansprout does not warrant, either expressly or impliedly, the accuracy or completeness of the information, text, graphics, links or other items contained in this document. Neither Beansprout nor any of its affiliates, directors, employees or other representatives will be liable for any damages, losses or liabilities of any kind arising out of or in connection with the use of this document. To the best of Beansprout’s knowledge, this document does not contain and is not based on any non-public, material information. The information in this document is not intended for distribution to, or use by, any person or entity in any jurisdiction where such distribution or use would be contrary to law or regulation, or which would subject Beansprout to any registration requirement within such jurisdiction or country. Beansprout is not licensed or regulated by any authority in any jurisdiction or country to provide the information in this document.
As a condition of your use of this document, you agree to indemnify, defend and hold harmless Beansprout and its affiliates, and their respective officers, directors, employees, members, managing members, managers, agents, representatives, successors and assigns from and against any and all actions, causes of action, claims, charges, cost, demands, expenses and damages (including attorneys’ fees and expenses), losses and liabilities or other expenses of any kind that arise directly or indirectly out of or from, arising out of or in connection with violation of these terms, use of this document, violation of the rights of any third party, acts, omissions or negligence of third parties, their directors, employees or agents. To the extent permitted by law, Beansprout shall not be liable to you, any other person, or organization, for any direct, indirect, special, punitive, exemplary, incidental or consequential damages, whether in contract, tort (including negligence), or otherwise, arising in any way from, or in connection with, the use of this document and/or its content. This includes, without limitation, liability for any act or omission in reliance on the information in this document. Beansprout expressly disclaims and excludes all warranties, conditions, representations and terms not expressly set out in this User Agreement, whether express, implied or statutory, with regard to this document and its content, including any implied warranties or representations about the accuracy or completeness of this document and the content, suitability and general availability, or whether it is free from error.
If these terms or any part of them is understood to be illegal, invalid or otherwise unenforceable under the laws of any state or country in which these terms are intended to be effective, then to the extent that they are illegal, invalid or unenforceable, they shall in that state or country be treated as severed and deleted from these terms and the remaining terms shall survive and remain fully intact and in effect and will continue to be binding and enforceable in that state or country.
These terms, as well as any claims arising from or related thereto, are governed by the laws of Singapore without reference to the principles of conflicts of laws thereof. You agree to submit to the personal and exclusive jurisdiction of the courts of Singapore with respect to all disputes arising out of or related to this Agreement. Beansprout and you each hereby irrevocably consent to the jurisdiction of such courts, and each Party hereby waives any claim or defence that such forum is not convenient or proper.