
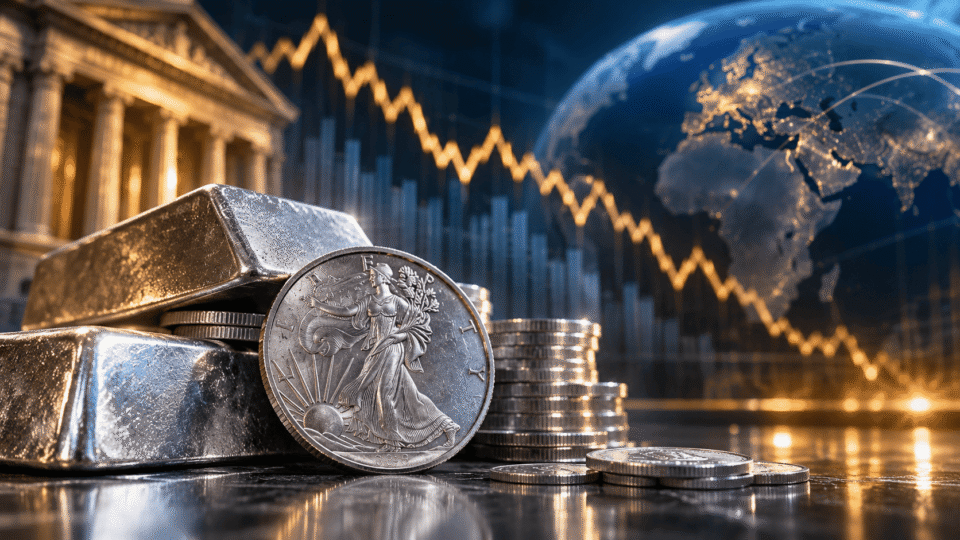
Silver prices fell in the local market and the global bourse during the first ten months of 2026: the 999-fine silver gram lost about EGP 31 in the Egyptian market, down 24.8% since the start of the year, while the ounce globally dropped from about $71.3 at the end of 2025 trading to $49 at the end of October, a decline of nearly 31% from its level at the start of the year and about 60% from its record peak of $121.64 on January 29, with silver’s losses exceeding gold’s by a wide margin over the same period.
The price of a 999-fine silver gram fell from EGP 125 at the start of January 2026 trading to close October at EGP 94, after recording its all-time peak at EGP 210 on January 29, meaning the gram has lost about EGP 116 of its value, or 55.2%, from its record level.
October’s outcome was negative both locally and globally: the gram lost about EGP 8, down 7.8%, after starting the month at EGP 102, while the ounce globally fell about $11.2, down 18.6%, from $60.18 at the end of September to $49 at the end of October, after three consecutive weekly losses of 6.1%, then 6.6%, then 5.4%, before the ounce broke below the $50 level in the month’s final week.
The sharp global decline was not mirrored at the same pace in local prices because of the dollar’s rise against the pound: according to the Central Bank of Egypt’s daily table, it rose from EGP 52.06 for sale on September 30 to EGP 56.12 for sale on October 29, an increase of nearly EGP 4, or about 7.8%, in the month alone.
Over the year’s first ten months, the dollar rose from EGP 47.74 for sale at the end of 2025 trading to EGP 56.12 for sale on October 29, an increase of about 17.6%, which softened the impact of the global ounce’s decline on silver prices in the Egyptian market.
The exchange-rate moves coincided with the Central Bank of Egypt’s Monetary Policy Committee decision on October 29 to raise key policy rates by 100 basis points, bringing the overnight deposit and lending rates and the main operation rate to 20%, 21% and 20.5% respectively, amid an unfavorable external environment and rising uncertainty, according to the central bank’s statement.
Among the year’s key milestones, an exceptional rally drove silver prices to their record peak of $121.64 an ounce on January 29, after rising about 71% during the month, a surge a Heraeus report described as the fiercest since 1980.
But those gains did not last long: the ounce lost more than a quarter of its value in the following session, its biggest daily drop according to LSEG data since 1982.
On September 16, the US Federal Reserve raised interest rates by 25 basis points to a range between 3.75% and 4%, the first increase since 2023, amid persistent inflation concerns. That coincided with silver prices declining during September, before selling pressure resumed more sharply in October.
During October, US economic data reinforced fears of persistent inflationary pressures, after the consumer price index rose 0.6% monthly and 3.7% annually, driven by a 9.1% increase in gasoline prices, while the producer price index rose 1.3% monthly, its biggest increase since March 2022.
On October 28, the Federal Reserve decided to hold interest rates unchanged at the 3.75%-4% range, by a majority of 10 votes against two who favored a 25-basis-point increase, while signaling that inflation remains elevated. Personal consumption expenditures index data also showed a 0.5% monthly and 3.6% annual rise, strengthening expectations that the Fed could return to raising rates in December, which increased pressure on precious metals.
On market fundamentals, silver is influenced by its dual nature as both a precious metal and an industrial input used in electronics, solar energy and the automotive industries, which makes its moves more tied to economic changes and industrial-demand expectations compared with gold.
According to the Silver Institute’s annual survey issued in April, the global market is heading to record a supply deficit for the sixth consecutive year in 2026, of about 46.3 million ounces, despite expectations that industrial demand will fall 3% to about 639.6 million ounces, for the second straight year, under pressure from slowing consumption in some industrial sectors, led by solar cells, whose silver consumption is expected to fall about 19% as manufacturers move to reduce the amount of metal used or seek cheaper alternatives.
Despite the expected continuation of the global supply deficit for a sixth consecutive year, that did not prevent prices from falling sharply: the January rally of about 71% in a single month was driven by speculation rather than supply-and-demand fundamentals, so the correction came larger than actual market conditions justified.
The gap between the two metals’ performance widened in October: silver fell about 18.6% against gold’s decline of about 6.7%, raising the gold-to-silver ratio to about 79 ounces of silver to buy one ounce of gold, compared with about 69 ounces at the end of September, reflecting selling pressure’s outperformance on silver during the month, given its lack of some of the support factors gold enjoys, chief among them central-bank demand.
Locally, the gap between the two metals’ performance widened during the year: the 999-fine gram lost about 24.8% since the start of January, while the 21-karat gold gram gained about 5.7%.
Silver is going through a sharp correction phase after the exceptional rally it saw in January: the ounce globally has fallen about 60% from its record peak, while the gram locally has lost about 55% from its highest levels, reflecting the scale of the decline prices suffered after the large speculative gains that pushed the metal to unprecedented levels.
The dollar’s rise against the pound limited the pass-through of global losses to the Egyptian market, whether during October or since the start of the year, making the exchange rate one of the main factors influencing the direction of silver prices locally, alongside the global ounce’s movement and industrial and investment demand developments.