
Gold, Silver Technical Analysis
- Gold attempts to reach a new high but faces an immediate test
- Silver finds temporary support at key Fibonacci level as bulls attempt to drag prices higher
Recommended by Richard Snow
Get Your Free Gold Forecast
Gold Attempts to Reach New High but Faces an Immediate Test
Gold prices have recovered from last week’s significant volatility spike as the gold volatility index (GVZ) has come down to levels seen before the panicked move. It must also be said that continued geopolitical uncertainty pertaining to a wider conflict in the Middle East remains a concern, helping to keep gold supported, especially ahead of the weekend.
Additionally, the Fed is said to be gearing up for the rate cutting cycle which is expected to get underway next month after a string of softer US data points suggesting the economy may be more vulnerable than initially thought.
Gold continues to trade above the 1.618 Fibonacci extension of the 2020-2022 major decline, headed towards the next key level of resistance of $2,500. The precious metal has received a bullish boost on Friday, after bouncing off the prior high of $2,450 – testing the more recent level of resistance at 2,484 where prior advances have failed.
Gold Weekly Chart

Source: TradingView, prepared by Richard Snow
The daily gold chart helps provide a more granular view of gold’s ascent which has oscillated broadly since the middle of July, using the blue 50-day simple moving average as dynamic support.
The RSI has lifted slightly, appearing set for overbought territory, however, the precious metal has managed to avoid overheating in 2024 apart from a brief moment in July. Resistance lies at the psychological level of $2,500 and very near-term support emerges at $2,450, followed by the 50 SMA at $2,382.
Gold Daily Chart
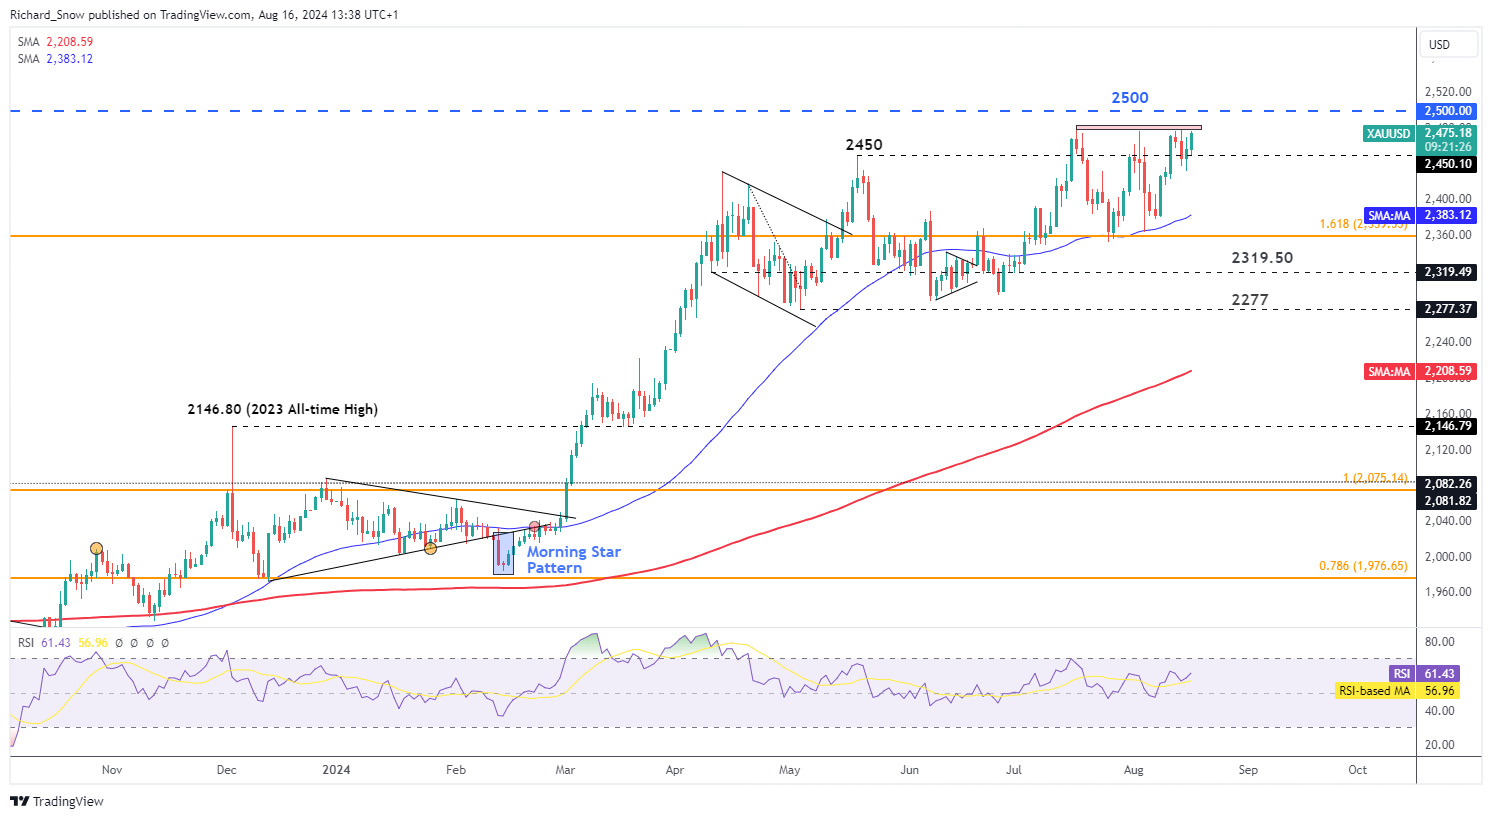
Source: TradingView, prepared by Richard Snow
Silver Finds Temporary Support at Key Fibonacci Level as Bulls Attempt to Drag Prices Higher
Silver has traded conversely to gold, managing to selloff since the latter days in May. XAG/USD topped out above $32, attempting another advance which ultimately fell short near $31.75 and has come off a sizeable amount since then. The metal now attempts to find support at the prior Fibonacci level of $27,40. The Fibonacci retracement relates to the 2021-2022 decline.
Silver Weekly Chart
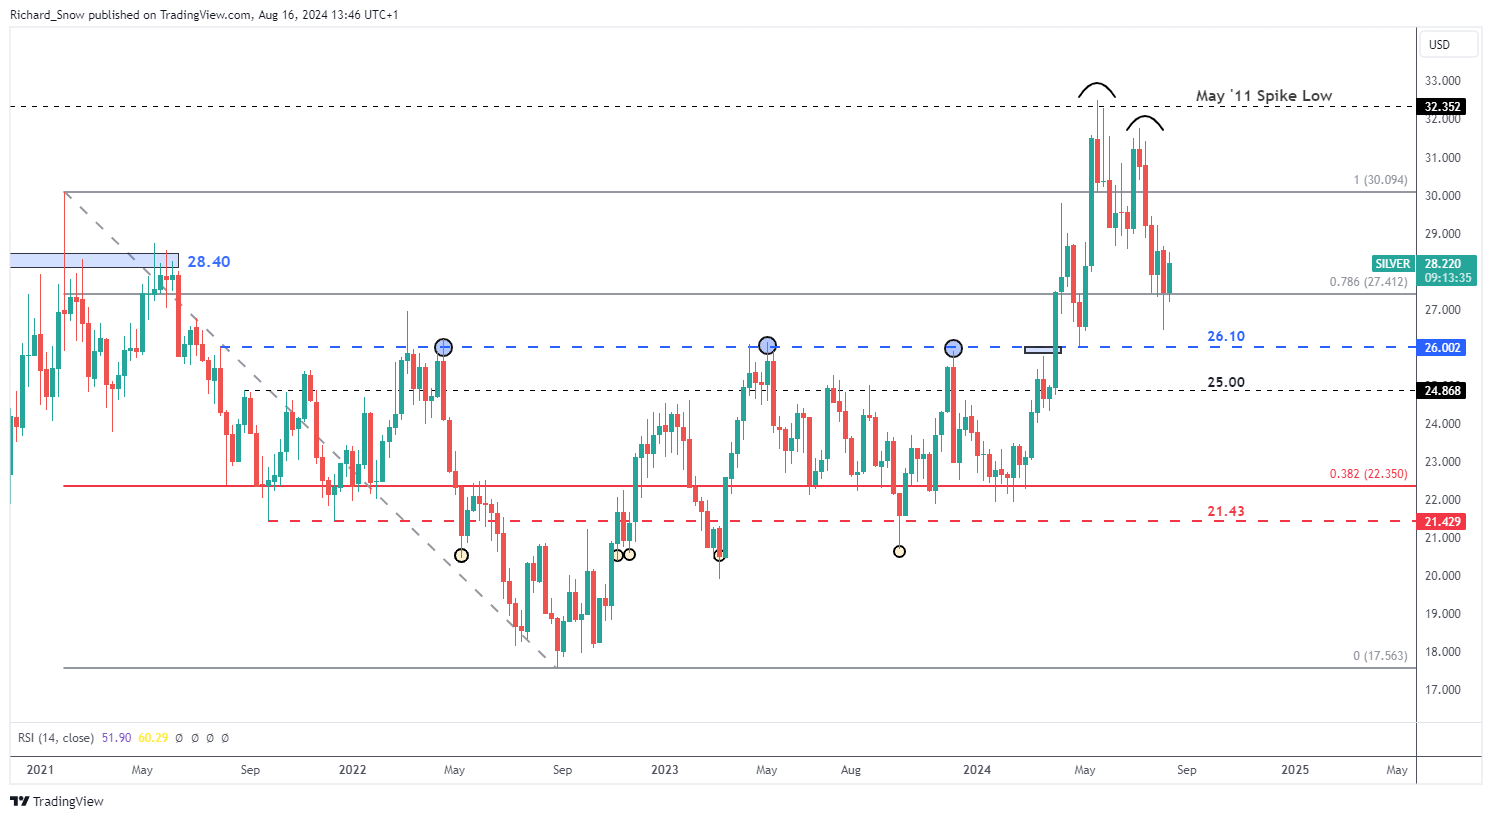
Source: TradingView, prepared by Richard Snow
The daily silver chart reveals a shorter-term test of trendline resistance. Silver’s recent upward lift was inspired by a bounce off the 200-day SMA and subsequent momentum which has lifted the commodity above the 78.6% Fib level.
A condition for a reassessment of the broader bearish move would require a break above the trendline followed by an immediate test (as support) and subsequent bullish follow through. Until then, the bearish trend move appears constructive and the RSI continues along the midline – revealing neither overbought nor oversold signals.
Silver Daily Chart
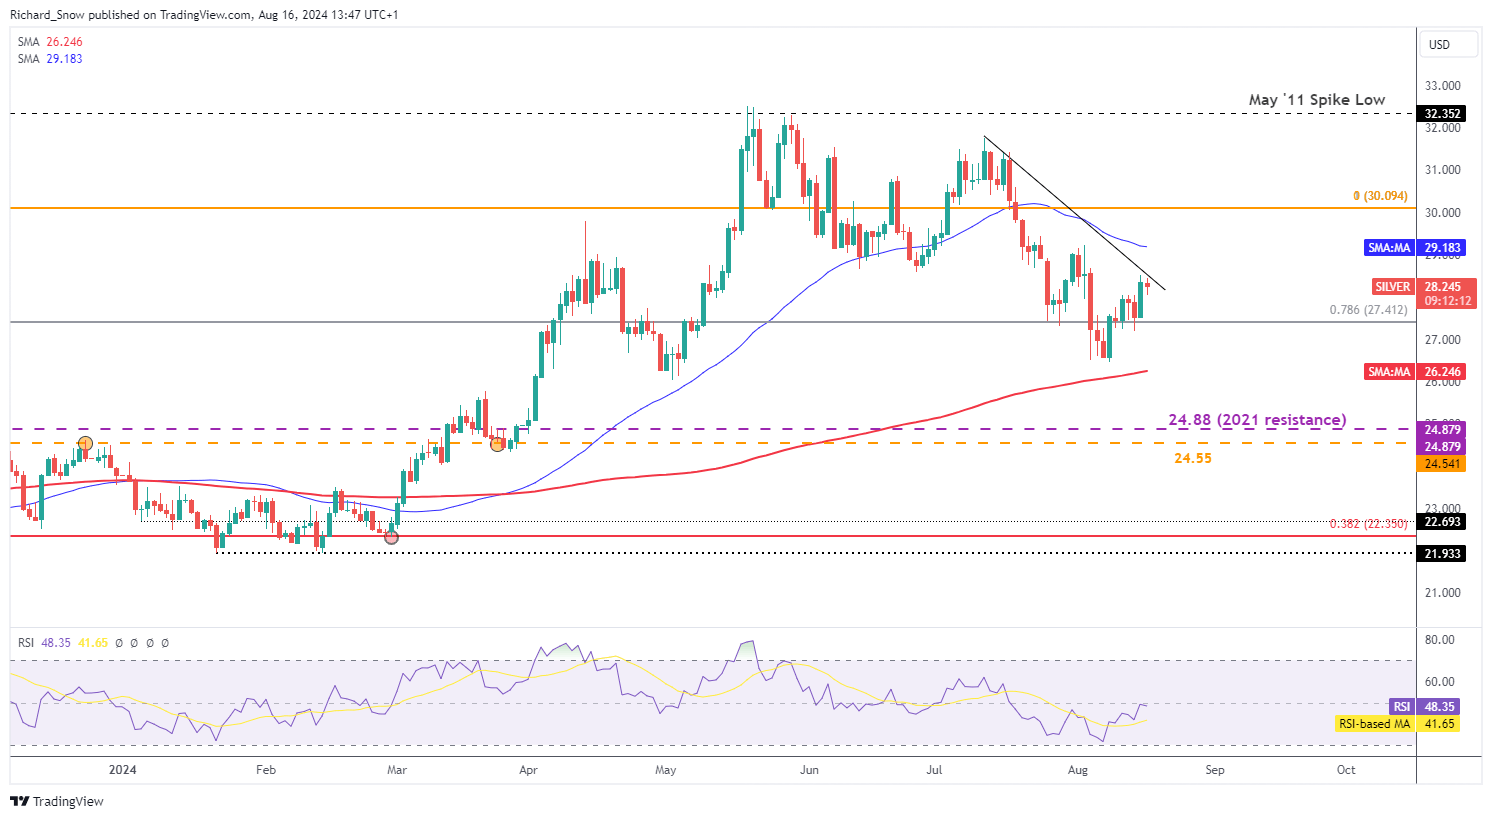
Source: TradingView, prepared by Richard Snow
— Written by Richard Snow for DailyFX.com
Contact and follow Richard on Twitter: @RichardSnowFX