Materials
The ruthenium chloride hydrate (RuCl3•xH2O) and o-phenylenediamine (OPD) were obtained from Energy Chemical (Shanghai, China). Manganese (II) nitrate tetrahydrate (Mn(NO3)2•4H2O), 1,3,5-benzenetricarboxylic acid (BTC), sodium borohydride (NaBH4), hydroethidine (HE), and 9,10-diphenanthraquinone (DPA) were obtained from Aladdin reagents (Shanghai, China). All other chemicals were obtained from Aladdin reagents and used as received without further purification.
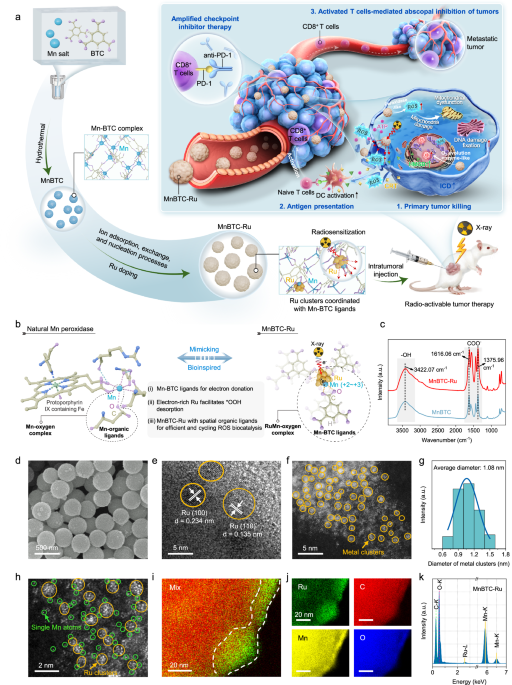
Synthesis of MnBTC-Ru
To obtain MnBTC, Mn(NO3)2•6H2O (192 mg) and BTC (87.5 mg) were individually added to 25 mL of ethanol, followed by 30 min of stirring. The combined solution was then transferred to a 100 mL Teflon-lined autoclave. After stirring for 0.5 h, the mixture was sealed and heated at 160 °C for 12 h. The resulting precipitates were centrifuged, washed thrice with ethanol, and dried at 60 °C under vacuum for 12 h. To obtain MnBTC-Ru, 50 mg of MnBTC was re-dispersed in 25 mL of ethanol using ultrasonic treatment for 20 min. Subsequently, 0.5 mL of a RuCl3•3H2O aqueous solution (10 mg mL−1) was added dropwise to the homogeneous precursor solution and stirred at 30 °C for 12 h. The mixture was washed with ethanol, dried overnight in a vacuum oven at 60 °C, and labeled as MnBTC-Ru.
Synthesis of C-Ru
Mn(NO3)2·6H2O (2.4 mg), RuCl3•3H2O (20 mg), carbon black (200 mg), and NaBH4 (36.5 mg) were individually added to 25 mL of deionized pure water, followed by 30 min of stirring. The mixture was washed with ethanol, dried overnight in a vacuum oven at 60 °C, and labeled as C-Ru.
Dynamic light scattering test
10 μg of biocatalysts were dissolved in 1 mL of either PBS or mouse serum, and dynamic light scattering analysis was conducted utilizing the Malvern Nano-ZS instrument.
Peroxidase-mimicking activity measured by TMB
The biocatalysts solution (10 mg·mL−1, 10 μL) was added into NaOAc−HOAc buffer (100 mM, pH 4.5) containing H2O2 (0.1 M, 25 μL) and TMB (10 mg·mL−1, 24 μL). The final volume of the mixture was adjusted to 2 mL with NaOAc−HOAc buffer; the final sample concentration was 50 μg/mL. Then, 200 μL of the mixture was used for UV−visible spectroscopy measurements at an absorbance of 652 nm.
Enzyme dynamic parameters
The Michaelis-Menten constant was calculated based on the Michaelis-Menten saturation curve. For each concentration of H2O2, the initial reaction rates (v) of the oxidation of TMB were calculated from the variation in absorbance using the Beer-Lambert Law (Eq. (1)), which has an ε of 39,000 M−1 cm−1 for oxidized-TMB (ox-TMB) and a b value of 1 cm for the length of the solution in the light path, where c indicates the ox-TMB concentration and A represents the absorbance. The reaction rates were then plotted against their corresponding H2O2 concentration and then fitted with the Michaelis-Menten curves (Eq. (2)). Furthermore, a linear double-reciprocal plot (Lineweaver-Burk plot, Eq. (3)) was used to determine the maximum reaction velocity (Vmax) and Michaelis constant (Km). Furthermore, the turnover number (TON) was calculated according to Eq. (4).
$$c=\frac{A}{\varepsilon b}$$
(1)
$$v=\frac{{V}_{\max }\cdot \left[S\right]}{{K}_{{{{\rm{m}}}}}+\left[S\right]}$$
(2)
$$\frac{1}{v}=\frac{{K}_{{{{\rm{m}}}}}}{{V}_{\max }}\cdot \frac{1}{[S]}+\frac{1}{{V}_{\max }}$$
(3)
$${{{\rm{TON}}}}=\frac{{V}_{\max }}{\left[{E}_{0}\right]}$$
(4)
[S] is the concentration of H2O2, and [E0] is the molar concentration of metal in nanozymes.
Active site poison tests by KSCN
30 mg of KSCN were dissolved in water, followed by the addition of 10 μL of a biocatalyst solution at a concentration of 10 mg/mL. After a duration of 1 h, the mixture underwent centrifugation, subsequent to which the standard peroxidase-like activity assay was conducted.
Analysis of free radicals by quenching experiments
To investigate •OH, a mixture was prepared by adding tert-butanol (TBA, 200 μL), H2O2 (25 μL, 0.1 M), catalysts (10 μL, 10 mg mL−1), and TMB (24 μL, 10 mg mL−1) to NaOAc/HOAc buffer (1740 μL, 100 mM, pH 4.5). After a 10 min reaction period, the absorbance at 652 nm was measured.
To investigate •O2–, a mixture was prepared by adding p-benzoquinone (BQ, 100 μL), H2O2 (25 μL, 0.1 M), catalysts (10 μL, 10 mg mL−1), and TMB (24 μL, 10 mg mL−1) to NaOAc/HOAc buffer (1840 μL, 100 mM, pH 4.5). After a 10 min reaction period, the absorbance at 652 nm was measured.
To investigate 1O2, a mixture was prepared by adding sodium azide (NaN3, 100 μL), H2O2 (25 μL, 0.1 M), catalysts (10 μL, 10 mg mL−1), and TMB (24 μL, 10 mg mL−1) to NaOAc/HOAc buffer (1840 μL, 100 mM, pH 4.5). After a 10 min reaction period, the absorbance at 652 nm was measured.
Detection of •O2
– by HE
The HE probe was utilized to measure the levels of •O2– in a system, which could react with •O2– to produce fluorescent Ethidium at the wavelength of 470 nm and an emission wavelength of 610 nm. The experimental procedure involved mixing 1.5 mL of a catalyst solution (100 μg/mL) with 1.5 μL of 0.1 M H2O2 at 37 °C for 40 min. Subsequently, 1.5 mL of a HE-ethanol solution (1 mg/mL) was added to the system and thoroughly vortexed. The solution was allowed to sit undisturbed for 40 min before being subjected to fluorescence measurements using a Synergy Mx device.
Detection of 1O2 by DPA
In the detection of 1O2, a mixture was prepared by adding 25 μL of a 4 mg/mL catalyst solution, 25 μL of a 0.1 M H2O2 solution, and 100 μL of a DPA-Dimethyl sulfoxide (DMSO) solution into a 2 mL DMSO solution. The mixture was then analyzed using a UV-vis spectrophotometer.
EPR Measurement
The generation of 1O2 was assessed using 2,2,6,6-Tetramethylpiperidine 1-oxyl (TEMP). A mixture was prepared by adding catalysts (10 μL, 10 mg mL−1) and H2O2 (10 μL, 10 M) to NaOAc/HOAc buffer (500 μL, 100 mM, pH 4.5), followed by the addition of 20 μL of TEMP.
The generation of •O2− was assessed using 5,5-dimethyl-1-pyrroline N-oxide (DMPO). A mixture was prepared by adding catalysts (10 μL, 10 mg mL−1) and H2O2 (10 μL, 10 M) to DMSO (500 μL), followed by the addition of 10 μL of DMPO.
O2 generation capability
The capability for O2 generation was assessed using the following procedure: biocatalysts (20 µL, 10 mg mL−1) and H2O2 (200 µL, 10 M) was added to PBS (20 mL, pH 6.5). The concentration of dissolved O2 was measured over a 3 min period using a dissolved oxygen meter, with readings taken at 5 s intervals.
X-ray-activated enzyme-like activity
10 mg of OPD was dissolved in 1 mL of N,N-Dimethylformamide. Then, H2O2 (10 μL, 0.1 M), OPD (24 μL, 10 mg/mL), and different materials (20 μL, 4 mg/mL) were successively added to 1945 μL of NaOAc/HOAc buffer (100 mM, pH 5.5). 200 µL of the resulting solution was transferred into a 96-well plate. After irradiation with X-rays at 6 Gray (Gy), the absorbance was measured at the maximum absorption wavelength of 448 nm.
Cell lines and animals
The CT26 cell line (Cat CRL-2639) was sourced from the American Type Culture Collection (ATCC) and verified for authenticity through short tandem repeat analysis. CT26 cells were cultured in RMPI 1640 medium (Gibco) containing 1% penicillin (Boster), 1% streptomycin (Boster), and 10% fetal bovine serum (FBS, VivaCell) at 37 °C in 5% CO2 humidified air. For subsequent experiments, cells were immediately placed in an anaerobic incubator (Thermo Scientific, USA) filled with 94.5% N2, 5% CO2, and 0.5% O2 after seeding to induce hypoxia. Female BALB/c mice (6–8 weeks old) were purchased from Jiangsu Gempharmatech Co., Ltd. and housed in a specific pathogen-free facility. All mice were maintained under controlled conditions with a 12 h light/dark cycle (lights on from 8:00 a.m. to 8:00 p.m.), constant temperature (18 °C–22°C), and humidity (50–60%), with unrestricted access to standard chow and water. All diets were supplied by Jiangsu Xietong Inc. (Nanjing, China). The animal experiments were approved by the Institutional Animal Care and Use Committee of West China Hospital, Sichuan University (Approval No. 20241017001). All animal experiments were conducted in accordance with the ARRIVE guidelines.
Intracellular ROS detection
The production of ROS was determined by the ROS probe DCFH-DA (Beyotime, China). CT26 cells were pretreated with PBS, MnBTC, or MnBTC-Ru at an equivalent manganese concentration of 4 μg/mL for 4 h followed by irradiation with X-ray at 6 Gy (RS2000, Rad Source, USA; 160 kV, 25 mA, 1 mm Cu filter). After different treatments, cells were treated with DCFH-DA (10 μM) for 30 min before imaging by the Olympus IX83 Live Microscope (Olympus Life Science, Japan). Additionally, cells subjected to different treatments were collected and incubated with DCFH-DA (10 μM) for quantitative ROS detection using flow cytometry (CytoFLEX, Beckman, USA).
ATP detection
The intracellular ATP and released ATP from different treatments were quantified using an enhanced ATP assay kit (Beyotime, China). The fluorescence signal was collected with a BioTek SynergyTM Mx microplate reader.
MDA detection
The MDA levels were determined using a lipid peroxidation assay kit (Beyotime, China). Protein concentrations of the cell lysates were quantified with a Bicinchoninic Acid protein assay kit (Beyotime, China).The fluorescence signal was collected with a BioTek SynergyTM Mx microplate reader.
Detection of HIF-1α expression
Immunofluorescence staining was performed to assess HIF-1α expression. CT26 cells were pretreated with PBS, MnBTC, or MnBTC-Ru. Cells were fixed with 4% formaldehyde, permeabilized using Triton X-100, and blocked with 1% Bovine Serum Albumin (BSA). Subsequently, they were incubated overnight at 4 °C with an anti-HIF-1α antibody (Abcam, Catalog No. ab179483, 1:500 dilution), followed by a 1 h incubation with a fluorescent secondary antibody. Nuclei were counterstained with DAPI for 10 min prior to imaging.
Apoptosis/necrosis assays
CT26 cells were cultured in six-well plates overnight and incubated with PBS, MnBTC, or MnBTC-Ru for 4 h followed by irradiation with X-ray at 6 Gy. After 48 h, the cells were stained according to the Annexin V-FITC/PI cell apoptosis kit (4 A BIOTECH, China) and quantified by flow cytometry (CytoFLEX, Beckman, USA).
Live/dead assay
CT26 cells were cultured in 24-well plates overnight and incubated with PBS or MnBTC-Ru followed by irradiation with X-ray at 6 Gy. After 48 h, the cells were stained according to the Calcein/PI Live/Dead Viability Assay Kit (Beyotime, China) and imaged by the Olympus IX83 Live Microscope (Olympus Life Science, Japan).
Cell migration assays
Cell migration was evaluated using 6.5 mm polyethylene terephthalate membrane transwell chambers with 8.0 μm pores (Labselect, China). CT26 cells were pretreated with PBS or MnBTC-Ru at an equivalent manganese concentration of 4 μg/mL for 4 h followed by irradiation with X-ray at 6 Gy. Complete medium containing 10% fetal calf serum was placed in the lower chamber, while serum-free medium was added to the upper chamber. After 24 h of incubation, non-migrated cells on the upper surface were gently removed, and migrated cells on the lower side of the membrane were fixed with 4% formaldehyde and stained using 0.1% crystal violet prior to quantification.
Detection of CRT expression
The expression of CRT was examined using immunofluorescence assays. After various treatments, cells were fixed with 4% formaldehyde and blocked with 1% BSA. Subsequently, they were incubated overnight at 4 °C with an anti-CRT antibody (Abcam, Catalog No. ab92516, 1:500 dilution), followed by a 1 h incubation with a fluorescent secondary antibody. Nuclei were counterstained with DAPI for 10 min prior to imaging.
γ-H2AX immunofluorescence assay
CT26 cells were pre-seeded in a 96-well plate overnight and incubated with PBS, MnBTC, or MnBTC-Ru at an equivalent manganese concentration of 4 μg/mL for 4 h followed by irradiation with X-ray at 6 Gy. After irradiation, immunofluorescence staining for γ-H2AX was performed using the DNA damage assay kit for γ-H2AX immunofluorescence (Beyotime, China). Images were acquired using the Olympus IX83 Live Microscope (Olympus Life Science, Japan).
Tumor models and treatment experiments
To establish a unilateral tumor model, we subcutaneously injected 5 × 10⁵ CT26 cells into the right flank of female BALB/c mice (6-8 weeks old). Treatment began when the tumor size reached 80–100 mm3 (7 days after inoculation). The mice were randomly divided into six groups: Control, MnBTC, MnBTC-Ru, RT, RT+MnBTC, and RT+MnBTC-Ru. Four hours before RT, mice in each group received intratumoral injections of Control/MnBTC/MnBTC-Ru (equivalent manganese doses of 40 μg per mouse). For groups undergoing RT, mice were anesthetized with 1% pentobarbital sodium (100 μL per 18 g body weight) and placed in individual lead boxes to expose the tumor area to irradiation while shielding the rest of the body. RT was administered using an X-ray irradiator (RS2000, Rad Source, USA) with parameters set at 160 kV and 25 mA. Following treatment, tumor size, and body weight were measured every other day. Tumor volume (mm3) was calculated using the formula (length × width2) × 0.5. Euthanasia was performed if the tumor volume exceeded 2000 mm3 or if signs of distress were observed.
To establish a bilateral tumor model, we subcutaneously injected 5 × 10⁵ CT26 cells into the right flank of female BALB/c mice as the primary tumor and 5 × 10⁴ cells into the left flank as the distant tumor. Treatment began when the tumor size reached 150–200 mm3 (8 days after inoculation). The mice were randomly divided into five groups: Control, RT, RT+MnBTC-Ru, RT+anti-PD-1, and RT+MnBTC-Ru+anti-PD-1. Four hours before RT, mice in each group received intratumoral injections of Control/MnBTC-Ru in the primary tumor. In vivo anti-PD-1 antibody was obtained from BeiGene (Ch15mt). For mice in groups receiving anti-PD-1 treatment, anti-PD-1 was administered via intraperitoneal injection (20 mg/kg on Day 0, 10 mg/kg on Day 1 and Day 2). The RT of the primary tumor and the subsequent monitoring of bilateral tumors were the same as the aforementioned procedures.
To establish an immune memory model, mice with unilateral tumors were treated with RT+MnBTC-Ru+anti-PD-1. Mice exhibiting complete tumor regression after this treatment were considered effectively treated and were used for further analysis. The specific tumor inoculation methods and treatment procedures are as described above. Age- and sex-matched naive mice were set up as a Control group. On day 90, a tumor rechallenge was conducted by inoculating 5 × 10⁵ CT26 tumor cells into the left flank of the effective treatment model and naive mice. The subsequent monitoring of tumors was the same as the aforementioned procedures.
In vivo fluorescence imaging
Tumor tissues collected from mice were fixed in 4% formalin for 48 h, then embedded in paraffin, and sectioned into 4 μm slices. The slides were subjected to the TUNEL assay following established protocols from previous studies. For immunofluorescence, tissue sections were first treated with anti-γ-H2AX antibody (Servicebio, Catalog No. GB111841, 1:100 dilution), followed by labeling with Cy3-conjugated goat anti-rabbit IgG (Servicebio, Catalog No. GB21303). Another set of tissue sections was treated with anti-Ki67 antibody (Servicebio, Catalog No. GB111141, 1:500 dilution) and labeled with Cy3-conjugated goat anti-rabbit IgG (Servicebio, Catalog No. GB21303). Additionally, tissue sections were treated with anti-CD8 antibody (Servicebio, Catalog No. GB15068, 1:1000 dilution) and labeled with Cy3-conjugated goat anti-rabbit IgG (Servicebio, Catalog No. GB21303). Images were acquired using the Olympus VS200 (Olympus Life Science, Japan).
In vivo biocompatibility study
To evaluate biocompatibility, blood samples were obtained from mice on day 12 after treatment and subjected to blood chemistry analysis by Lilai Biotechnology Co., Ltd. (Chengdu, China). Simultaneously, major organs, including the heart, liver, spleen, lungs, and kidneys—were harvested, fixed in formalin, embedded in paraffin, sectioned, and stained with H&E following standard procedures. Tissue images were captured using an Olympus VS200 (Olympus Life Science, Japan).
In vivo biodistribution study
For the biodistribution study, BALB/c mice bearing CT26 subcutaneous tumors were respectively injected with MnBTC-Ru. Computed Tomography (CT) scans (NEMO micro-CT, Pingseng Scientific, China) were performed at five-time points: before injection and at 4 h, 6 days, 12 days, and 18 days post-injection. To visualize the spatial relationship between the MnBTC-Ru and the subcutaneous tumor, DICOM images obtained from CT scans were processed and reconstructed into 3D models using Imaris software (10.2).
Additionally, at 6, 12, and 18 days post-injection, major organs (including the heart, liver, spleen, lungs, and kidneys), tumor tissues, and key metabolic excreta (urine and feces) were collected. Following accurate weighing, each sample was digested in aqua regia at 80 °C until complete dissolution was achieved. The resulting mixture was centrifuged at 12,000×g for 20 min, and the supernatant was collected for subsequent analysis by inductively coupled plasma mass spectrometry (ICP-MS, Agilent 7850).
Flow cytometry analysis
The tumor tissues and spleen of CT26 tumor-bearing BALB/c mice after different treatments were retrieved for flow cytometry analyses. Single-cell suspensions were prepared from excised tumor tissues or spleen, followed by incubation with FVS440UV (BD, Catalog No. 566332, 1:1000 dilution) for 30 min to assess cell viability. Subsequently, the cell suspension was incubated with purified Rat Anti-Mouse CD16/CD32 (BD, Catalog No. 553141, 0.5 μg per test) to block nonspecific binding, and then stained with anti-CD45-APC-CY7 (BD, Catalog No. 557659), anti-CD3-BUV395 (BD, Catalog No. 563565), anti-CD4-BUV661 (BD, Catalog No. 741461), anti-CD8-BV771 (BD, Catalog No. 563046), anti-CD69-PE-CY7 (BD, Catalog No. 552879), anti-CD44-PerCP-Cy5.5 (BD, Catalog No. 560570), anti-CD62L-FITC (BD, Catalog No. 561917). All antibodies were prepared at a final concentration of 0.2 μg per test. After staining, cell suspensions were filtered and analyzed using a FACS FCM (FACSymphony A5, BD, USA), and data were processed with FlowJo software (version 10.8.1).
Statistical analysis
Statistical analyses were performed using GraphPad Prism 10.2.3 software (GraphPad Software Inc.). Experimental parameters, including sample size (n), statistical significance (p), data normalization protocols, and specific statistical tests, are comprehensively detailed in the corresponding images and figure legends. Quantitative data were collected at least three independent times. All data are expressed as the mean values ± SD. Statistical significance was determined using the Student’s t test for two-group comparisons, and one-way ANOVA for multiple-group comparisons, followed by Tukey’s two-tailed post-hoc test for pairwise analysis, all tests were two-sided.
Reporting summary
Further information on research design is available in the Nature Portfolio Reporting Summary linked to this article.