
Gold has formed a new all-time high near the $2740 per troy ounce figure, with the precious metal seemingly on track to break that all-time high this week. Fundamental factors affecting gold’s price include the relationship between the USD and Gold’s price, the Fed’s intentions, the US Presidential elections and lastly the geopolitical tensions in the Middle East & Asia. We will be concluding this report with a technical analysis of gold’s four hour chart.
Gold’s negative correlation with USD continues to be inactive
The negative correlation of the USD with gold’s price has been inactive over the past week. Over the past week, the USD continued to strengthen against its counterparts, while the gold’s price moved higher, forming new all-time high’s along the way. Similarly to gold’s price US bond yields moved higher since our last report, failing to negatively affect the precious metal’s price. Hence for the time being we ignore the USD’s recent movement in conjunction with gold’s price and instead opt to focus on other factors. Yet should the USD continue to strengthen or should US yields continue on their current upward trajectory, we may see gold traders not being able to ignore the greenback’s rally, or even preferring US bonds which are interest-bearing instead of the precious metal. Yet for the time being, we highlight the disconnection of gold from USD’s direction as well as the direction of US Bond yields.
Fed rate cut path in question
Since our last report, several Fed policymakers have spoken with all appearing to be centering around one particular point, which is not if the Fed should cut rates, but by how much they should reduce interest rates. In particular, at the beginning of the week, Kansas Fed President Schmidt stated that he “supports dialing back the restrictiveness of policy”, followed by San Francisco Fed President Daly who stated that she does not “want to see the labour market slow further”, which may have amplified the market’s expectations of two rate cuts from the Fed by the end of the year. Yet despite the relatively dovish rhetoric, Minneapolis Fed President Kashkari implied that the dialing back of monetary policy restrictiveness may be in a manner that would avoid outsized moves. The comments made by Minneapolis Fed President Kashkari, could contradict the market’s current expectations of two rate cuts by the end of the year which in theory may aid the dollar whilst weighing on the precious metal’s price given their inverse relationship with one another. However, gold traders may have glossed over the possibility of less than two rate cuts by the end of the year and may have instead focused on the bigger picture which is that the Fed may continue on its rate-cutting cycle, which in turn may aid gold’s price.
T-minus 14 days till the US Presidential elections
As of today, we are two weeks away from the US Presidential elections which will see the incumbent Vice President Harris (D) take on former President Trump (R) in a race that is still too close to call. In particular, the lead that Vice President Harris appears to have had over the former President in the key swing states appears to have withered down to less than 1%, with some recent polls giving former President Trump a slight lead. Nonetheless, the market seems to be increasingly convinced that Trump may win the elections, given the USD’s strengthening over the past two weeks. Therefore, given the former US President’s intentions for a more isolationist economic policy, characterized by tariffs such an outcome could support the USD which could weigh on the precious metal given their inverse relationship. Yet, with the race being this close, there appears to be a high level of uncertainty as to who will emerge as the victor and whether or not their respective political party will be able to win a majority in both the House and the Senate. Moreover, should the elections be decided by a narrow margin we may see Trump or Harris contesting the results which could prolong the entire process. In conclusion, as election day nears and with no clear victor emerging, we may see market jitters funnel safe-haven inflows into the precious metal, which in turn may aid gold’s price.
Geopolitical tensions bonanza
The war in the Middle East is ongoing, with Israel assassinating Hamas leader Yahya Sinwar last Wednesday and Hezbollah attempting to assassinate Israeli PM Netanyahu by striking his personal residence on Sunday in an attempt to retaliate on behalf of Hamas. The issue remains extremely volatile, with Israel expanding its military activities in Southern Lebanon which tends to enhance the possibilities of a regional war between Israel and Iran that could have dire consequences for the rest of the region. Moreover, on the other side of the planet, tensions between North and South Korea remain elevated, with SK claiming that NK has sent troops to Russia to help in the war effort against Ukraine. Overall, the geopolitical uncertainties on a global scale may aid gold’s price given its status as a safe haven asset. On the flip side, should the aforementioned tensions begin to ease, it could instead weigh on gold’s price.
Technical analysis
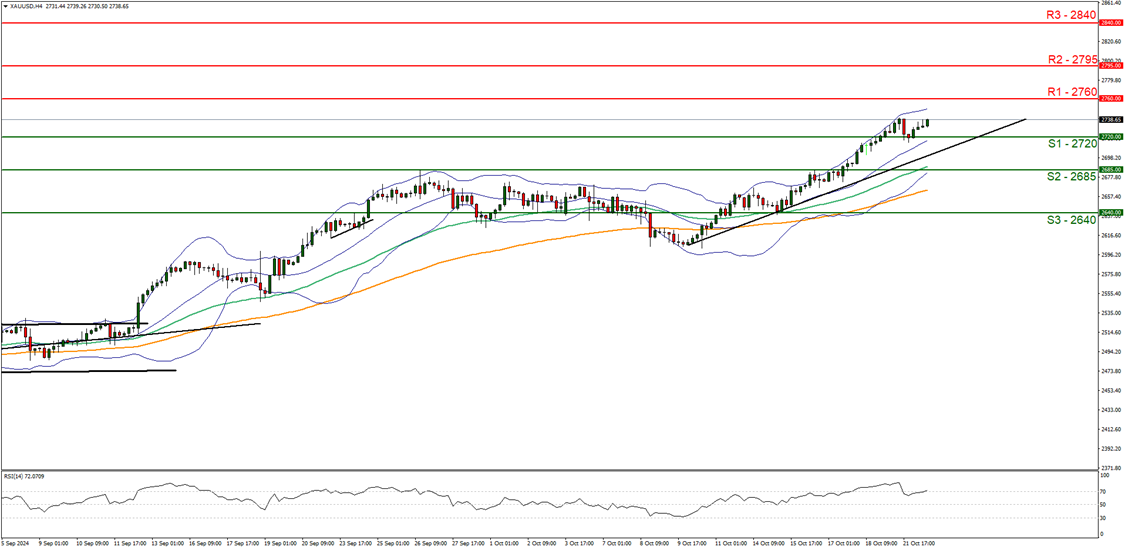
XAUUSD 4H chart
-
Support: 2720 (S1), 2685 (S2), 2640 (S3).
-
Resistance: 2760 (R1), 2795 (R2), 2840 (R3).
Gold’s price appears to be moving in an upwards fashion after bouncing off our 2720 (S1) support level and currently appears to be on track to form a new all-time high level. We opt for a bullish outlook for the precious metal and supporting our case is the upwards-moving trendline which was incepted on the 10th of October, in addition to the RSI indicator below our chart which currently registers a figure of 70, implying a strong bullish market sentiment. For our bullish outlook to continue, we would require a clear break above the potential 2760 (R1) resistance level, with the next possible target for the bulls being the 2795 (R2) resistance line. On the flip side for a sideways bias we would require the precious metal to remain confined between the 2720 (S1) support level and the possible resistance level at 2760 (R1). Lastly, for a bearish outlook, we would require a clear break below the 2720 (S1) support level, with the next possible target for the bears being the 2685 (S2) support line.