
Most recent article: Gold price dips as traders brace for US GDP data
- Gold price rebounds above $2,500 in Thursday’s Asian session.
- Rising Fed rate cut expectations and ongoing conflicts in the Middle East underpin the yellow metal.
- A firmer US Dollar might limit Gold’s upside.
Gold price (XAU/USD) recovers some lost ground on Thursday after bouncing off the weekly lows in the sub-$2,500 region per troy ounce. The expectation of US interest rate cuts might lift the Gold demand as lower interest rates reduce the opportunity cost of holding non-yielding gold. Additionally, the current political uncertainty in the US, geopolitical tensions in the Middle East and global economic concerns contribute to the precious metal’s upside.
On the other hand, the renewed US Dollar (USD) demand could weigh on the USD-denominated Gold price as it makes gold more expensive for most buyers. Investors will closely monitor the second estimate of the US Gross Domestic Product for the second quarter (Q2) on Thursday for more cues about the size and pace of the Federal Reserve (Fed) rate cut. On Friday, the US Personal Consumption Expenditures (PCE) Price Index data for July will take center stage.
Daily Digest Market Movers: Gold price remains strong amid rising rate cut bets
- Demand for gold will continue to be driven by emerging markets, particularly China, India, and Turkey, noted John Reade, Chief Market Strategist at the World Gold Council.
- “US data has failed to give gold any further lift, so the temptation for traders to book some profit after a long run has been rising,” said Ole Hansen, head of commodities strategy at Saxo Bank A/S.
- The US Gross Domestic Product (GDP) growth number for Q2 in the second estimate is expected to grow 2.8%.
- The headline Personal Consumption Expenditures (PCE) Price Index is expected to show an increase of 2.6% YoY in July, compared to 2.5% in June. The core PCE inflation is projected to rise from 2.6% to 2.7% YoY.
- The rate futures markets have fully priced in a 25 basis points (bps) rate cut in September, while the possibility of a deeper rate cut stands at 36.5%, according to the CME FedWatch Tool. Traders see 100 bps Fed easing this year.
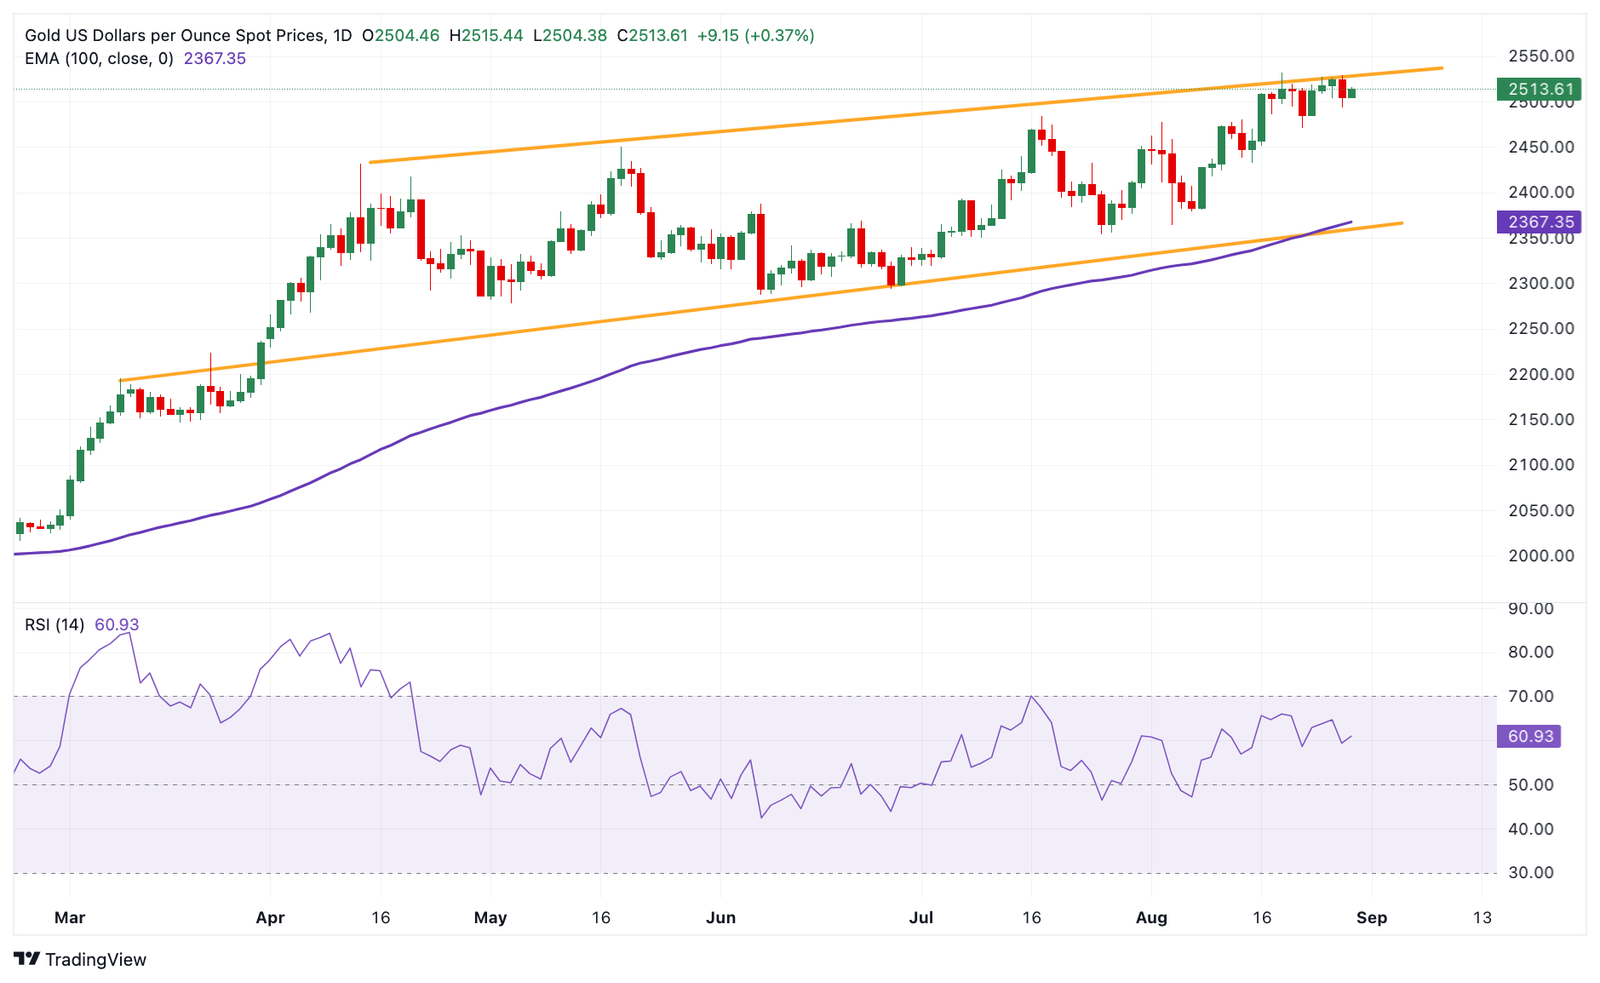
Technical Analysis: Gold price offers a bullish outlook in the longer term
The Gold price trades in positive territory on the day. The precious metal remains stuck under a five-month-old ascending channel upper boundary and the all-time high. However, the overall picture is bullish, with the price well above the key 100-day Exponential Moving Average (EMA) on the daily timeframe. The upward momentum is confirmed by the 14-day Relative Strength Index (RSI) position above the midline near 61.00, indicating that there is potential for further upside.
The confluence of the all-time high and the upper boundary of the trend channel in the $2,530-$2,535 zone acts as the crucial upside barrier for the yellow metal. Extended gains could see a rally to the $2,600 psychological mark.
The immediate support level for XAU/USD is located at the $2,500 round figure. A decisive break below this level could lead to a significant sell-off towards $2,432, the low of August 15. The next contention level is seen at $2,367, the 100-day EMA.
US Dollar price in the last 7 days
The table below shows the percentage change of US Dollar (USD) against listed major currencies in the last 7 days. US Dollar was the weakest against the New Zealand Dollar.
| USD | EUR | GBP | CAD | AUD | JPY | NZD | CHF | |
| USD | 0.20% | -0.85% | -0.85% | -0.64% | -0.46% | -1.89% | -1.19% | |
| EUR | -0.20% | -1.08% | -1.04% | -0.84% | -0.66% | -2.10% | -1.40% | |
| GBP | 0.84% | 1.03% | 0.02% | 0.22% | 0.40% | -1.03% | -0.32% | |
| CAD | 0.84% | 1.04% | -0.01% | 0.21% | 0.46% | -1.04% | -0.34% | |
| AUD | 0.64% | 0.84% | -0.21% | -0.20% | 0.19% | -1.24% | -0.55% | |
| JPY | 0.45% | 0.66% | -0.40% | -0.42% | -0.18% | -1.47% | -9973.87% | |
| NZD | 1.86% | 2.06% | 1.02% | 1.03% | 1.24% | 1.42% | 0.69% | |
| CHF | 1.18% | 1.38% | 0.33% | 0.34% | 0.54% | 0.76% | -0.70% |
The heat map shows percentage changes of major currencies against each other. The base currency is picked from the left column, while the quote currency is picked from the top row. For example, if you pick the Euro from the left column and move along the horizontal line to the Japanese Yen, the percentage change displayed in the box will represent EUR (base)/JPY (quote).