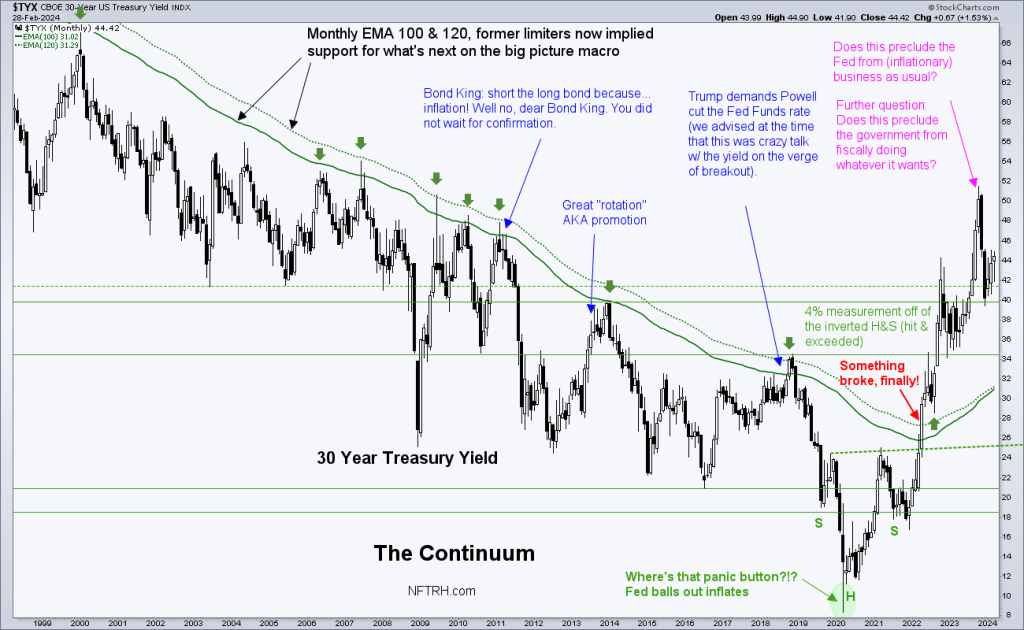
It is the nature of the masses, the majority, the consensus… the HERD, to follow the trend. It is a lot easier to swim downstream than to fight the current. Just go with the flow. And from a US-centric view the flow has, with a blessed interruption from 2001 to 2003, been inflationary monetary policy free flowing into asset markets as needed and on demand at every point of financial crisis since. Armageddon ’08 and the COVID crash were two primary examples.
With the “Continuum” squarely showing a disinflationary trend for decades, full license was given to our policy heroes to act, mopping up each crisis with an unrelenting fire hose of ‘whatever it takes!’ monetary policy. Throw in a side order of government (democrat or republican) always willing to spend and stimulate its favored areas (often very different areas per the party in power, but favored areas nonetheless) and you’ve got an ongoing bubble in monetary and fiscal policy, and you’ve got a toxic environment for the wretched companies that dig the monetary metal (which is well outside the ‘debt for growth’ system) out of the ground.
This chart tells a story of something that was in place for decades (going back to the 1980s, not shown on this chart) that is no longer in place. In my opinion, markets operating as if all is as it has been (hello US headline indexes, bad breadth and all) are dead men walking. The Continuum is a pictorial view of the funding mechanism of the bubble. Well, the mechanism is severely altered, if not broken.
I began this post with the intention to keep it very simple and have already veered from that course. So let’s get it back on course. Let’s take a look at gold stocks through the prism of their relationship to and gold’s relationship to other markets.
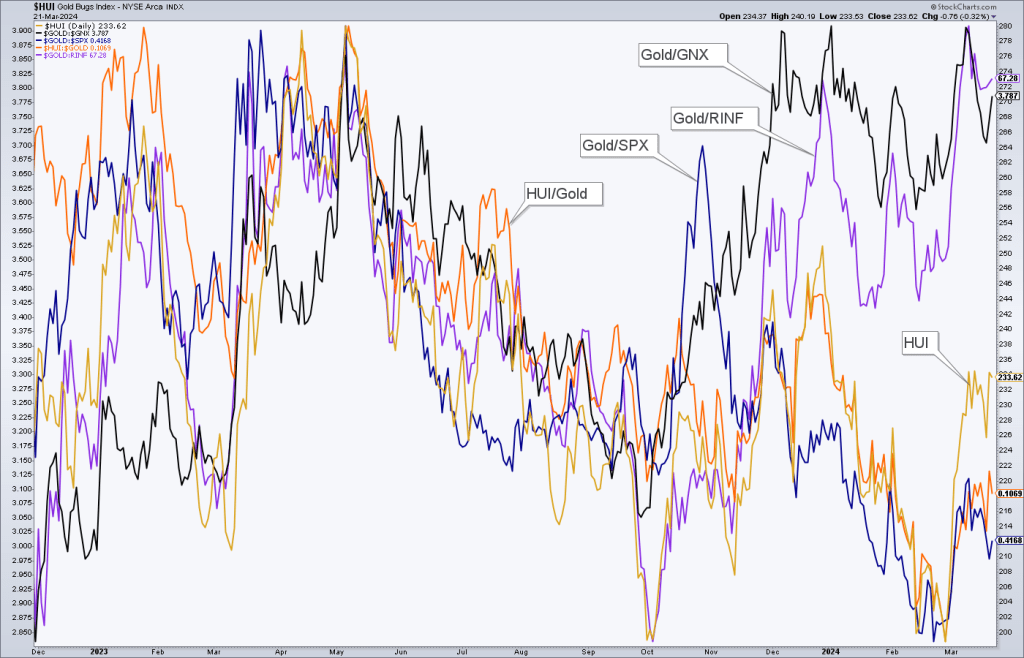
This daily chart shows that in 2023 gold stocks () had rightly traveled both positively and negatively in line with their best fundamental gauges. Those are gold’s relationships with commodities and inflation. When gold declined in relation to inflation signalers like ‘inflation expectations’ gauge RINF and commodity index , gold stocks declined right along with them. As it became apparent that inflation was weakening and gold rose vs. those items, gold stocks rallied.
Then came the disconnect and positive divergence (for gold stocks) by gold’s relationship to the inflation signalers (RINF, GNX, etc.). I believe this happened because the herd finally bought the disinflationary ‘Goldilocks’ (soft landing or even NO landing) story as euphoria set in and Tech/Growth stocks gained momentum. The hard decline by HUI from Q4, 2023 to Q1, 2024 aped the decline in gold vs. the stock market (SPX). Of course, the HUI/Gold ratio tagged right along. “Gold stocks suck!” demands the herd. And the herd is right; for now.
The NFTRH view has for over a year been for disinflationary Goldilocks to be followed by an uncomfortable decline in inflation. In other words, a deflation scare, quite possibly as a precursor to the next terrible inflation phase out in 2025 or thereafter.
With indexes like , and still orbiting in blue sky the Gold/SPX ratio is in the tank and right along with it have been gold stocks (and their ratio to gold). While Gold/GNX and Gold/RINF have represented a positive divergence for gold stocks, Gold/SPX has been quite the opposite. Hence, we await the end of the currently at high risk bull market in stocks.
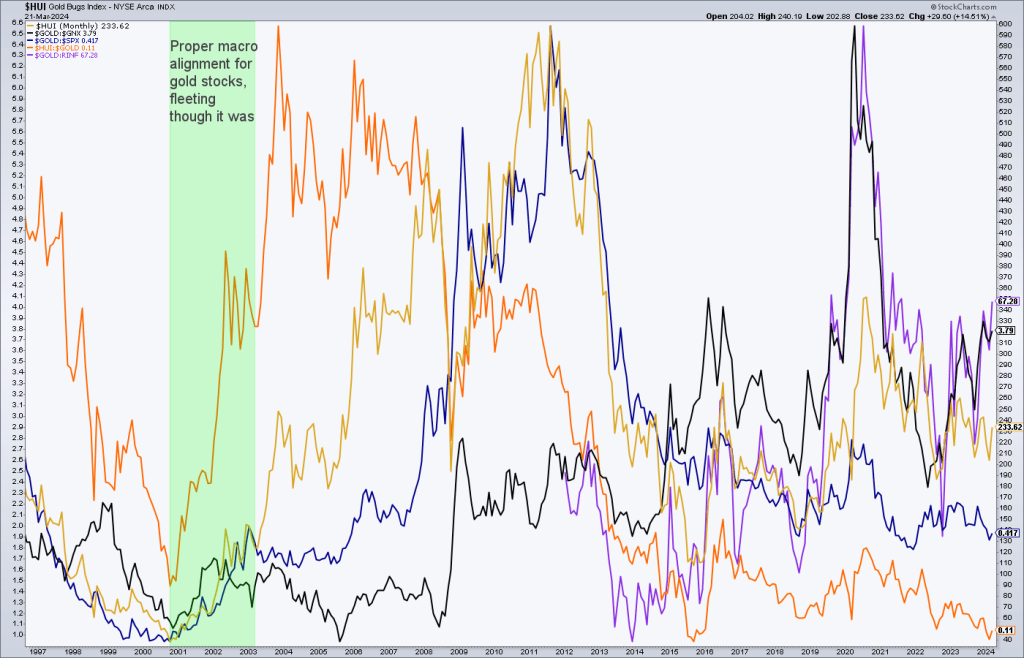
Here is the same chart, expanded to a long-term view showing the 2001-2003 period when Gold/SPX rose, Gold/GNX rose and by extension, HUI/Gold and nominal HUI rose. There was no such thing as an ‘inflation expectations’ ETF back then, but using TIP/TLT or TIP/IEF, you’d get the same result; gold rising in relation to those ratios. After 2003, gold stocks entered a bubble as they blasted off to the stratosphere despite a negative macro as gold under-performed commodities and flat lined vs. stocks during that inflationary time.
The Political Backdrop
I usually disregard political rancor in my analysis, but this year I have been hit over the head with the fact that the Fed has been monetizing out the back door while playing tough guy on TV (to the public). It is not lost on me that Biden administration Treasury Secretary Yellen is the Fed chief who preceded Powell and is probably hard wired to him. My tin foil hat thesis is that she’s got his ear, if she’s not actively coordinating with him.
Here again is a graph showing the sneaky monetization of debt ongoing, as if a regulator or pressure release to its hawkish Fed Funds policy as consumed by the public.

The above represents both Monetary (Fed) and Fiscal (government) policy potentials and is a reason I have had to revise my original view for the stock rally from Q1-Q2, and then Q4, 2023 to potentially into or even through the 2024 election. “Potentially”, mind you. With the risk levels (by so many indicators beyond the scope of this article, but illustrated frequently over the last several months) currently in play, a condition (although not a timer) for a top is already in place.
Circling back to gold stocks, the miners’ product is doing just fine, up there in blue sky as well. Although gold’s blue sky is nothing like the bubble beneficiaries like the major stock indexes. But if, like me, you think the stock market is a dead man walking, it will only be a matter of time before the macro fully aligns for gold stocks and the massive pro-stocks herd, which would never consider a filthy investment like gold stocks, ends up wrong as it always does sooner or later.
It’s been a long time since 2003. A couple decades is too long to fight a market based on principle. I believe strongly in giving my best effort to illustrate what I see, not what I want to see. What I see now is a big macro shift in progress. Not complete, but methodically progressing. Patience.


