Fundamental
Overview
Gold got stuck in a consolidation near a key support zone as the market
awaits a catalyst or key technical breakouts to find some momentum. Last week,
we got some very good inflation data from the CPI
and PPI
which should support gold in the bigger picture as it will give the Fed more
confidence to start cutting rates at some point in the last part of the year.
Unfortunately, the last FOMC decision turned out to be a
bit more hawkish than expected although Fed
Chair Powell made it clear that their forecasts can change as they remain very
data dependent. As of now, it looks like gold have limited downside but lots of
upside as inflation abates slowly while risks to the growth picture increase
the longer the Fed keeps policy restrictive.
In the short-term, strong US data might weigh a bit on the market, but in
the long-term weak data is likely to trigger bigger upside moves.
Gold
Technical Analysis – Daily Timeframe
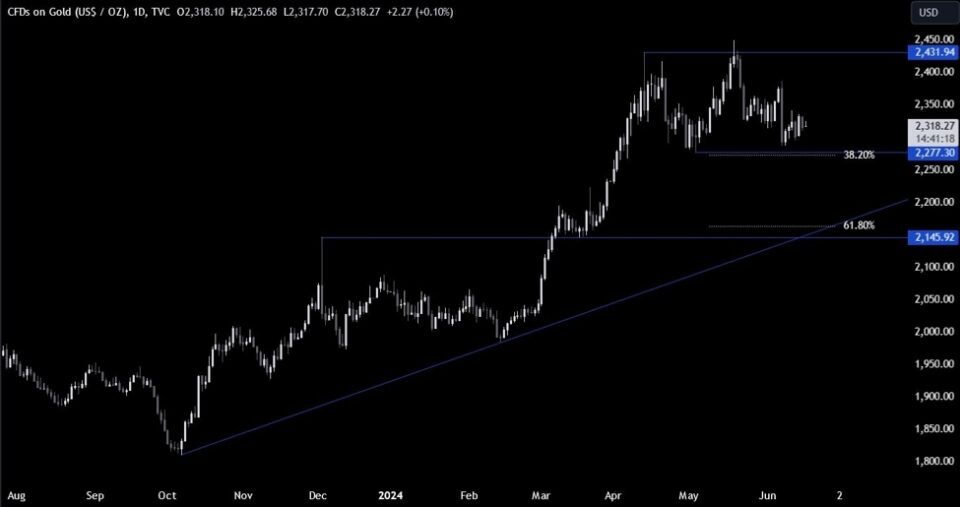
Gold Daily
On the daily chart, we can
see that gold is consolidating near the key support zone around the 2277 level where we have also
the 38.2% Fibonacci retracement level for confluence. If the price eventually drops into
the support, we can expect the buyers to step in with a defined risk below it
to position for a rally into a new all-time high with a better risk to reward
setup.
The sellers, on the other
hand, will want to see the price breaking lower to gain even more conviction
and increase the bearish bets into the major trendline around the 2150 level.
Gold Technical Analysis
– 4 hour Timeframe
Gold 4 hour
On the 4 hour chart, we can
see more clearly the rangebound price action since last week as the price continues
to hover around the resistance zone at 2325. If the price break above the
resistance and the downward trendline, we should see the bullish momentum
increasing and the price rallying into the swing high at 2387 next. The sellers,
on the other hand, will likely lean on the trendline and position for a break
below the support with a better risk to reward setup.
Gold Technical Analysis
– 1 hour Timeframe
Gold 1 hour
On the 1 hour chart, we can
see that the price probed above the resistance zone a couple of times but eventually
got smacked back down. For now, there’s not much to do here other than waiting
for a strong catalyst or the key technical breakouts. The red lines define the average daily range for today.
Upcoming
Catalysts
Today we have the US Retail Sales and US Industrial Production. On Thursday,
we get the US Housing Starts, Building Permits and the latest US Jobless Claims
figures. On Friday, we conclude the week with the US PMIs.