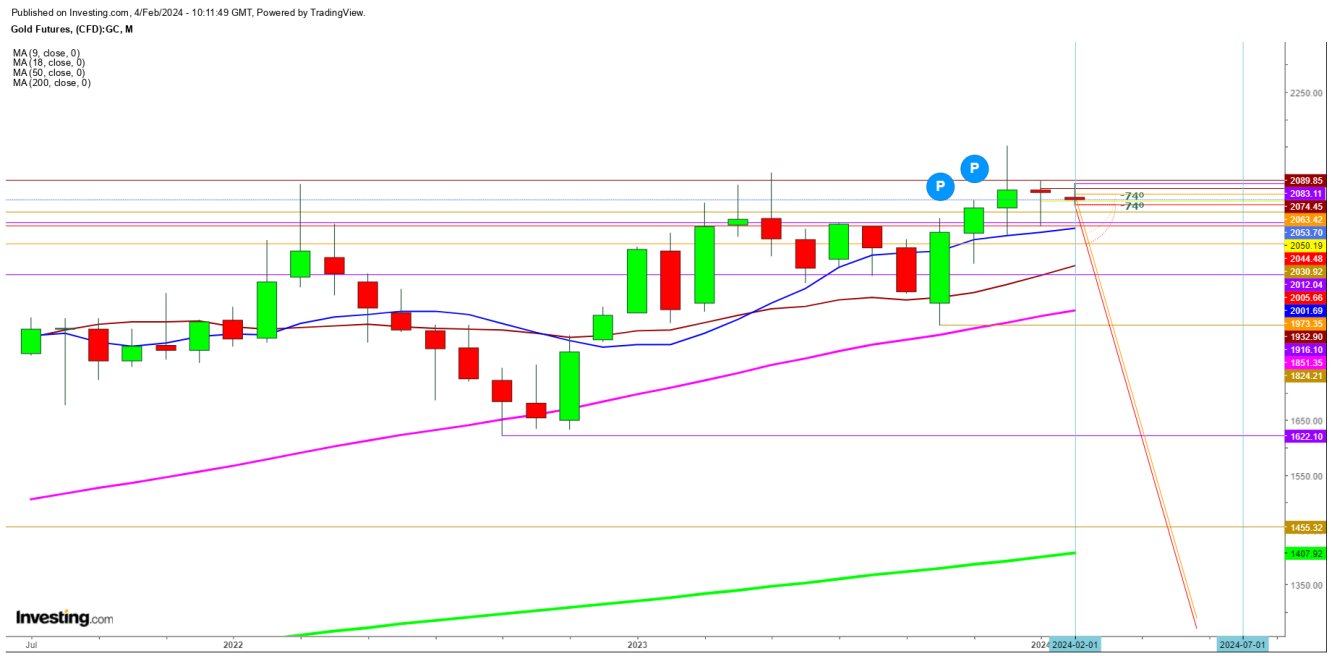
Since I predicted a steep fall in the while writing my last analysis, April gold futures closed Friday with a loss of $17.
Precious metals on Friday retreated as Friday’s stronger-than-expected U.S. Jan payroll announcement pushed the to a 7-week high. Secondly, higher global bond yields on Friday weighed on precious metals.
Undoubtedly, Friday’s U.S. payroll info shows strength in the labor market has pushed back expectations for Fed rate cuts, a bearish factor for precious metals.
Thirdly, a rally in the to a record high deflated safe-haven demand for precious metals.
On the other hand, Gold futures also weighed down from ongoing long liquidation of gold by funds after long gold holdings in ETFs fell to a 4-year low Thursday.
After analysis of the movements of the gold futures in different time frames, I find that the exhaustion could continue after a wobbly Friday as the monthly candle formed within the first three trading sessions looks evident enough for a steep slide during February and March 2024.
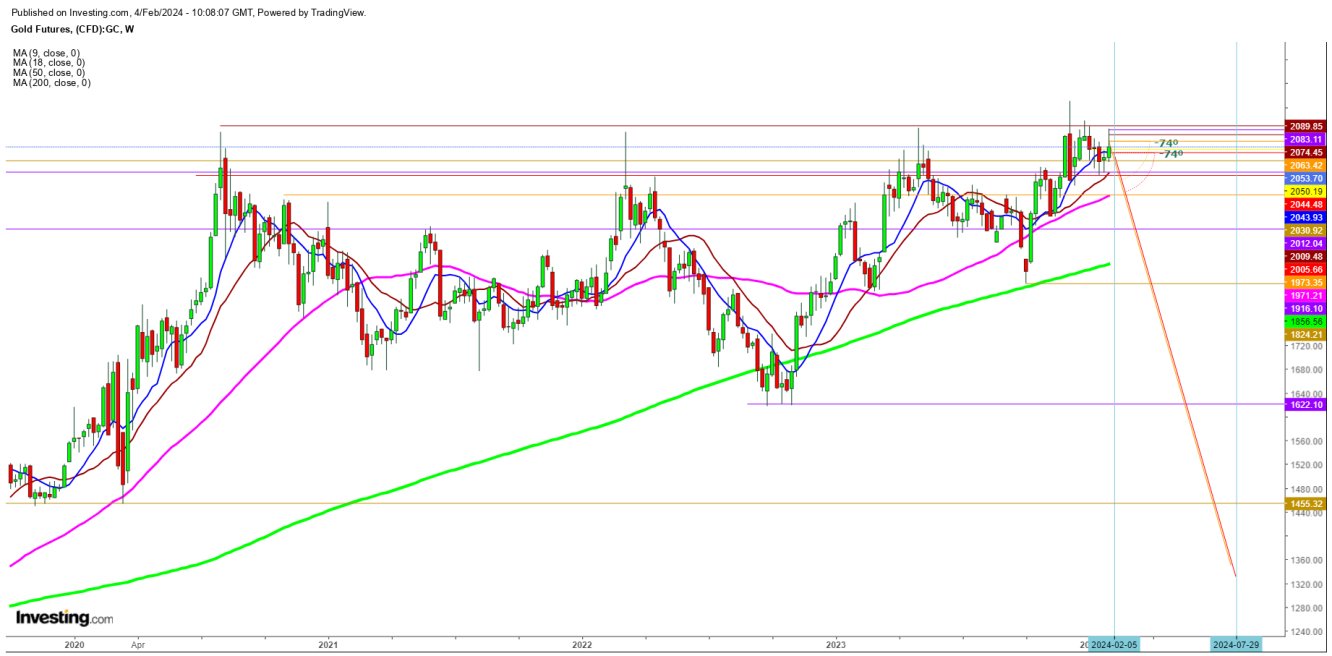
In the weekly chart, gold futures started the last week with an opening at $2037.20, hit a high at $2083 and a low at $2037.20, and finally closed the week at 2053.10, indicating the weakness due to the formation of a weekly exhaustive candle.
Undoubtedly, the opening of the next week and subsequent movements by the gold futures on Monday and Tuesday will play a significant role as the gold futures are currently at a deceiving point in 2050.
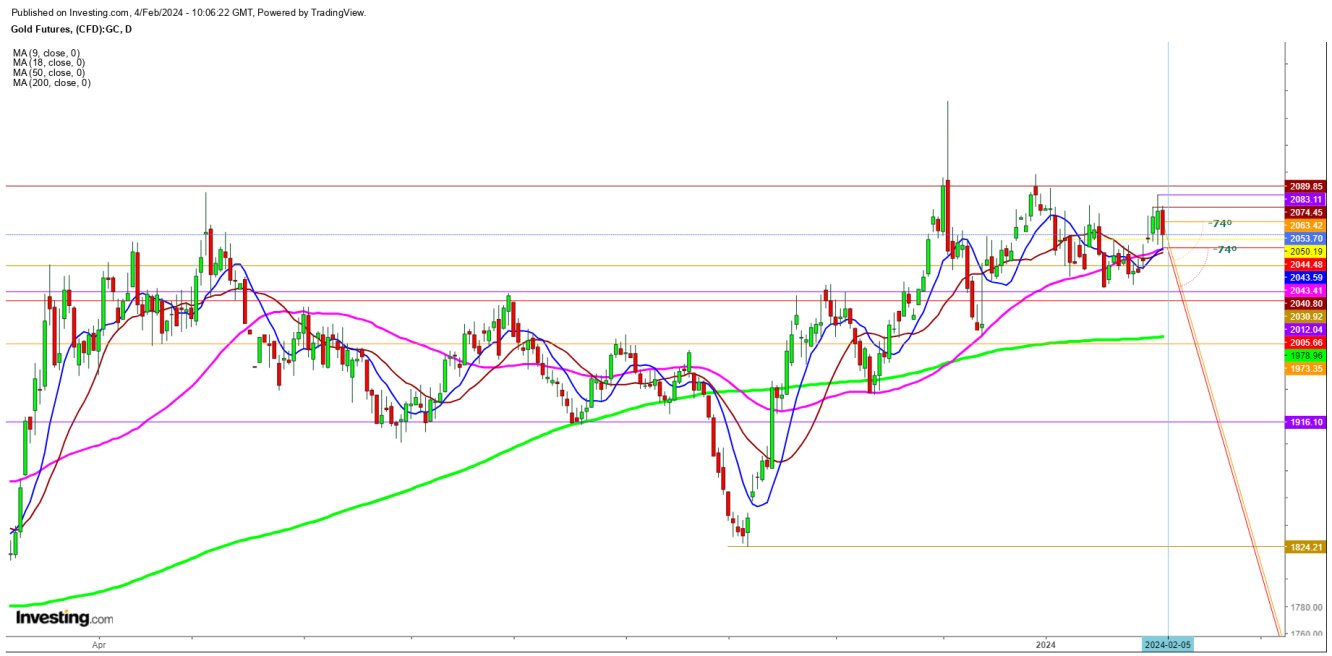
In the daily chart, gold futures witnessed a steep fall amid a wobbly session on Friday, found temporary support at the 50 DMA at $2043.41 and closed at $2053.10 on Friday, which indicates that a breakdown below this immediate support could push the gold futures towards the next support at $2005.66. Without any doubt, a sustainable move below this could drag down the gold futures to hit the 200 DMA at $1978.96.
On the other hand, any upward move by the gold futures could attract the bears at $2074 as the volatility is likely to continue till the next meetings of the FOMC in April and May 2024.
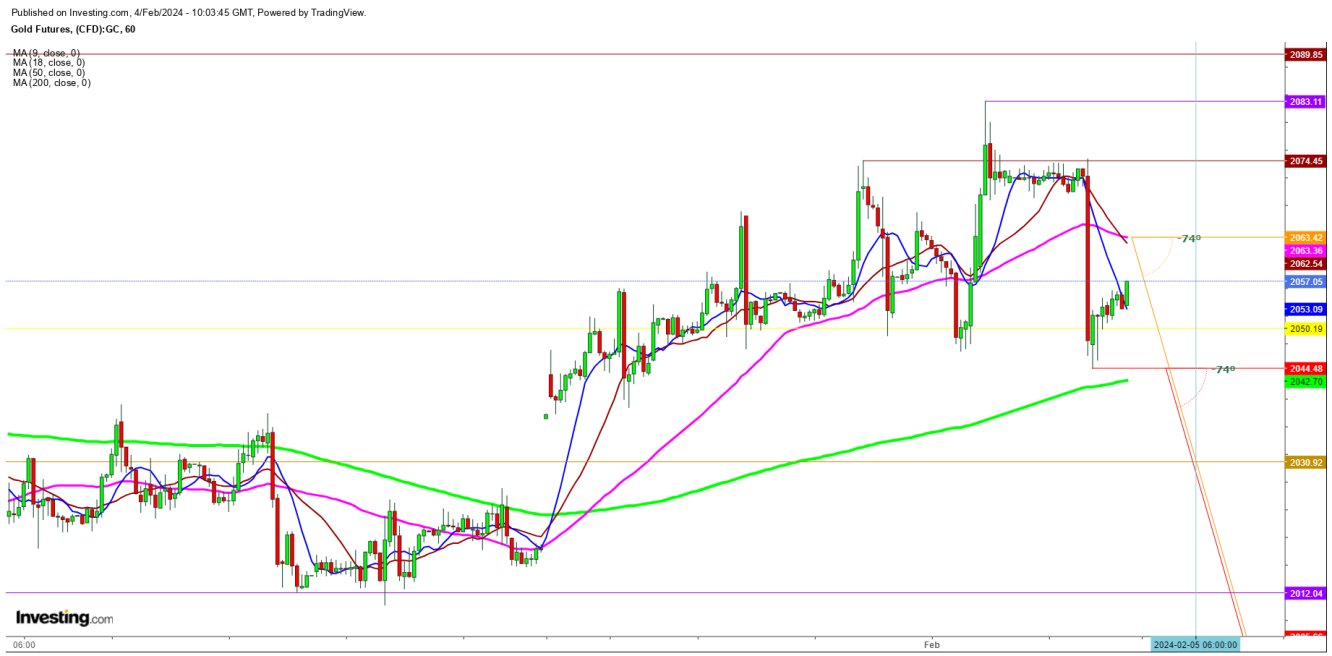
In the 1-hr. chart, gold futures indicate a slide could fill the last week’s gap, created after the rollover on Jan. 26, 2024, during the next week as the formation of a bearish crossover with a downward move by the 9 DMA and 18 DMA, which have moved below the 50 DMA could result in a weekly gap down opening.
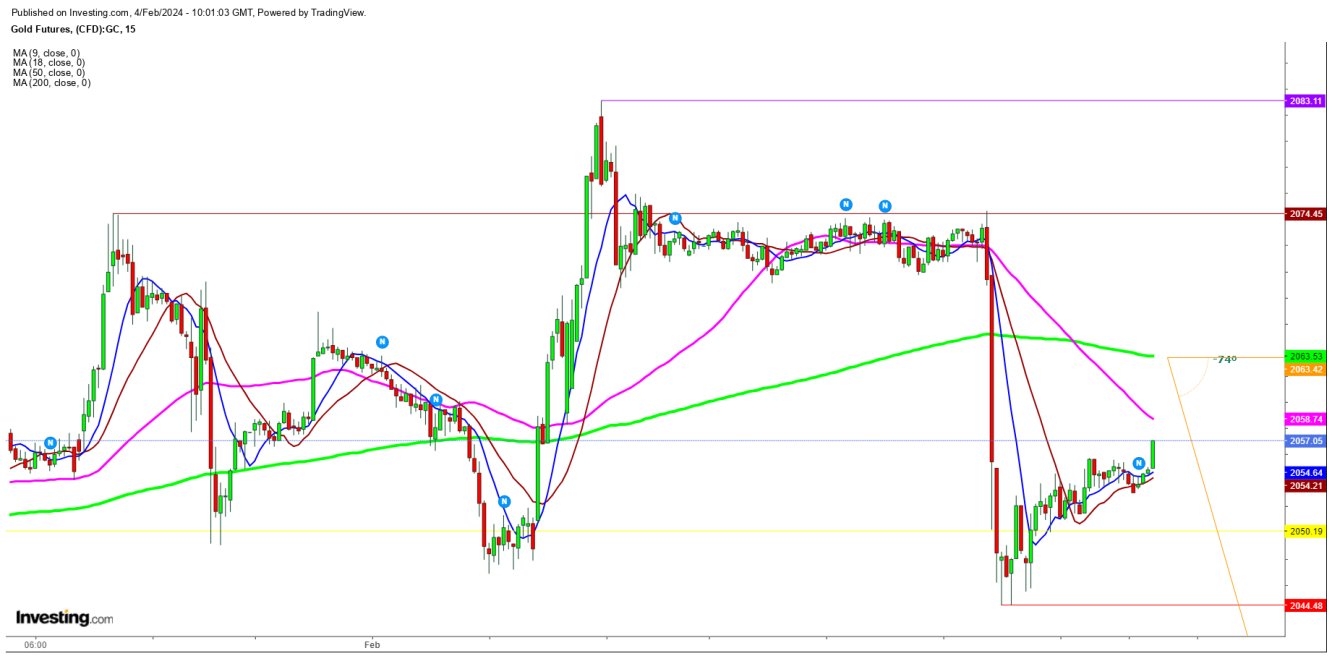
In the 15-Minutes Chart, gold futures indicate a gap-down opening on the first trading session of this week as the formation of a super bearish crossover by a downward move by the 9 DMA, 18 DMA, and the 50 DMA below the 200 DMA with weekly closing by the gold futures much below the 200 DMA.
Watch my attached video, which I uploaded on Feb. 4, 2024.
Disclaimer: The author of this analysis may or may not have any position in the Gold futures. All the Readers are requested to take any long or short trading position at their own risk.


