- Gold is breaking out to new all-time highs on very little fanfare, this is undoubtedly a bullish development.
- On the back of strong central bank demand, gold has admirably withstood the rising real yield headwind that historically would have crushed the sector.
- However, though its big move higher is seemingly on the way, a number of short to medium-term fundamental drivers should continue to put a ceiling on the gold price over the coming quarters, namely persistently positive real yields and a strong dollar.
- Indeed, with gold looking fully valued short-term and given speculative positioning is now rather stretched, a little more patience may be required for gold bulls, particularly if we don’t see rate cuts materialize as early as consensus expects.
The Fundamentals
While and precious metals remain one of my favored long-term asset classes, as I have for much of the past six months, I remain less sanguine towards the asset class over the next quarter or two. And, even though the gold price has flirted with new all time-highs of late, this thesis has more or less proved true. While I firmly believe gold’s big move is coming in the not-too-distant future, I believe this is more likely a story for the second half of 2024 than the first.
This shorter-term view is primarily based upon gold’s relationship with real yields, the , along with the notion that tight monetary policy may be with us for a little longer than the market expects.
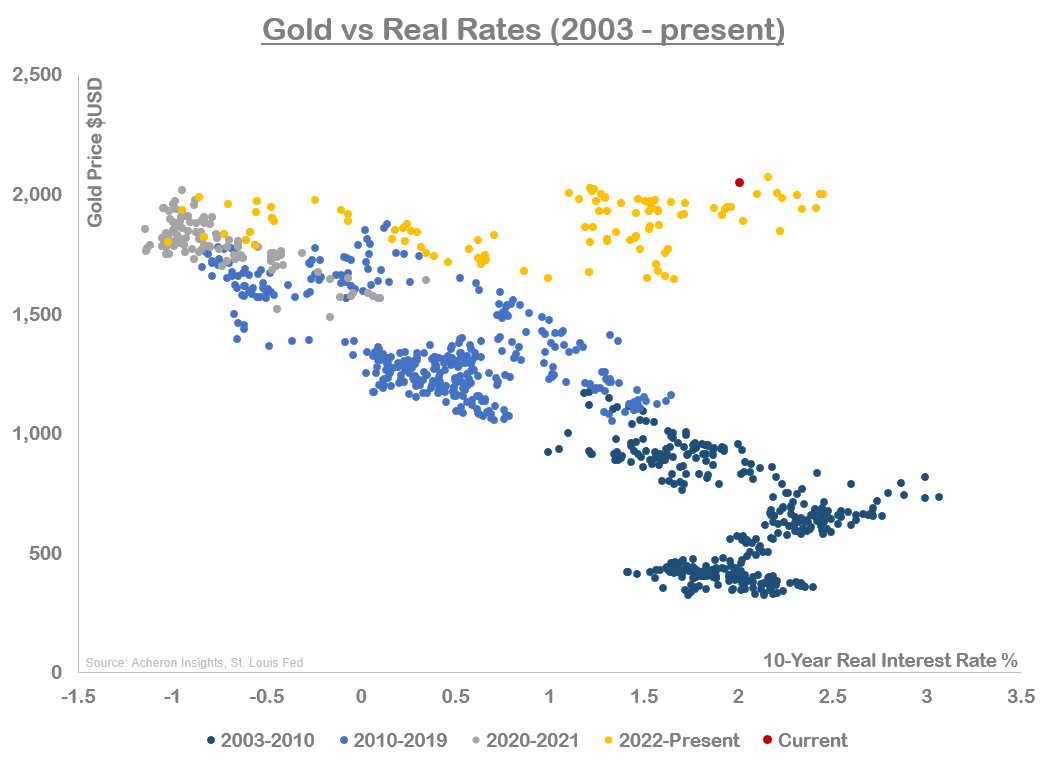
In relation to gold and real yields, while the relationship between the two has most definitely broken down over the past 24 or so months, central bank purchases of gold seem to be vastly overpowering any headwind from the multi-decade high in real yields we have seen. This speaks volumes to the powerful long-term driven of the asset class that is the diversification of FX reserves by global central banks into gold, one that I expect to continue indefinitely.
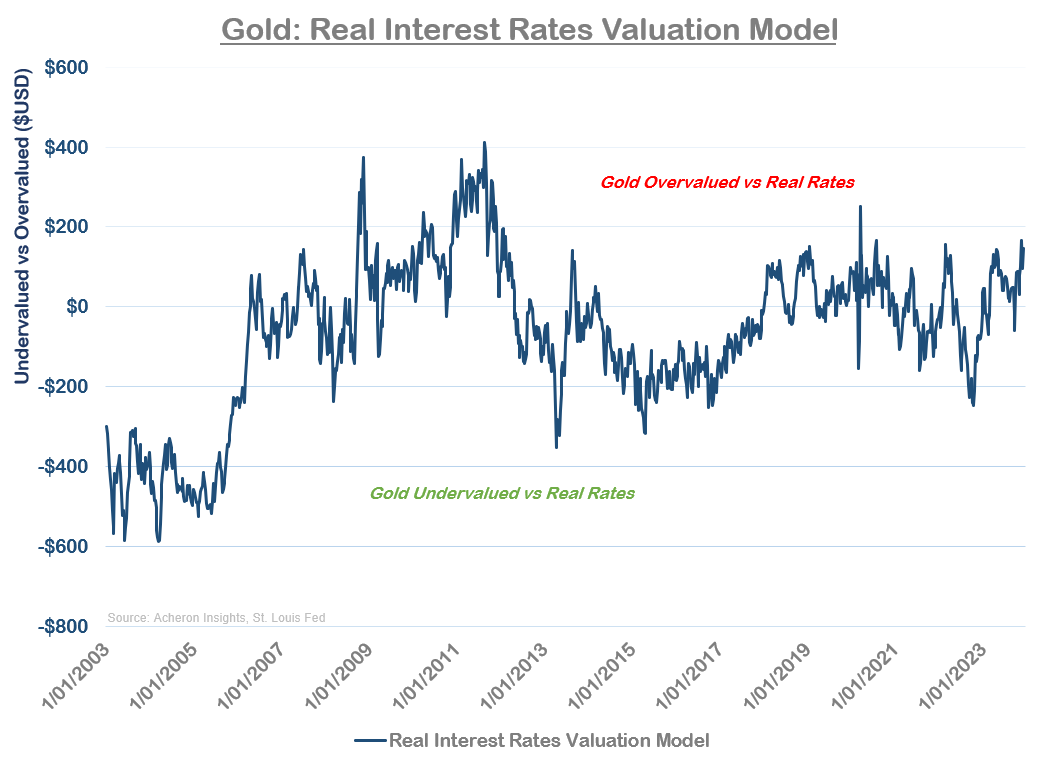
Even still, if we compare the price of gold and that implied by the relationship between gold and real yields (adjusting for the changing correlations over time), the gold price looks to be getting rather extreme relative to the latter on a short-term basis, as we can see below. Thus, to me, gold looks fairly priced in the short-term from a real yields perspective despite its changing correlation.
And although the relationship between the two is not what it was, I struggle to envision a path of a material rally in precious metals that does coincide with material move lower in real yields. After all, negative real yields are the primary driven of institutional flows into the sector, and said flows are likely to be the catalyst for the next leg higher.

For real yields to move lower and the incentive to be there for Western and institutional buyers to re-enter the market en masse, we need inflation expectations to remain stubborn and do so at a greater pace than interest rates.
And, as it stands, I continue to suspect there may be further upside for yields in 2024, and thus real yields are unlikely to move significantly lower until at least the second half of the year.
Indeed, as detailed here, I believe there to be a decent chance we do not see the rate cuts the market is hoping for until at least the second half of the year, an outcome which I suspect the precious metals market will not take kindly to, at least in the short-term.
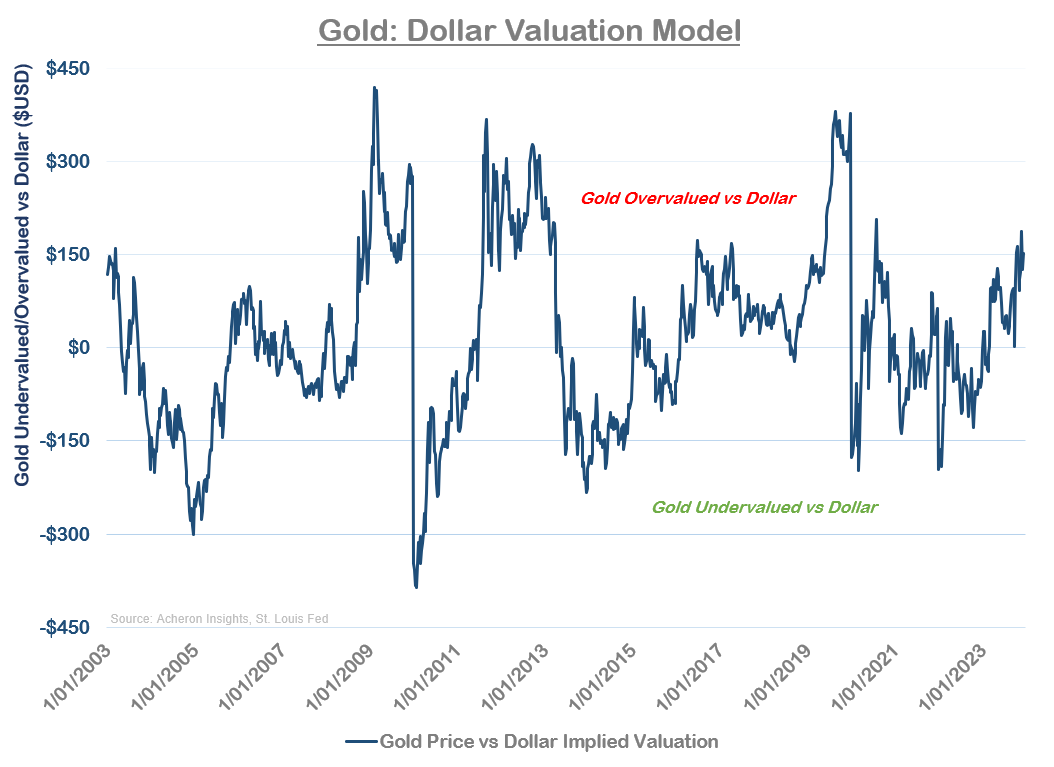
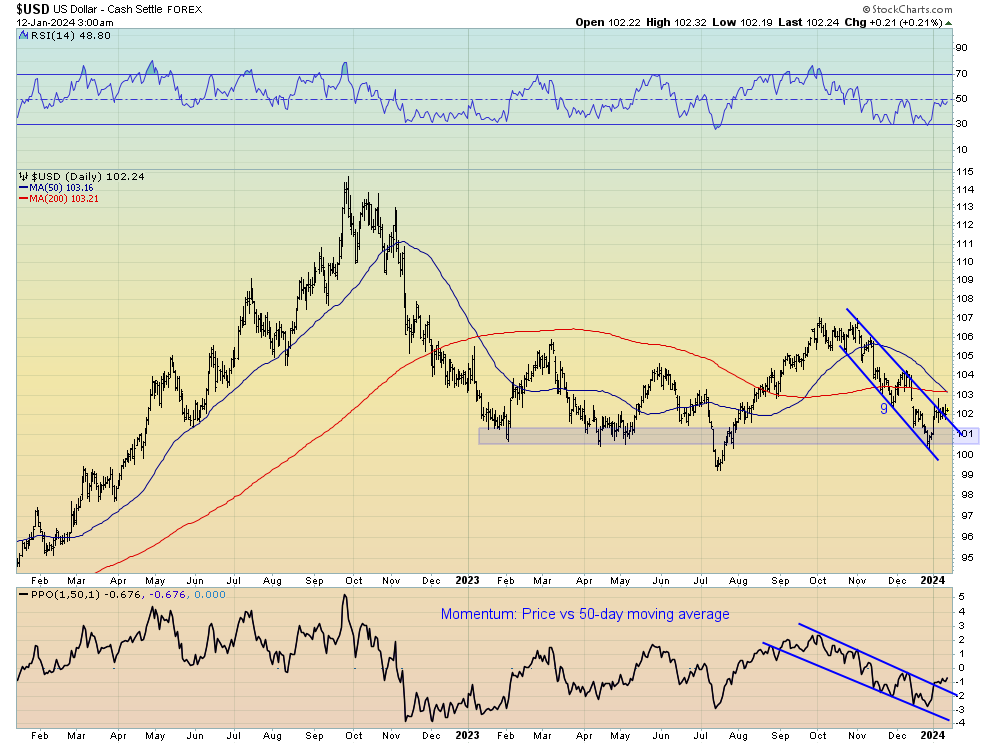
In terms of gold’s other fundamental driver, the dollar, we are also looking at a situation where gold is looking fully priced relative to the dollar on a short-term basis.
Unlike real yields, this is a correlation that has consistently been negative over time. The best bull markets in gold tend to coincide with a bear market in the dollar.
While I do believe we will see a bear market in the dollar over the next 2-5 years, for now, my gold vs dollar valuation model for gold suggests the yellow rock has gotten a little ahead of itself for the time being.
From a technical perspective, the has firm support around the $101 level, whilst it also looks to be breaking out of a bullish flag pattern.
Furthermore, given I believe we are likely to see economic weakness throughout the first half of this year, it is difficult for me to be a dollar bear in such an environment given the structural bid and demand for dollars that occur during such economic environments, so long as the dollar remains the worlds reserve currency (which it is).
Sentiment and Positioning
From a sentiment and positioning perspective, this is where things get a little more interesting. While the gold price is flirting with new all-time highs, sentiment is not.
On the whole, this is a very bullish setup. There is far more room for investors to get bullish before we reach any kind of level of extreme optimism indicative of a meaningful market top.

However, from a positioning perspective, things are in fact looking a tad more extreme.
For example, managed money long exposure in the futures market (consisting of hedge funds and CTAs) is close to levels that generally coincide with short-term tops in the market (though there remains scope for positioning to get longer from here).
The same can be said of overall speculative positioning in the futures market, as we can see below. A similar story can be gleaned from the positioning in the silver market as well.
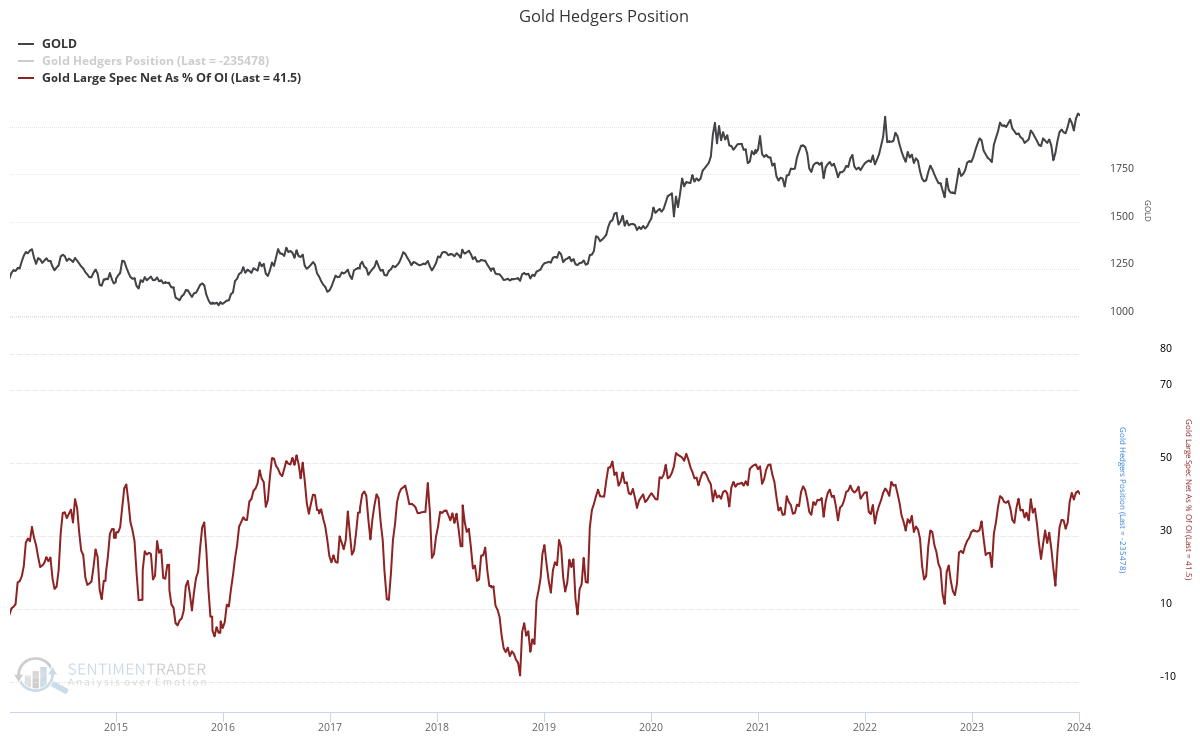
Whilst overall sentiment toward the asset class is far from overly optimistic (notable for an asset class breaking out to new all-time highs), given positioning itself is looking a little stretched, I suspect we need to see some kind of unwind in these hedge fund and CTA’s longs before we see the next big leg higher in gold.
Market Technicals
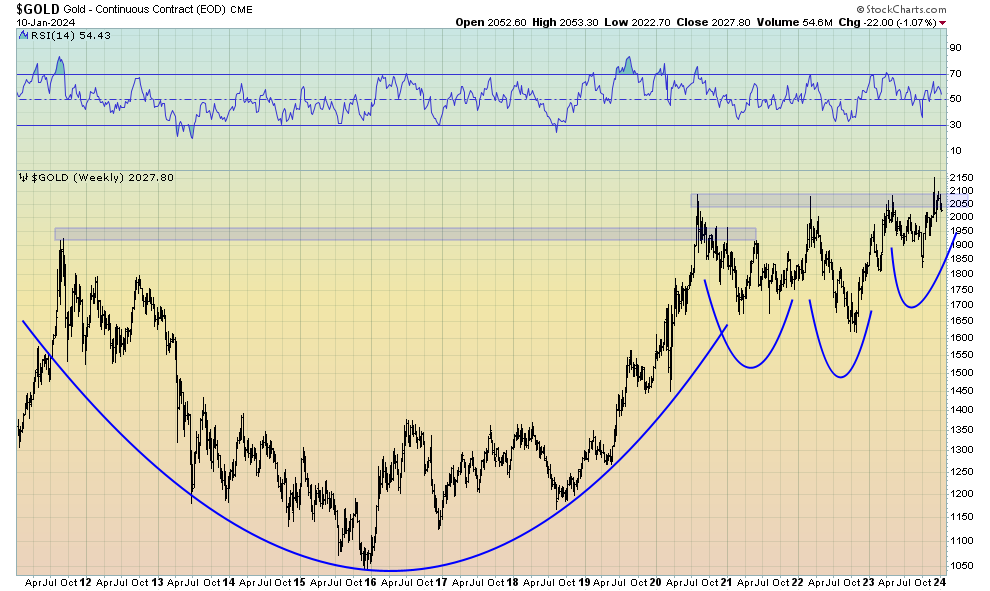
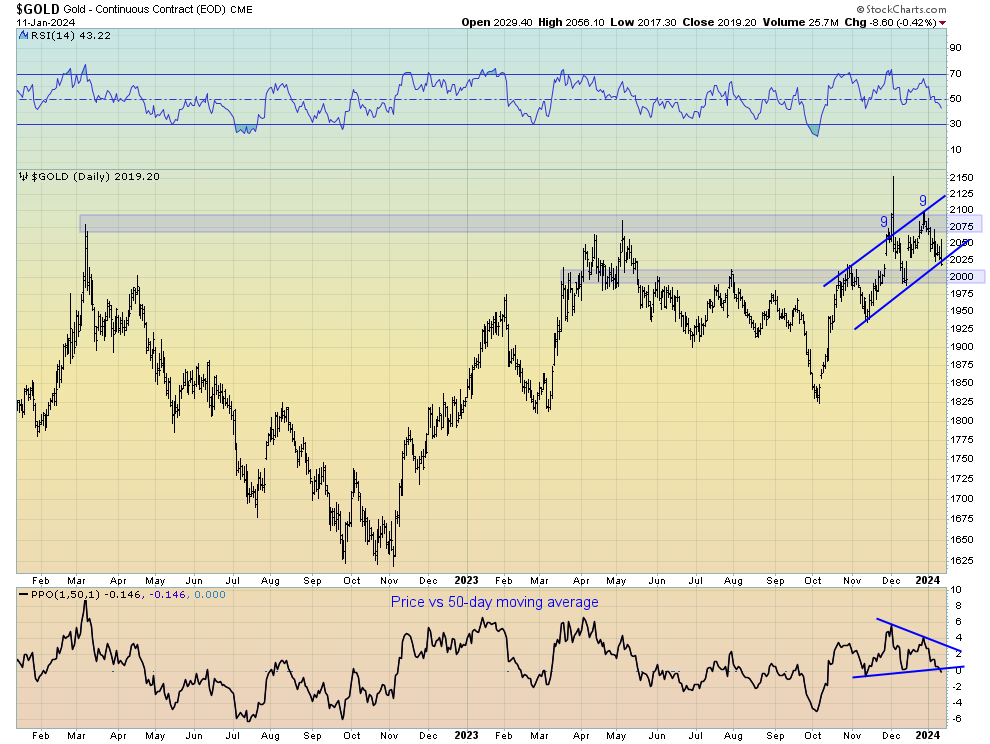
If we turn our attention now toward the technical picture, I am looking for a continued correction to at least around the $2,000 level (on the continuous futures contract), and perhaps a prolonged consolidation around this key level.
We do look to be forming some kind of a bear flag, so should this technical structure prove true, we could see a move back to the mid-$1,900 area.
In my book, any such move would be another fantastic buying opportunity. Conversely, should we make another run at $2,100 and see a clear break above, all bets are off as the sky is the limit.
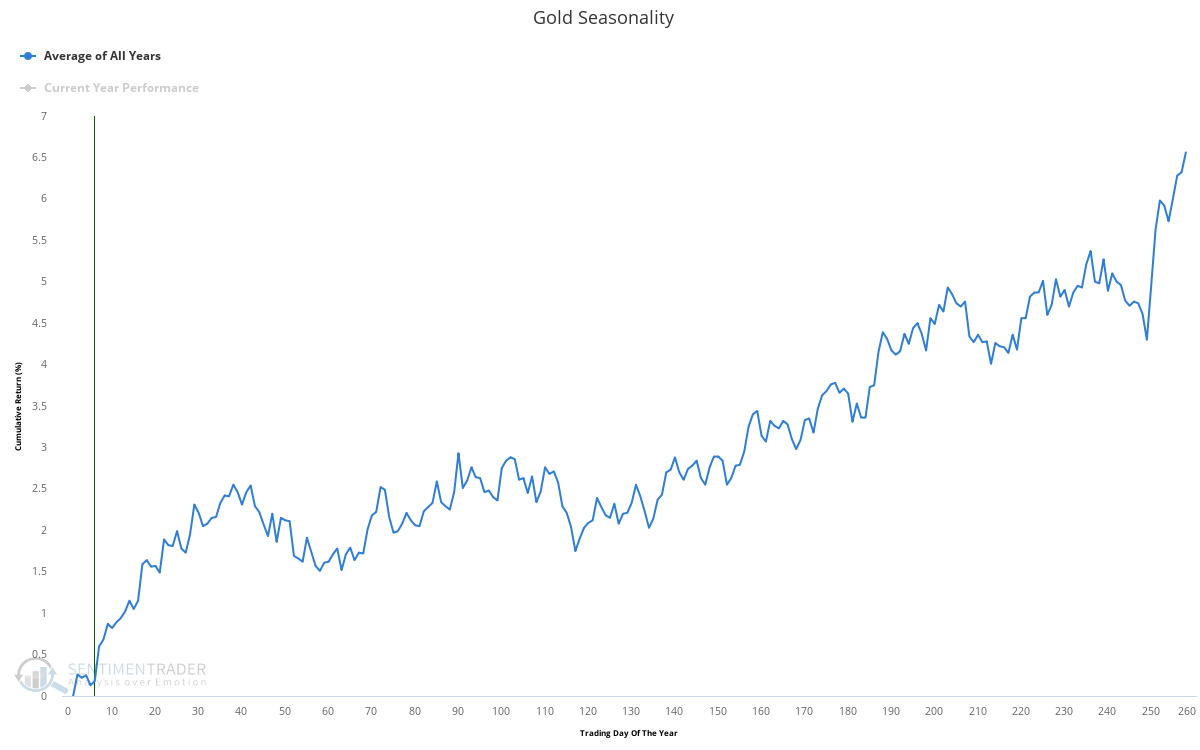
It’s also worth noting that seasonality should continue to support the gold price over the next month or two, but beyond that, quarters two and three of the year generally see volatile price action before things turn more bullish as we enter the latter stages of the year. This seems to align with my fundamental outlook for the sector this year.
Hard to Deny the Long-Term Thesis
Stepping back a bit, it’s hard to deny the structural bull case for gold.
Within an era of persistent deficit spending and mounting government debt, while foreign countries continue to be incentivized to diversify their FX reserves away from US debt and into alternatives such as gold, and are potentially on the cusp of a multi-year bear market in the dollar, these dynamics should all provide considerable support from the precious metals sector over the coming years.
It only takes one glance at the long-term chart for gold to see how this looks to be a market that badly wants to move higher. I don’t doubt it will happen, but for now, a little more patience may be required for gold bulls.
