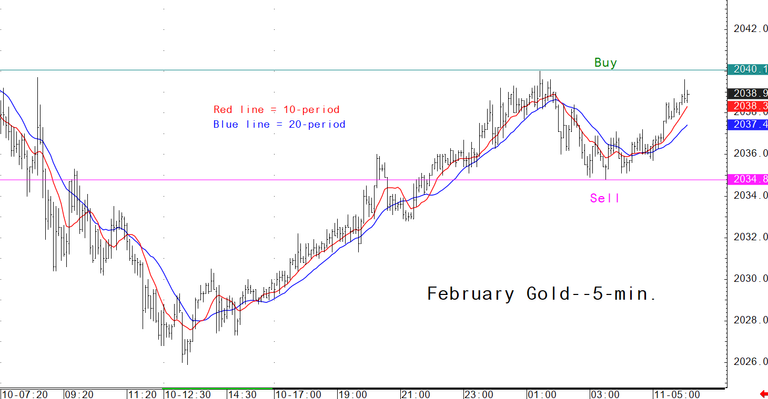
(Kitco News) – This 5-minute bar chart for Comex gold futures can be a valuable analytical and trading tool for the active intra-day gold futures trader/market watcher. The 5-minute bar chart for the active gold futures contract shows key short-term moving averages (10- and 20-period), which the trader can use for crossover buy and sell signals. Also, based on key short-term technical support and resistance levels, I show potential buy and sell price entry points. (Remember, most successful traders buy on early price strength and sell on early price weakness.) If you are an active intra-day trader of gold, you definitely want to check out this unique and exclusive daily trading/analytical tool found only at Kitco.

Disclaimer: The views expressed in this article are those of the author and may not reflect those of Kitco Metals Inc. The author has made every effort to ensure accuracy of information provided; however, neither Kitco Metals Inc. nor the author can guarantee such accuracy. This article is strictly for informational purposes only. It is not a solicitation to make any exchange in commodities, securities or other financial instruments. Kitco Metals Inc. and the author of this article do not accept culpability for losses and/ or damages arising from the use of this publication.

