
Rhona O’Connell, StoneX Financial Ltd; 10 October 2024
Any views expressed here are of the writer and do not reflect a house view from NASDAQ.
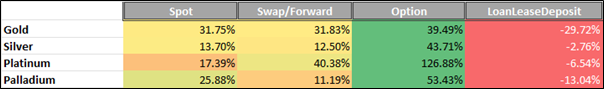
Daily September average compared with daily average for January-August 2024

Source: LBMA
Volume changes; daily average spot and forwards, September vs Jan-August
Source: LBMA
Welcome to our monthly round-up of the LBMA OTC trading volumes in gold, silver, platinum and palladium, as recorded on a daily basis by the Association. These are split into spot, swap/forward, options and LoanLeaseDeposit (LLD) and give a flavour of the markets’ activity and how they were influenced by external forces and news items.
All references to COMEX or NYMEX positioning refer to Managed Money, not commercial positions.
General introduction: –
All four metals eked out gains during September and with the exception of palladium, which underperformed – again , the rises were relatively close. Expressed in terms of the LBMA afternoon prices for gold, platinum and palladium, and the LBMA daily price for silver, silver headed the pack with a rise of 5.45%, followed by platinum at 4.79% and gold at 4.64%. Palladium trailed in with 1.84%. Palladium had the widest range, however, due to a strong (and short-lived) short-covering rally to post a range of 16.75%, with silver trading over a 15.7% span, platinum 11.3% and gold, as should be expected for a key risk-hedge, posted the narrowest range at 7.4%.
As far as gold was concerned, September was notionally all about the expectations for, and the decision from, the Fed, coupled predominantly with the increasing tension in the Middle East, leading to a series of new all-time intraday highs. Silver was largely taking its cue from gold, and, as usual, in more volatile fashion, although the anaemic economic activity in China and the parlous state of parts of Europe acted as a drag. Platinum kept its eyes on the possibility of reduced production from South Africa on the back of much reduced by-product prices, while the production cut announcement on the 12th from Sibanye-Stillwater was more significant for palladium (potential loss of 200,000 ounces per annum), as part of a restructuring towards a lower cost-base. Anglo American has started reducing its holding in Amplats. The onward march of plug-in-hybrids in light vehicles kept on making the headlines and helped sentiment in the PGM sector, along with increasingly vocal comments from the auto sector about the need for clarity over Net Zero targets and whether they will need to be changed (this, frankly, has been a clear possibility from the outset) and more than one company has changed its targets for electric vehicle production.
Economic Background
In the United States, with the Fed’s policy shift on the back of steadily eroding inflationary forces and a cooling but not imploding labour market, there was much debate about not whether the Fed would cut rates at its September meeting, but by how much. In the end the cut was 50 basis points, which did take a good part of the markets by surprise.
Key points from the meeting Statement and the dot plots for June and September are shown below to give a feel for the background. Probably the most important, if unsurprising, element was Jay Powell’s emphasis that we are not looking at a series pf 50-point cuts.
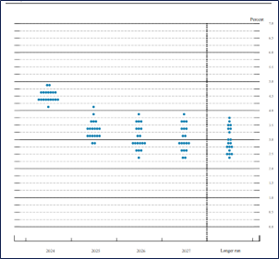
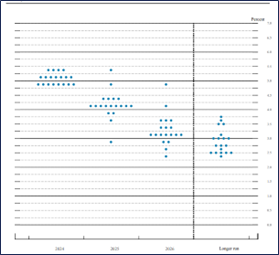
The Fed meeting was on 17th-18th September. The rate cut, as noted, was 50 basis points and the overall profile of the dot plots dropped by 70 basis points. The dot plot is the chart populated by each member of the Federal Open Market Committee (FOMC), whereby each places a dot reflecting where they expect the median fed funds target rate to be at the end of this year, next year, and the longer term. These are carried out in the March, June, September and December meetings (there are eight Fed meetings per annum).
There were two key highlights from Jay Powell’s Press conference after the meeting, i.e.:-
Question: This meeting showed the First dissent since 2005: how close was the decision?
Answer: Note that all 19 Members (he repeated this) “wrote down multiple cuts this year and that is a big change from June. Seventeen of them wrote down three or more cuts, and ten of them four or more. We have made a good strong start, reflecting their confidence that inflation is coming down”. The logic was clear both from an economic and risk-management standpoint.
Question: (from the WSJ) Is this a catch-up given recent substantial revisions to the employment numbers, or is the larger than typical cut a function of the higher nominal level of the policy rate such that an elevated cadence could be expected to continue?
Answer: “We don’t think we’re behind and we think that this is timely, but I think that you can take this as a sign of our commitment not to get behind. We’ve been very patient about reducing the policy rate and that patience has really paid dividends and allowed the strong start today. I do not think that any-one should look at this and say “this is the new pace”.”
Other key bullet points to note: –
- Economy strong overall and has made considerable progress.
- Inflation 2.25 as of August; Labour market has cooled.
- The 50-pt cut decision reflects the Committee’s growing confidence that with an “appropriate recalibration” of its policy stance; moderate growth and inflation, strength in the labour market can be maintained in the context of moderate growth and inflation moving sustainably down to 2%.
- They have also decided to continue to reduce securities holding [which gives some implied support to market bond rates in the background].
- Improving supply conditions have supported resilient demand over the past year
- Labour market conditions are now marginally less tight than pre-pandemic and it is not a source of elevated inflation [he emphasised the word “not”]
- Committee has gained greater confidence that inflation is moving sustainably towards 2%. Upside risks to inflation have diminished and downside risks to employment have increased.
The dot plots:
September
June
Meanwhile Europe continued to walk a tightrope with a growing expectation that the European Central Bank will cut rates in both October and December. European PMI numbers are still in the doldrums, and inflation rates have dropped substantially. Germany and Spain were at the fulcrum of the overall reduction, with Germany’s rate falling to 2%, a three-year low and well below the market call of 2.3%, while Spain fell from 2.9% in July to 2.4% in August. The key element in these reductions was energy, which can be notoriously volatile and this, too, points to continued ECB caution. As we should expect, views differ between members of the Governing Council, and Bundesbank President Joachim Nagel, for example, has been pointing to continued price strength in the service sector, arguing that this could keep inflation above the target level for a good while in 2025.
The Chinese Government changed course towards the end of September, announcing a broad-based stimulus package. Time will tell as to how effective this is likely to be – and it usually takes a few months before the trickle-down effect permeates the whole economy.
While the gold market carefully watches developments in the US, and the associated action in the bond and currency markets, silver and the PGMs also look to industrial activity, given the high percentage of demand that comes from industrial sectors. The state of the auto market in Europe has been a cause for concern and while the Chinese auto sector is relatively robust, the growth here is being powered by the electric vehicle fleet, in which EV sales exceeded that of gasoline vehicles in both July and August. Chinese diesel heavy-duty vehicles appear to be in a relatively strong position, which has been helping the platinum sector and China was a large importer of platinum in both July and August.
So against this continually uncertain backdrop, we return to the action in the metals markets themselves.
GOLD –over-extended by month-end, needing to correct
Overall volumes and spot price, September

Source: LBMA
- September posted very healthy volumes in all sectors except LLD. Compared with the January-August daily average, spot was up 32%, as were swaps and forwards while options jumped by 39%.
- The options’ three heaviest days were in mid-month (two) and then in the final week (one).
- In turn these were when gold was testing $2,600, then dropping to $2,550 and finally when testing $2,600, which points to activity at these strike levels.
- The tone in the market suggests that out of the money calls may have been popular also.
- While LLD was well down on the rest of the year, within September itself the start and middle of the month were really quiet; in the early part it looks as if there was some hedging on the way up towards $2,550, after spending three weeks in the $2,500-2,550 range (which lack of volatility also talks to higher options volumes). Then business was livelier when gold was at its record high levels (intraday was $2,686, 26th September).
- Swaps and forwards were sporadic. A heavy day as gold pushed through resistance at $2,500, then volumes ebbed; picking up again on the first run up to $2,600. The second half of the month was busier than the first, suggesting that some participants were locking in at the higher levels.
- The spot market only really sprang to life in the second half of September, during which there were three days when volumes topped 40 million ounces (1,244t) and the 1,274t of 24th September was a seven-week high.
- This, and the two subsequent very busy days, was when gold was aiming for, but failing at, $2,700 (market looking for more easing from the FOMC and waiting for the nonfarm payroll number); and some of the speculative froth started to be blown off – something that, by that stage, the market badly needed.
Gold technical pattern; one-year view
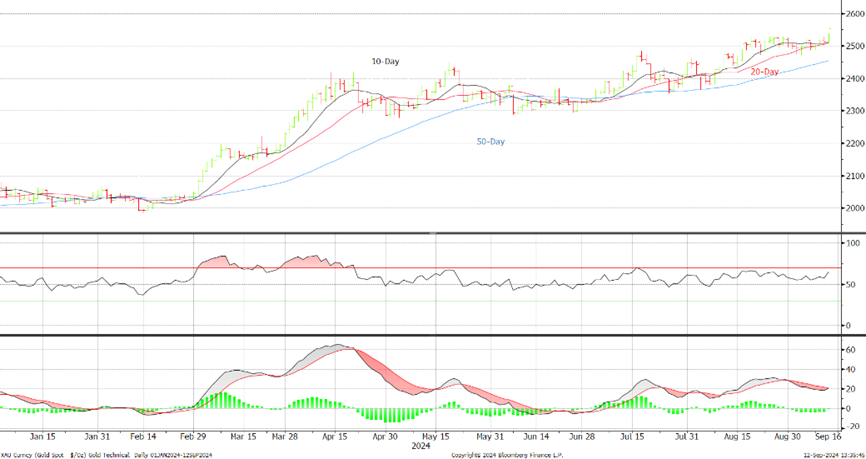
Source: Bloomberg, StoneX
ETFs: steady; 12 days of net creation from a total of 21 trading days; net gain of 18t for a year-to-date loss of 426
CFTC: fresh longs and fresh shorts. Longs peaked on 24th at 798t by which stage COMEX was way too top-heavy. Shorts were high by that stage also, reflecting the market’s growing caution. End-month; longs at 771t and shorts at 104t
Gold in local currencies, year-to-date
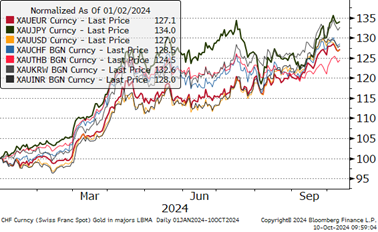
Source: Bloomberg, StoneX
SILVER; over-heated and riding for an early October fall
- Silver’s price path closely mirrored that of gold during September, but as usual it was a lot more volatile, particularly to the downside when momentum failed and profit taking set in
- Even so, by month-end it was trading at $32.7, the highest level since January 2013
- Volumes were up (apart from LLD), but nowhere near as much as gold in proportional terms
- Spot was up 14%, swaps/forwards 13%, options a massive 44%; LLD was down 3%.
- Options had a massive day at month-end when silver was turning down after hitting that multi-year high, suggesting that there may have been some call writing going on given that premia would have been high after that volatility and siler does have a remarkable tendency to stoke up lively expectations, only to dash them and there are clever traders out there who would have known as much
- The peak in an otherwise disappointing LLD market was on the 18th and 19th, when the market was still rallying but then staging a correction towards $30, which also suggests that some base metal miners may have been locking in by-product credits
- Swaps and forwards were varied across the month, with the first volume surge coming when the price had, in the first week, slipped towards $28. All the other elements were quiet at this point so this looks like industrial activity, possibly bargain hunting.
- The busiest day was also on the 19th (as it was in spot), when after correcting lower it picked up again in the wake of the FOMC rate cut and embarked on its challenge of $33.
- And spot: also busier in the second half of September in what looks like lively two-way activity. The heaviest day was when silver first cleared $32, which would tend to confirm that theory.
Total silver volumes, September, M ounces

Source: LBMA
ETFs; evenly mixed with 11 days of net creation for a gain of 201t; year-to-date gain of 683t.
CFTC: longs expanding up to 24th, with shorts swinging but ending the month at 2,375t, a gain of 862t. Longs closed the month at 8,457, 22% above the 12-month moving average – so also top heavy but not as much as gold
Silver, gold and copper; the correlations and the gold:silver ratio, January 2020-to-date
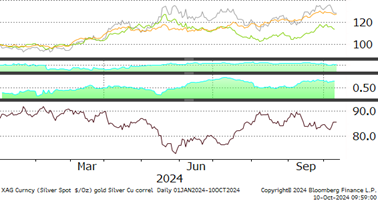
Source: Bloomberg, StoneX
Gold:silver ratio averaged 86.0 in January to July but in August it was 87.0.
Silver’s correlation with gold averaged 0.78 in January to July but in August it was 0.85.
Silver’s correlation with copper was 0.51 in January to July and 0.52 in July.
PLATINUM – flattering to deceive?
Total platinum volumes, September, 000 ounces

Source: LBMA
- Broadly following gold’s overall pattern, peaking on 26th although the correction into October was a lot deeper than that of gold
- Spot activity was 17% higher than the January-August average, with the heaviest volumes in the first week as bargain hunting developed towards $900 after the decline in late August; this was followed by heavy short-covering
- Swaps and forwards were also busy early in the month, suggesting industrial interest, and remained busy all the way up through $980
- By this stage options activity was building substantially, suggesting business at the $1,000 strike and continued into the correction from a peak of $1,007
- Borrowing developed into the correction, potentially indicating the replacement of in-process material in the industrial (non-auto) sector.
- The rest of the month was quiet apart from one day of heavy options activity as the price recovered to the month’s high of $1,020.
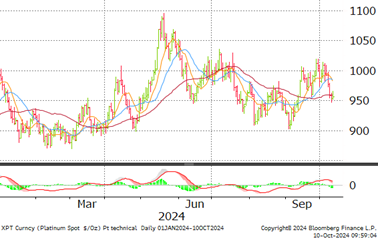
Platinum technical pattern, one-year view
ETFs: still nervous; just six days of net creations; monthly loss of 4.3t to 96.6t and year-to-date gain of 1.9t
CFTC: longs worked gradually higher then added sizeable tonnage in the final week on bargain -hunting into the correction. Sizeable short covering in mid-month after the Sibanye announcement. While this is much more important for palladium, it nonetheless focused the markets’ minds on the PGM fundamentals overall.
Platinum, palladium and the ratio, January 2016 to date,
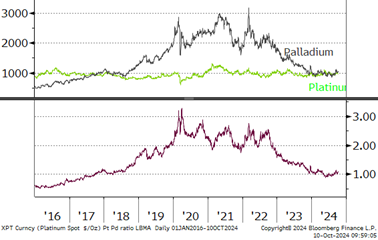
Source: Bloomberg, StoneX
PALLADIUM – continued short-covering and some fresh buying, but selling persists into any rallies
Palladium spot volumes, September, 000 ounces

Source: LBMA
- Heavy spot volumes in the first half of September with long liquidation down towards $900 followed by fresh bargain hunting in the second week.
- Business also picked up in the LLD sector, possibly suggesting some hedge lifting.
- Following the Sibanye restructuring announcement short covering developed and was reflected in the swaps/forward markets and fuelled the sharp rally from $910 to $1,120 in mid-month.
- The reversal was accompanied by fresh activity in the forwards, which continued right through to month-end, where prices closed at $1,003, while spot options and LLD business faded.
- The end of the month saw a sharp pick-up in both spot and LLD, suggesting further selling, presaging a gradual recovery in early October
Palladium technical pattern, year-to-date
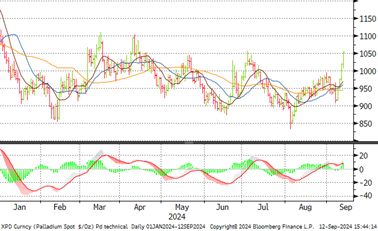
ETFs: only two days of net creations for a net loss of 1.1t, year to date gain of 3.6t
CFTC: fresh long positions in the first half during the rally and into the correction. Shorts contract from 55t to 31t in mid-month then reappear to finish at 35t.
Spot platinum, palladium and the spread, January 2016 to date
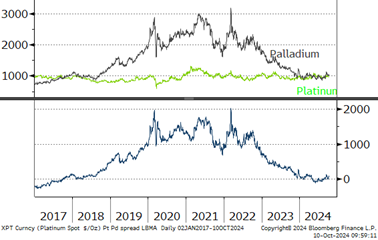
Source: Bloomberg, StoneX