
By Rhona O’Connell, StoneX Financial
Any views expressed here are of the writer and do not reflect a house view from Nasdaq.
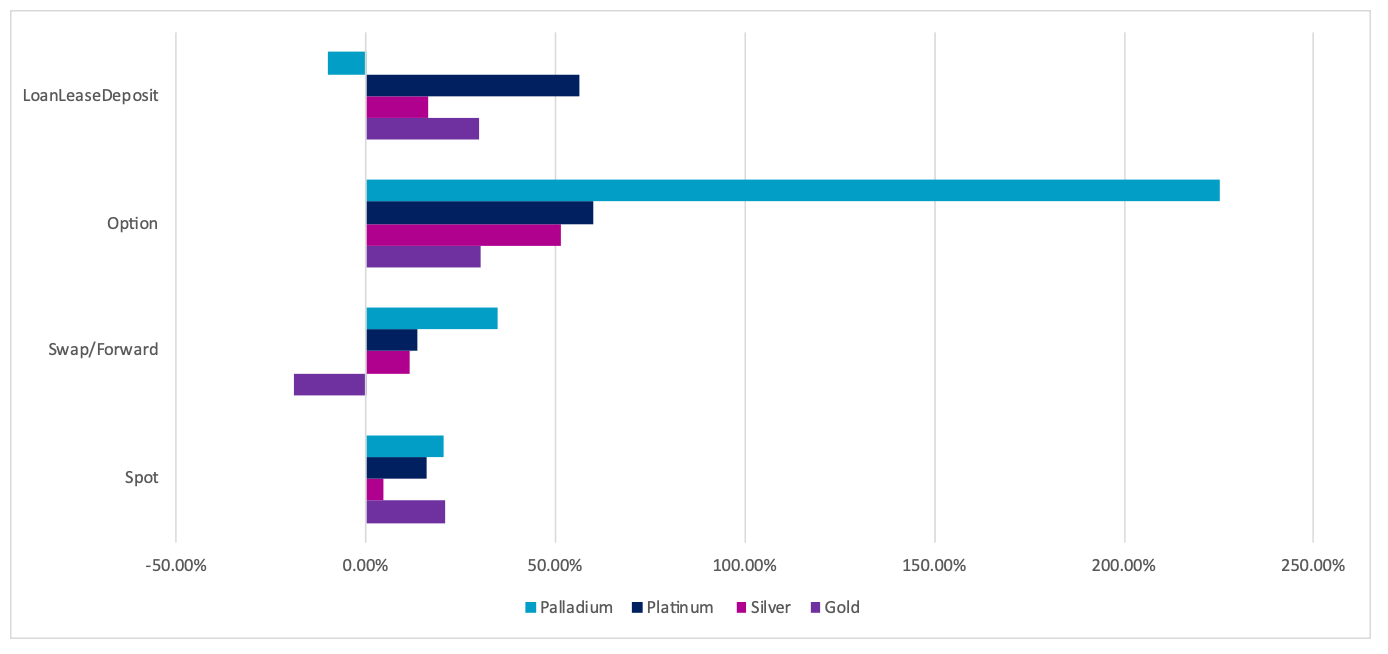
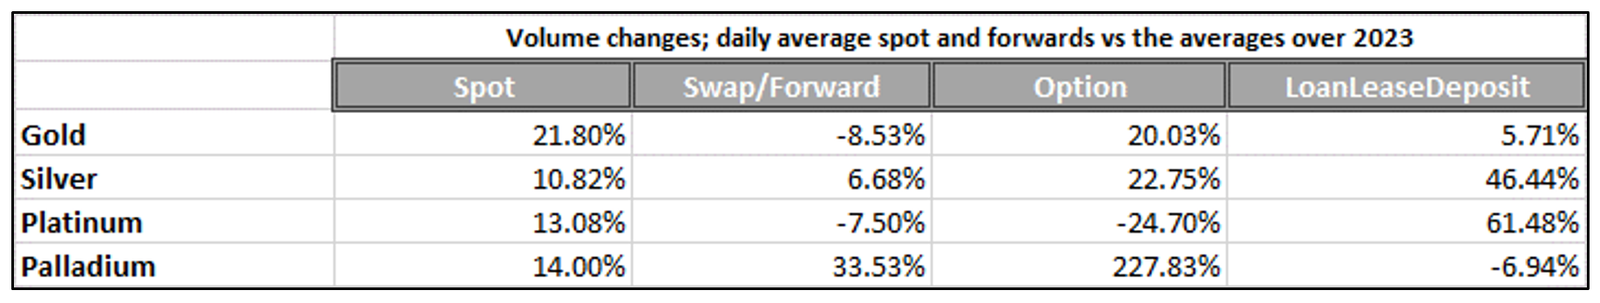
Daily April average compared with daily average for 2023
Source: LBMA
Source: LBMA
Welcome to our monthly round-up of the LBMA OTC trading volumes in gold, silver, platinum and palladium, as recorded on a daily basis by the Association. These are split into spot, swap/forward, options and LoanLeaseDeposit (LLD) and give a flavour of the markets’ activity and how they were influenced by external forces and news items.
All references to COMEX or NYMEX positioning refer to Managed Money, not commercial positions.
General introduction:
After the lively activity in March, precious metals trading volumes were variable month-on-month. Compared with March, gold spot volumes were essentially flat and swap/forwards were down 12%, while options and LLD were higher; silver spot and LLD were down while swap/forwards were better and options volume jumped. Platinum volumes were up everywhere except options, while palladium posted further gains in spot and forwards, with minor retreats in the other two sectors.
GOLD
Gold had rallied by 9.9% in March, spending the latter part of the month in consolidation phase. April saw a fresh surge forward, gaining another 8.5% from the opening level of $2,242 to the intraday high of $2,432. By this stage the market was well overbought and needed to correct; a gentle decline ensued with the month closing at $2,286, a net gain of just $44 as the froth came off. Volumes were generally higher in the continued bull run in the first couple of weeks, while the decline was in lower volume.
The highest volume in spot was on 12th April (the day that prices touched their peak and traded a range of $98 or 4%), at 37M ounces (1,155t), 39% higher than the average for the rest of the month. Second highest, as is so often the case, was when the retreat was unwinding and heralding a small correction. This was on the 23rd, when prices tested, and found support at, $2,300.
Much of the early rise was a continuation of the activity in March, with fresh market participants arriving – for the long haul, by the look of it -as the new paradigm established itself. The medium-term ceiling of $2,000-$2,100 is now a floor and the growing perception of persistent geopolitical issues was also supportive, combined with more and more references to the strength of official sector interest. The World Gold Council’s “Gold Demand Trends” quarterly publication, published at the end of April, estimated Official Sector net purchases of 290t in the first quarter, which, while not a record, is the fourth highest since the start of 2010, with the record level posted in Q3 2022 at 459t.
Official sector activity is important in two respects; not just the tonnage, which at these levels was clearly important in putting a floor under the gold price, but also, in this instance, strong purchases send an important psychological message to the markets in that it reflects the heightened perceived need to manage risk, as well as a subsidiary effort in some cases to diversify away from dollar-exposure.
Background economic developments that helped to inform the trends in the price included, in the bullish first half of the month:-
- initially, Fed Chair Powell forecasting cuts in interest rates “at some point this year” – although different FOMC members expressed varying views over the month – the one constant was the need for more data to determine price and labour trends.
- Intensifying tension in the Middle East also contributed. Indeed, gold’s peak was printed as the markets responded to the possibility of an Iranian strike on Israel.
And in the retreat of the second half;
- these included the mild easing in tension in the Middle East – or at least, the lack of escalation;
- and on the economic front, the US Core Personal Consumption Expenditure Index (a key parameter in guiding the Fed’s intentions) was above expectations at 2.8%, which again raised debate about whether the Fed would in fact cut rates this year.
Essentially the latter part of April and into early May was a period of consolidation.
Swaps and forward volumes were down 11% against March, and were active at the start and the end of the month. In the early rally, volumes picked up as prices approached psychological “round” numbers; while towards month-end the increase in volume may have been encouraged by deteriorating technicals, especially as the 10-Day moving average crossed below the 20-day. Options peaked on the same day as spot volumes, as the $2,400 level was crossed on the way up and then on the way back down again; volumes dwindled with a small revival as prices tested $2,300 later in the month. The LLD sector was 23% higher in average volume than in March, with the highest volumes again concentrated around the key levels of Big Figure change.
GOLD Total gold volumes, April, M ounces

Source: LBMA
Gold in key local currencies, January 2024 to date
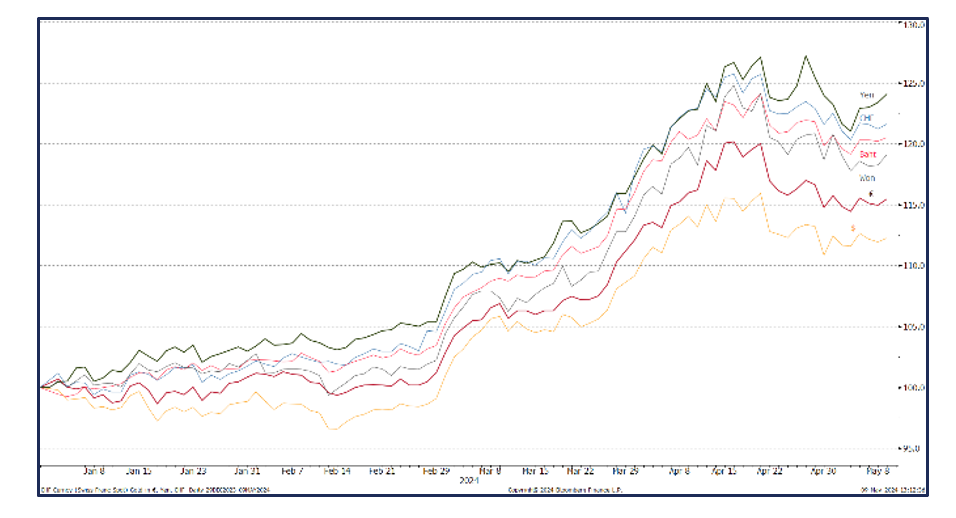
Source: Bloomberg, StoneX
Meanwhile the Exchange Traded Products were still experiencing scattered liquidation, and lost 35t over the month to 3,080t with $229Bn in Assets Under Management. Once again, Asia funds took off and added 19t in April, a gain of 13%; the ETFs have been capturing attention in China in particular and the scope for further growth in this region is tremendous, given that they currently stand at 167t, compared with 1,575t in North America and 1,279t in Europe. In April North American funds added just 1.1t net, while Europe continued to divest, with a reduction of 52t or 3.9% of holdings.
World mine production is roughly 3,650t. The net change over the first four months was a drop of 146t, with 67t (4.1%) and 106t (7.7%) from Europe, while Asia took in 29t (21%) and a minor loss of 1.5t (2.5%) from elsewhere.
The Money Managers’ activity on COMEX saw outright longs oscillating, but ultimately posting a net loss of just 3t to 535t; while outright shorts expanded from 102t to 115t . At the close of business on 30th April, therefore, the outright long was 121t or 29% over the twelve month average of 414t, pointing up the possibility of sizeable liquidation should the surrounding financial and geopolitical environment change substantially – which looks unlikely.
SILVER
Total silver volumes, April, M ounces
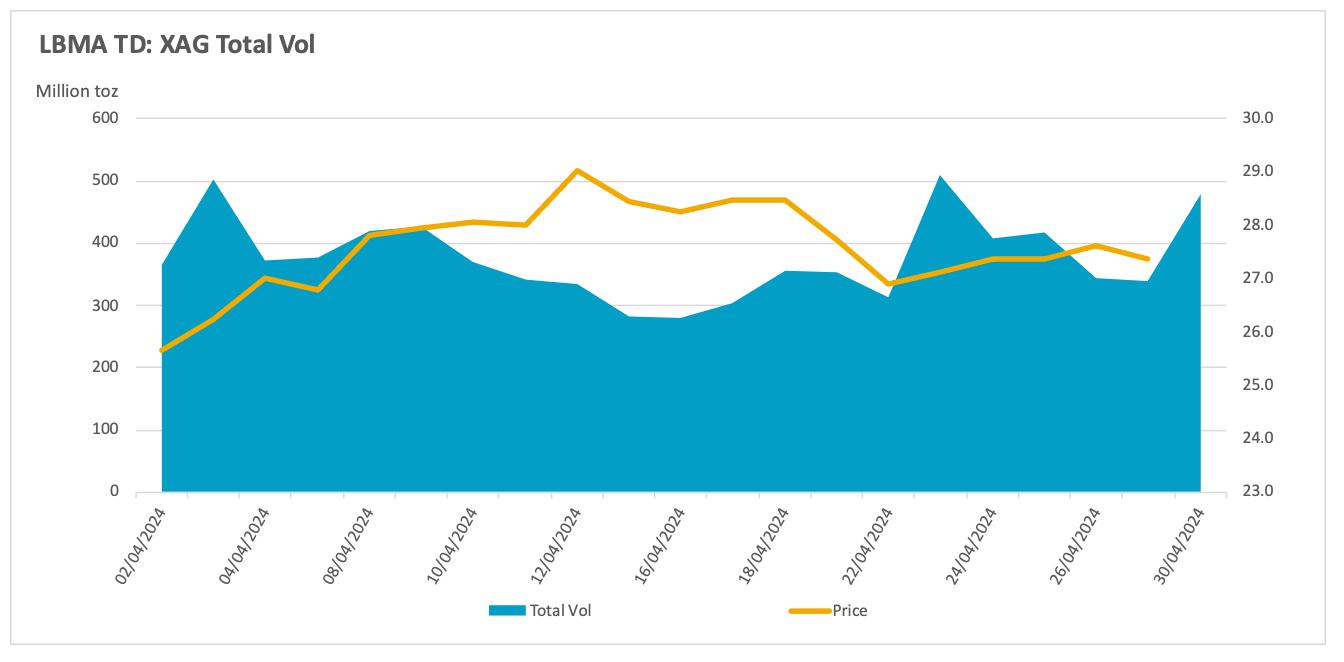
Source: LBMA
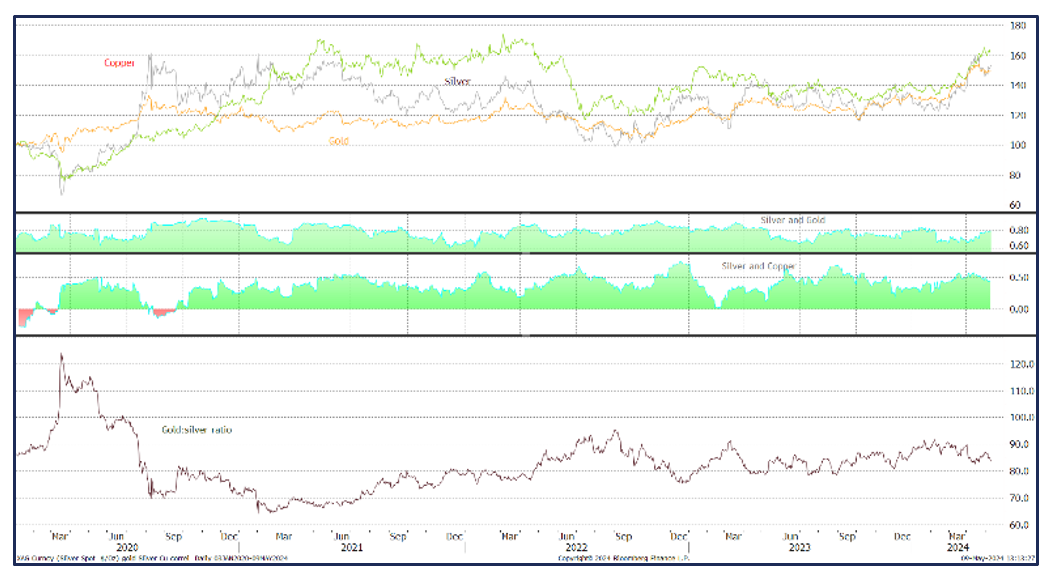
While spot gold traded in an 8.5% range in April, silver’s range was a hefty 22% as this skittish metal caught fire in the first half of April, with the gold:silver ratio dropping from 90 at the outset to 83 in mid-month. We have noted several times before that silver’s history of volatility can become self-fulfilling and that typically a solid gold move (in either direction) will be eclipsed by silver, usually with a beta of between 2.0 and 2.5. This time that beta was 2.6., so silver was behaving according to type, running up from $25.0 to approach $30.0 before failing and going sharply into reverse on 12th April, the same day as gold’s peak and reversal. The speed of the move was also enhanced by the fact that at the end of March, the 50-day moving average had crossed above the 200-day in the classic “Golden Cross”, which is often regarded as a key technical indicator.
That Golden Cross was almost certainly one of the triggers for the high speed move. The bull run to test $30 posted daily average volumes of 277M ounces (8,600t), some 20% higher than that of the retreat thereafter. In the Options sector, activity was lively on the way up, most notably on the approach to $26, but fell away thereafter (part of this would have been due to the higher volatility boosting premia) and the only day of lively action towards end-month was on the 23rd. This was the day that (temporarily at least) arrested the decline in price, and during which silver traded on either side of $27, suggesting that this strike was in play.
Swaps/forwards and LLD were quiet in the first half of the month but were more active as prices went into retreat, suggesting that some mining companies (base metals with silver by-product credits as well as primary silver miners, in all probability), were locking in these elevated prices , in case that, as is so often the case, this silver rally turned out to be a flash in the pan.
When gold is not showing much of a trend in either direction silver tends to turn to is industrial side (60% of global non-investment fabrication demand is for the industrial sector), in which case its primary influence can be copper, as the bellwether of the industrial metals. Gold’s assertion of its influence in March took silver’s attention away from copper, which had been the primary influence in February, and silver’s correlation with copper drifted lower throughout most of April, ending at 0.49, having been 0.56 early in the month.
Silver, gold and copper; the correlations and the gold:silver ratio, January 2020-to-date
Source: Bloomberg, StoneX
In the background, however, physical demand for silver bar and coin was plummeting, with many silver coins trading at a discount to spot as demand evaporated. In the Exchange Traded Products the picture was more complex, with some chunky buying at the start of the month no doubt helping to propel the move higher (ETPs can just as easily be price-markets as price takers when they move in sufficient volumes).This only lasted for a few days, however and was followed by an extended period of net redemptions, albeit on a relatively small scale. Over the month as a whole the net change was minimal, a drop of just 35t or just 1.3% of the end-March total.
The influence of the Exchanges was clear during April also. In the first two weeks, outright longs expanded on COMEX and shorts contracted; this position then reversed under long-side profit taking and fresh shorts. Net change; a 3.5% (325t) fall in longs and a 11% (419t) fall in shorts, to 8,977t and 3,530t respectively. Here, too, we are left with a heavy speculative overhang that is 43% higher than the twelve-month average and against annual mine supply of almost 26,000tpa.
PLATINUM
The fundamentals of platinum’s supply-side remain under pressure from the sharp falls in, and the dreary outlook for, palladium and rhodium prices as well as nickel price falls. To date, the vast majority of operations have been able to maintain production levels although there are plans for restructuring that will involve reductions in the workforce as the miners strive to bolster their balance sheets, and there is a risk of production cuts further down the line.
There is a bright spot, however. Load shedding in South Africa has been suspended since early April, remains suspended until further notice and there are suggestions that by 2025 it will be a thing of the past. Eskom released a statement in early May that the past few weeks have seen a “consistent and significant improvement in curbing unplanned outages”. While this is strictly news for the May edition of these notes, it is pertinent and worth highlighting here.
If this improved performance can be sustained then it is possible that we may start to see the work-in-progress backlog of untreated material come into the markets before year-end. We expect both platinum and palladium to post small deficits this year and next, but the outlook for platinum remains brighter than that of palladium.
Total platinum volumes, April, 000 ounces
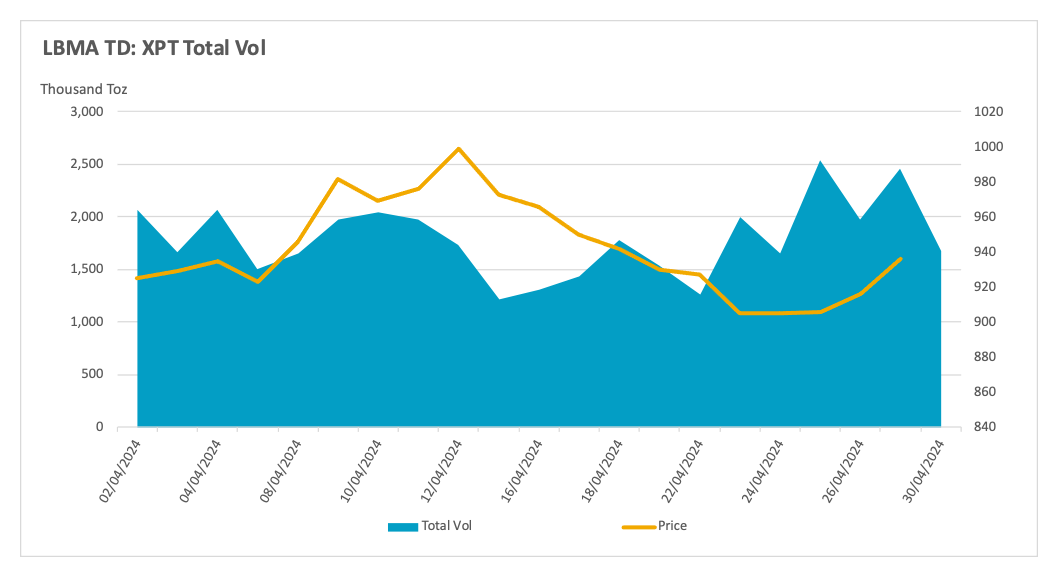
Source: LBMA
Meanwhile platinum’s price action in April was very similar to that of gold and silver, with a first-half rally of 11% from $914 to $1,007, partly in response to the moves in gold and silver, posting the highest point since late December. Early spot volumes were heavy, bolstered not only by the moves in the other metals, but also because the $890- 900 band had provided reliable support under heavy test across the second half of March and there was anecdotal evidence of industrial buying.
On 4th April, as spot prices moved up to test the $940 level, volumes picked up in the LLD sector. This, given that this price had offered continued resistance in March, suggests that there was some hedging activity developing on the basis that further upside might prove limited. In the event, this turned out not to be the case.
The big rally; technical not fundamental
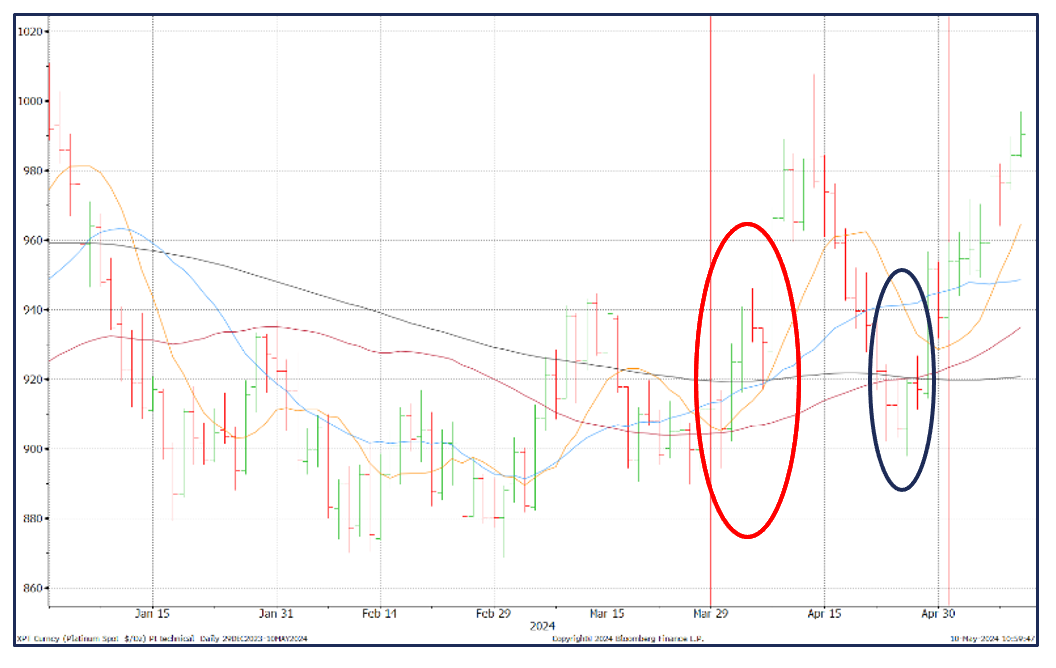
Source: Bloomberg, StoneX
There was a massive rally on 8th April, from $923 to $969, which wasn’t driven by market fundamentals, but by technical considerations. Volumes were low, which is not unusual in a wide swing as thin markets can generate large moves. This, however, is instructive, because the move was triggered by an unusual technical development, with the 20-day moving average crossing the 200D to the upside and at the same time the ten-day crossed above both of them. The fact that the spot volume on that day was low suggest that technical traders had not been paying much attention to platinum.
At this point, and for more than a week thereafter as prices ran up to the month’s peak and for a few days thereafter, the options market was busy. The price action suggests that both the $1,000 and $900 strikes were in play.
After a lull in business across the board, activity perked up again in the final few days as, having again found support at $900, platinum turned up. Boosted this time by the Golden Cross of the 50-day moving average crossing above the 200-day, platinum staged a final push towards $960 at month-end, crossing above all the key moving averages in one day and setting the scene for a buoyant start to May, in which platinum moved above palladium for the first time since April 2018.
Spot platinum, palladium and the spread, January 2016 to date
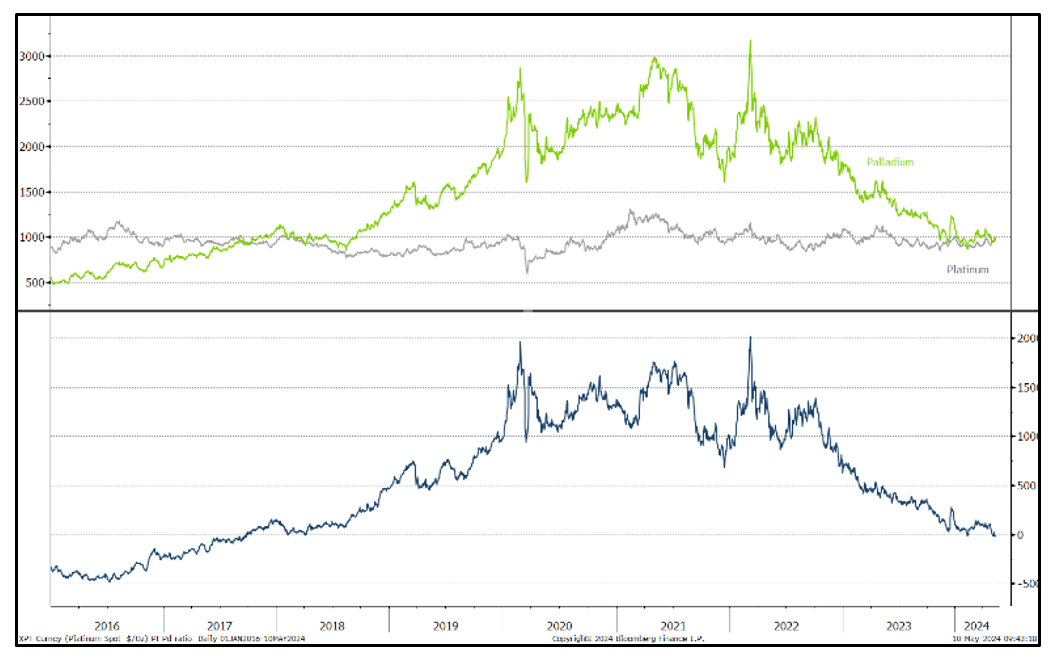
Source: Bloomberg, StoneX
Exchange-Traded Products started showing signs of renewed investor interest. Of a total of 22 trading days, 13 posted net creations. In keeping with the price action the buying came at the start and the end of the month, with light selling in-between. The net addition was 5.7t (6%) to a total of 98.4t and an increase of 6.7t year-to-date compared with world refined production of 224t.
On NYMEX, activity was mixed. Fresh interest was evident here, too, with outright longs expanding from 43.9t in late March to reach 62.0t by 16th April; by this stage the price had reversed and profit taking set in on the Exchange, with the longs finishing April at 43.6t, almost back to where they had started. In parallel, short positions contracted until the same date and then rose from 46.2t to 56.3t in one week, but not adding much thereafter – and potentially setting the scene for short-covering in May as prices took off again.
PALLADIUM
As we noted last month, palladium remains under a cloud and is likely to do so for the foreseeable future, although the slowing in EV inroads into the ICE sector, in favour of hybrids, which include internal combustion engines, gives palladium some relief in the short term.
Against that background, palladium traced a broadly similar path to the other three metals, rallying and then correcting; there was a slight difference, however, in that while the other metals bounced before month-end, palladium continued to ease until early May before picking up thereafter. Spot activity was up by 5.6% against March, while swaps/forwards were virtually unchanged, options were off marginally and LLD down by 3.2%.
Palladium spot volumes, April, 000 ounces
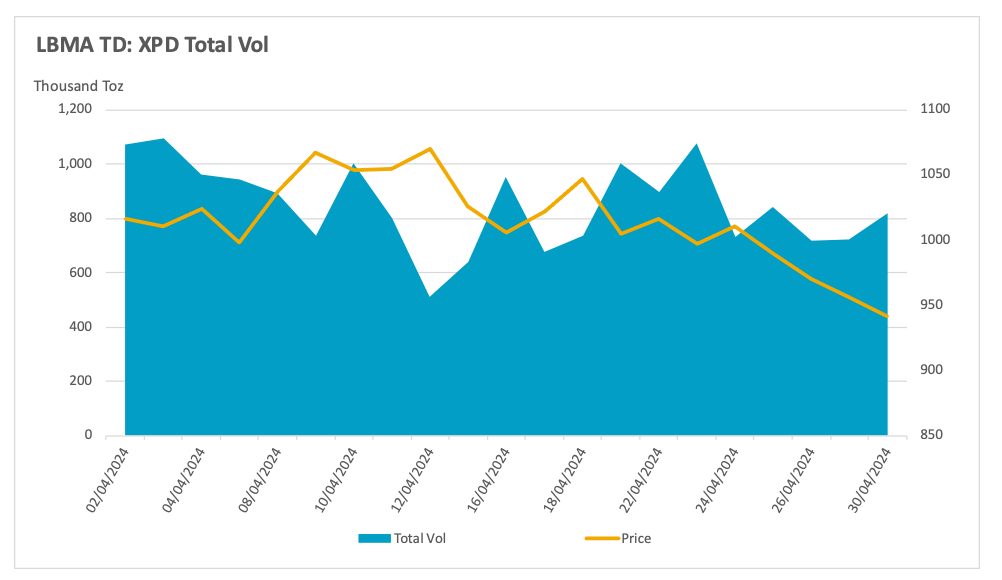
Source: LBMA
The start of the month saw heavy volumes in spot as bulls and bears wrestled between them and prices held in a tight range between $996 and $1,030; eventually the bulls got the upper hand, aided by support from the 20-Day moving average. Option volume was high at this point also, suggesting call activity at $1,000 and upwards, the hedging against which would have helped to propel prices higher in the following days.
In common with platinum, palladium rallied sharply on 8th April. Unlike platinum, however, this was not driven by technical factors but it is possible that the lively activity in swaps/forwards the previous day , which was a “down-day”, may have kept prices under some pressure at that point and as this activity came to a close the rally may have been partly a ”relief” response. Background news of reasonably good auto sales in a number of countries in March may have helped both platinum and palladium, given also the slowing encroachment of electric vehicles, but it is more likely that palladium rallied under platinum’s influence. It kept up the momentum the following day to challenge $1,100, a 10% gain in two days. Volumes declined in spot, swaps/forwards and options at this point, but a smart pick-up in LLD suggests some hedging – either from the supply side or inventory management.
It was downhill from then on, with volumes falling away in all the derivative instruments apart from a burst of activity in the LLD at month-end as prices slid below $1,000 again.
Spot platinum, palladium and the ratio, January 2016 to date
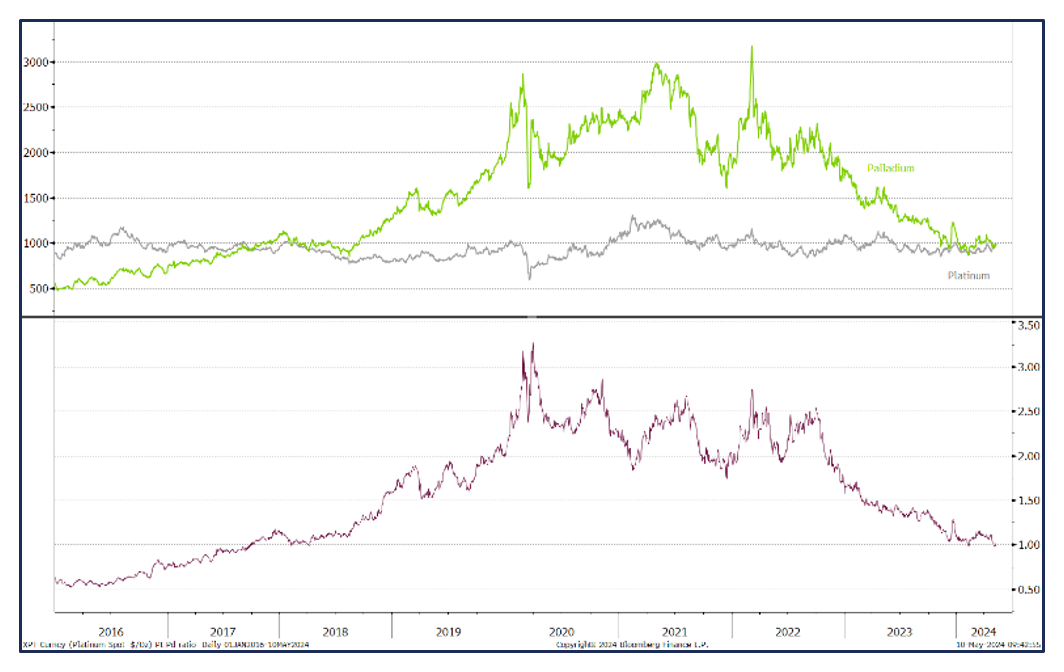
Source: Bloomberg, StoneX
Exchange Traded Products, like platinum, saw some tentative interest over the month, with 12 of the 22 trading days posting net creations. There was a net addition of 0.70t over the month, an increase of 4%; over the year to end-April the ETPs added 0.98t or 12% to 17.83t. Annual mine production is roughly 195tpa.
The CFTC numbers from NYMEX show a sharp jump in outright longs, from 11.8t to 13.2t, in the first week of April as prices forged higher. This then went into broad reverse, ending the month at 10.3t. The high level of outright shorts on NYMEX has been a subject of interest for some months now and they reached the highest level on record in mid-February, at 49.4t. Since then they have been on a downward trend, closing down to a still sizeable 41.1t in mid-April. Since then however, they have expanded again and at end-April they stood at 47.3t, not far from the record and potentially laying the foundations for a short-covering rally.
In January we said, “This nervous and illiquid market that will at some stage generate another short-covering rally, but the overriding sentiment is that any strength in price (barring exogenous shocks) will be generated by short-covering and nothing else”. Barring supply disruptions, we see little reason to modify that view.
The views and opinions expressed herein are the views and opinions of the author and do not necessarily reflect those of Nasdaq, Inc.