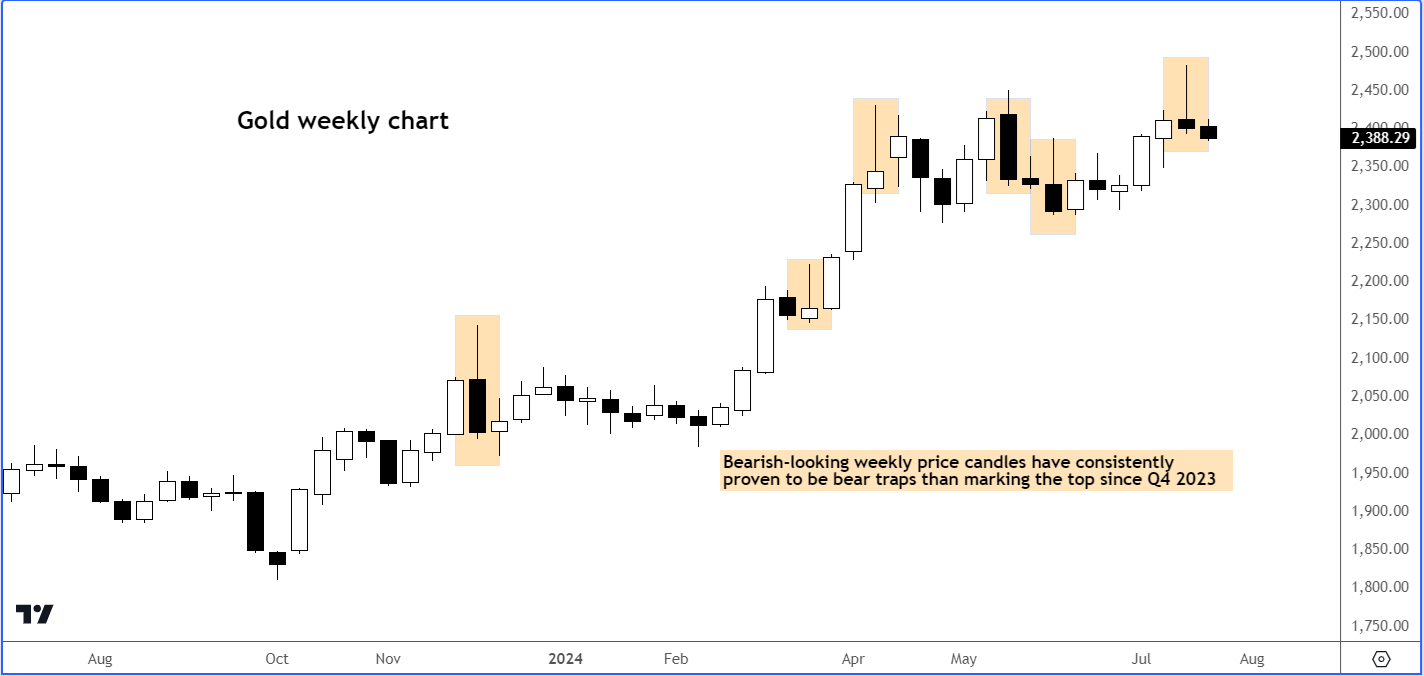
Precious metal remains under pressure after last week’s drop when gold hit a record high before taking a drop to close lower. Its failure to hold above the previous record highs of April ($2431) and May ($2450) has raised some concern that gold may have hit a peak. However, I am doubtful that is the case and expect the precious metal to bounce back, potentially reaching a new record soon. So, my gold forecast remains bullish as before despite the metal extending lower at the start of this week. After all, this is not the first time we have seen such bearish price action before the bulls have roared back.
Gold forecast: Weekly chart analysis

Gold reached a record high last week but then plummeted to close lower, printing a bearish-looking inverted hammer candle on the weekly chart. The shape of the weekly candle, plus its inability to maintain levels above the previous record highs of April ($2431) and May ($2450) has sparked concerns that gold may have peaked. However, as highlighted on the gold chart, the metal has formed this sort of bearish weekly price action on several occasions since the fourth quarter of 2023. In almost all of those occasions, we have only seen modest downside follow-through at best. Some of those candles were completely engulfed by the next week’s price action, suggesting no real control by the bears. Last week’s inverted hammer candle, while it may look bearish, could turn out to be yet another trap for the bears.
Gold support levels to watch
On the daily time frame, once can see that gold has now reached potential support in the area between $2385 to $2400. Prior resistance meets the 21-day exponential moving average here. The 21-day EMA typically offers good support in strong trends. Let’s see if this will be the case again, or this time we will dip a bit below it. The bullish trend line since February comes in around the $2365 area, which is the next significant support level should the $2385-2400 area breaks down.

In terms of potential resistance, $2450 is now important to watch, given the metal had peaked there in May and we couldn’t hold above it for long last week. Above that level, last week’s all-time high comes into play at $2483 and then the next psychologically important level of $2500. That could be a good extended target for the bulls to aim for should the bullish trend resumes, as I suspect might be the case.
PMIs, GDP and core PCE among week’s key macro highlughts
This week we will have plenty of potentially market-moving data that could influence the dollar and gold prices. Let’s quickly go through some of these events…
Global PMIs – Wednesday
The European manufacturing sector has been struggling for the past two years, with PMIs reflecting minimal growth and causing considerable concern. This trend is expected to continue, but any signs of improvement will be a welcome relief for the markets. Additionally, services sector PMIs, especially the prices component, will be pivotal as they often serve as a leading indicator of inflation. Persistent inflation in the services sector has made central banks hesitant to cut rates, so this data will be closely watched. If the data makes the market more confident about rate cuts by the likes of the ECB, BoE and Fed, then this should help support gold and silver prices.
Advance US GDP – Thursday
Thursday brings crucial data with the advance estimate of second-quarter GDP growth and the June core personal consumption expenditure (PCE) deflator, which should be crucial for the dollar, and in turn gold. The first quarter saw modest growth at 1.4%, with consumer spending at 1.5%. Analysts are optimistic for stronger results this time, projecting growth of around 1.9%, driven by improved consumer spending, rising inventories, and stronger investments. If the economy does rise closers to 2% as expected, it is likely that the second half of 2024 may present more challenges, potentially prompting the Federal Reserve to consider rate cuts starting in September anyway.
Core PCE – Friday
Comments from several Federal Reserve officials, a cooling jobs market, and declining CPI suggest the central bank is nearing a rate cut, potentially as soon as September. While policymakers have yet to declare price stability achieved, they are close. The core PCE price index, their preferred inflation measure, will be crucial on Friday. Encouraging data could bolster their confidence, but if the numbers disappoint, uncertainty will continue to loom. For gold, signs of inflation persisting are not necessarily a bad thing given investors have rushed into gold to hedge against rising price levels in the first place anyway. If inflation turns out to be weaker than expected, gold may benefit from a corresponding drop in the US dollar. So whichever way you look at it, inflation data is unlikely to pose a threat to gold’s bullish trend.
Source for all charts used in this article: TradingView.com
— Written by Fawad Razaqzada, Market Analyst
Follow Fawad on Twitter @Trader_F_R
How to trade with City Index
You can trade with City Index by following these four easy steps:
-
Open an account, or log in if you’re already a customer
• Open an account in the UK
• Open an account in Australia
• Open an account in Singapore - Search for the company you want to trade in our award-winning platform
- Choose your position and size, and your stop and limit levels
- Place the trade


