
- Gold analysis: why are yields and dollar falling?
- US GDP and core PCE among key US data highlights
- Gold technical analysis: metal getting a bit overstretched
Gold was up nearly 1.3% by late afternoon trading in London, near $2040 while silver was closing in on the $25.00 level. The precious metals have been supported by two factors: Bond yields and US dollar, both falling. The EUR/USD hit the 1.10 handle while the USD/JPY slumped below 147.50. US equity markets were higher, looking set to resume their impressive rally seen over the past several weeks. But gold’s acceleration means prices might be a little bit overbought in the short-term outlook. Profit-taking ahead of key US data could weigh on metal prices in the near-term. That said, there’s no doubt that the path of least resistance is to the upside.
Video: Gold and Silver technical analysis
So, what’s the common denominator behind all these moves?
It is growing expectations that the Fed and other major central banks are basically done with hiking interest rates. The next policy decision from the FOMC is likely to be a rate cut, and the markets are trying to price in those cuts even before Powell and co., and indeed other global central bank heads, have declared victory over inflation. Markets are getting a bit over excited, but traders are just looking to take advantage of the momentum and will be asking questions later.
Clearly, a lot will depend on incoming data, but judging by the recent releases, it does indeed look like inflation is well and truly falling back towards normal levels across the world. Gold and silver were highly likely to rally in recent weeks, as we have been banging on about it, because of the prevailing narrative of peak interest rates, which was not going to change given the fact we didn’t have any important data or central bank speeches at the start of this week.
Gold analysis: how could upcoming data impact metals’ prices?
As mentioned, supporting gold and silver prices are the continued weakness we have seen in bond yields, reducing the opportunity cost of holding assets that don’t pay any interest or dividends. The drop in yields accelerated following the sharper-than-expected drop in US CPI a couple of weeks ago, which reinforced the anticipation that the Fed (as well as other central banks) will refrain from further rate hikes.
The more prominent the narrative of “peak interest rates” becomes, the stronger the support is likely to be for gold and silver prices. So, watch out for further US data misses if you are bearish on the dollar, or bullish on gold.
However, if we see further resilience in US data, then this will discourage the Fed’s doves to call for rate cuts.
The preliminary estimate for US GDP in the third quarter is scheduled for release on Wednesday, while on Thursday, we will have the core PCE price index. Both of these data releases have the potential to move the dollar, and by extension, gold, sharply.
Gold analysis: technical levels and factors to watch
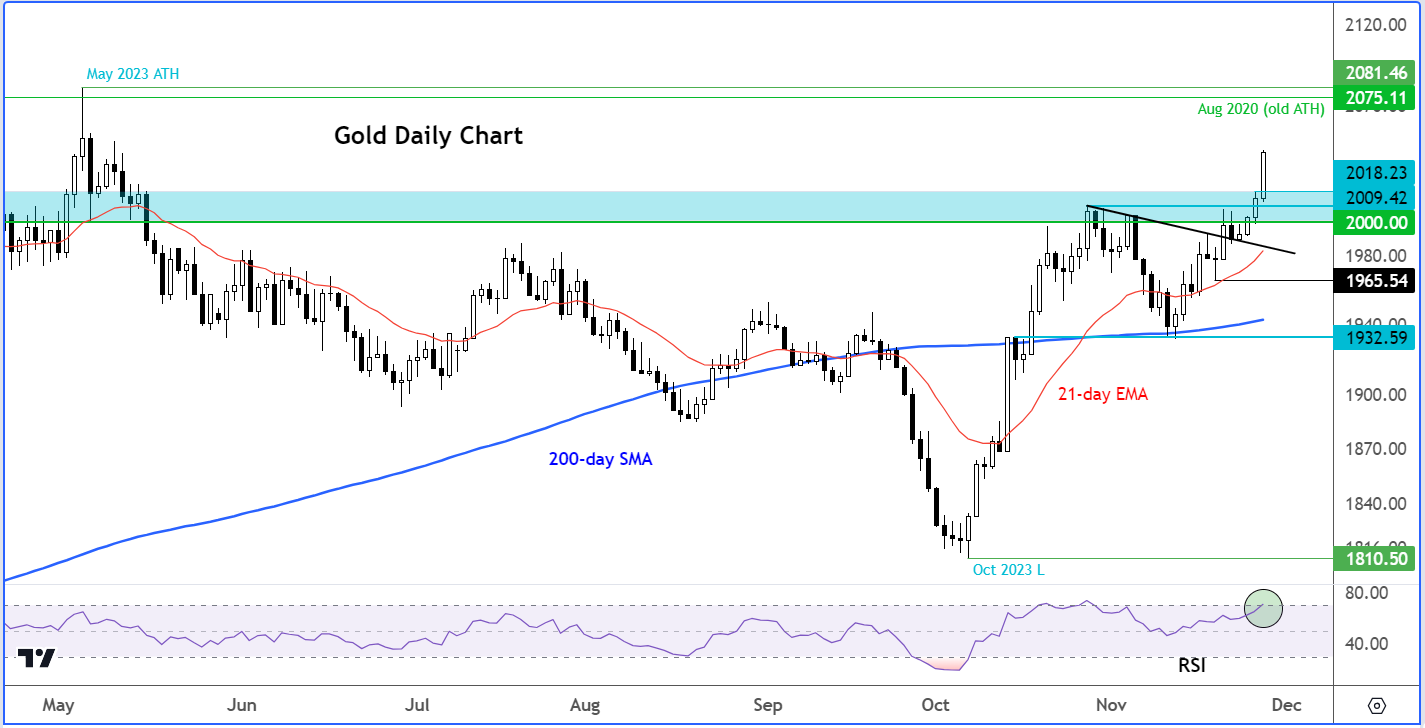
Source: TradingView.com
From a technical point of view, there’s really not much further reference points for XAUUSD until its record high that was set earlier this year at $2081, which was a few dollars above the 2020’s old high of $2075. So, a potential continuation of the rally towards those levels looks likely. But the sharp rally means prices might be overnight in the short-term outlook. A bit of pullback should therefore not come as major surprise, especially ahead of key US data releases this week.
The big turnaround for gold was when the precious metal staged a V-shaped recovery between September and October. Just after the middle of October, gold then created a higher high when it also broke back above the 200-day moving average. The metal then went on to climb above $2000 for a while, reaching a peak in October of just under $2010, before correcting lower. The correction lasted a few weeks, but gold bulls came out in the middle of November and defended their ground right where they needed to, around the $1932-$1945 area, which was previously resistance and where the 200-day average was residing. In more recent days, gold has been trending higher again, leading to a break above the 21-day moving average and some short-term resistance levels in the process.
So, moving forward, the bulls will need to defend their ground on short-term pullbacks. The first line of defense is now at around $2018, followed by $2010. These levels were previously resistance.
— Written by Fawad Razaqzada, Market Analyst
Follow Fawad on Twitter @Trader_F_R
How to trade with City Index
You can trade with City Index by following these four easy steps:
-
Open an account, or log in if you’re already a customer
• Open an account in the UK
• Open an account in Australia
• Open an account in Singapore - Search for the company you want to trade in our award-winning platform
- Choose your position and size, and your stop and limit levels
- Place the trade