When we last met for the snapshot, the Washington Capitals’ chances of making the playoffs were more than 60 percentage points lower than it is now. At that time, I recommended the Caps trade every player not nailed down to put their inevitable rebuild into turbo mode.
They went in a different direction. It worked! The Caps went 9-5-1 in March, the tenth best record in the NHL, and they clawed their way to third place in the Metropolitan Division. In every aspect but the macro one, this is a tremendous success. They’re playing meaningful games and winning them, many of them against daunting opponents. It’s been a ton of fun. They’re probably going to make the playoffs, which will be exciting and a fundamental marker of success for any team.
But making it deep in those playoffs seems unlikely. Looking below the win-loss record, the Caps are still weak. We’ll have fun in the meantime, but a rebuild is still inevitable, and it’ll take a bit longer now.
The Caps ranked 10th in standings-points percentage in March, but they ranked 30th in controlling shot attempts. They got outscored 32 to 29 during five-on-five. They had slightly better than average goaltending, by about four goals and almost all of them on the penalty kill. They won based on special teams, especially a power play that converted 30 percent of its opportunities, and timeliness of goals, which is not historically a repeatable skill.
I am trying to be polite here, and I’m failing. Everything except the standings is screaming that the Caps are a bad team. That of course invites skepticism of the “everything,” plus rationalizations for Washington’s unlikely success. Gamers would call that copium.
I’m not rooting against the Caps, even if I have one personal reason to do so. I’m having fun with these wins, as I document in every recap. But in this column I put on my Serious Hat and say the Caps are delaying lasting improvements so they can squeak into the playoffs only to get run over in the first round.
I promise that’s the most negative I’ll be for the rest of of this story and the rest the season. Let’s do the snapshot. The tables below show the team’s performance when each player is on the ice during five-on-five play. I’ve highlighted stats of note, and we’ll discuss those below.
Forwards
| Player | TOI | SA% | xGF% | GF% | PDO |
|---|---|---|---|---|---|
| Strome | 1008 | 49.7 | 52.0 | 45.6 | 0.99 |
| Sgarbossa | 222 | 49.0 | 50.2 | 53.7 | 1.02 |
| Wilson | 862 | 48.9 | 46.8 | 32.2 | 0.95 |
| Milano | 452 | 48.5 | 52.5 | 59.6 | 1.05 |
| Protas | 818 | 47.5 | 49.1 | 47.8 | 1.00 |
| Pacioretty | 462 | 47.3 | 48.1 | 40.4 | 0.97 |
| Ovechkin | 971 | 47.3 | 44.6 | 39.9 | 0.98 |
| McMichael | 893 | 47.2 | 48.3 | 39.6 | 0.98 |
| Lapierre | 419 | 45.5 | 41.9 | 49.8 | 1.01 |
| Oshie | 610 | 44.7 | 43.8 | 39.7 | 0.99 |
| Phillips | 253 | 43.1 | 51.4 | 42.1 | 0.99 |
| Kuznetsov | 563 | 42.3 | 38.8 | 34.3 | 0.98 |
| Aube-Kubel | 640 | 42.3 | 40.7 | 57.5 | 1.05 |
| Dowd | 685 | 40.2 | 39.8 | 48.7 | 1.03 |
| Malenstyn | 819 | 39.8 | 39.2 | 48.4 | 1.03 |
Defenders
| Player | TOI | SA% | xGF% | GF% | PDO |
|---|---|---|---|---|---|
| Carlson | 1319 | 46.6 | 47.0 | 43.3 | 0.99 |
| Fehervary | 948 | 46.4 | 47.5 | 39.2 | 0.98 |
| Sandin | 1204 | 46.2 | 45.7 | 46.5 | 1.00 |
| van Riemsdyk | 1013 | 45.3 | 49.1 | 49.5 | 1.02 |
| Jensen | 1156 | 44.7 | 43.8 | 47.2 | 1.01 |
| Alexeyev | 359 | 43.3 | 45.7 | 39.3 | 0.98 |
Glossary
- TOI – Time on ice in minutes. Only five-on-five play is included here.
- SA% – Shot-attempt percentage. The share of total shots attempted by Washington while the skater is on the ice during five-on-five play. 50 percent means even.
- xGF% – Expected goals percentage. The share of expected goals generated by Washington while the skate is on the ice during five-on-five play. Expected goals weighs how likely to become a goal each attempted shot is. 50 percent means even.
- GF% – Goals-for percentage. The share of total goals scored by Washington when the skater is on the ice during five-on-five play. 50 percent means even.
- PDO – The sum of Washington’s shooting percentage and saving percentage when the skater is on the ice during five-on-five play. One means league average. The acronym doesn’t stand for anything, and yes, I hate it.
Notes
- Alex Ovechkin saw the Caps outscore opponents 11 to 5 this month, better than any Cap save Trevor van Riemsdyk (14 for, 7 against – we’ll talk about him below). Ovechkin was the beneficiary of excellent finishing rates at both ends: 13.4 percent shooting and 95.2 percent saving, for a March PDO (the sum of those two numbers) of 1.09, well above the general median of 1.00. This is classic progression to the mean for poor Ovechkin, who was so unlucky early in the season. We all knew this was going to happen all along.
- Similarly, TJ Oshie rode favorable finishing percentages to wind up narrowly on the positive side of goal differential, but the overall flow of play was the opposite. The Caps controlled just 39.3 percent of the shot attempts and 36.5 percent of the expected goals in March, pulling down the full-season percentages you see in the table above. Below the tank line. It’s undeniable Oshie still has the hands, but the rest of his game seems to be a struggle lately. Oshie said he had sometimes doubted he could make it to 1000 games. “There was a couple different instances where I thought that maybe getting to this point was in jeopardy,” he said after the milestone game. I worry we might now be looking at the last month of Oshie’s professional career.
- Dylan Strome was Washington’s best performer of the month. He had 18 points (4 goals, 14 assists) in 15 games and drove play better than any full-time Caps player, 52.5 percent of attempts, 60.3 of expected goals. The thing that jumps out at me there is the big gap between volume (attempts) and quality (expected goals, which weighs each shot attempt differently based on how likely it is to become a goal). Strome had a lot more quality than volume, an effect shared with the team overall, who placed 30th in shot-attempt percentage in March but a much better 22nd in expected goals.
- I’m really glad that expected goals has become part of the conversation over the last few years – not because it’s absolute or authoritative (it’s not and no one thinks it is), but because it provides one more angle from which to approach these discussions. Here’s all the Caps and how their on-ice shot-attempt percentages (SA%) compared to their on-ice expected goal percentages (xGF%) in March. The farther the player is above the red line, the more quality they had per attempt – or the more opponent quality they limited.
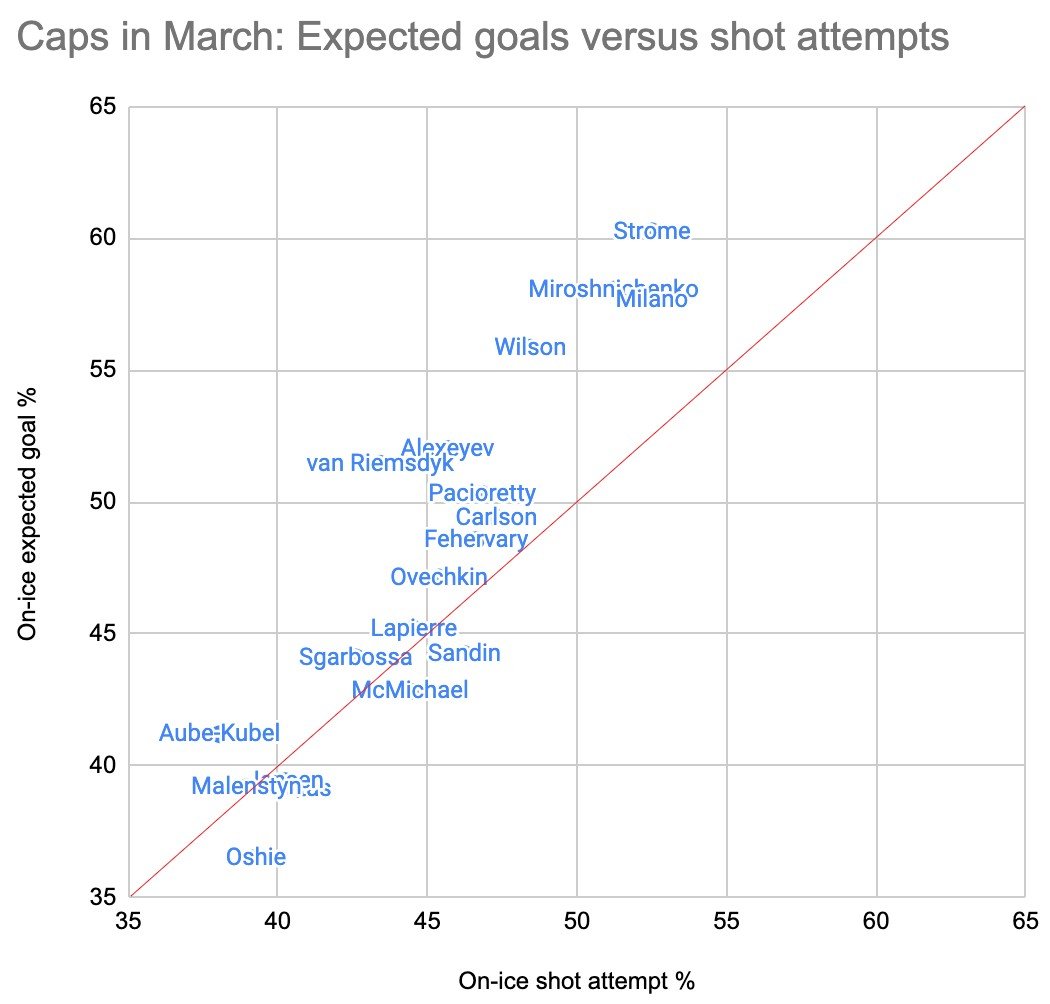
- Looking at offense and defense independently, it seems to me the quality gap is mostly coming on attack. Miroshnichenko, Wilson, Strome, Milano, and Carlson all seemed to get more dangerous chances in proportion to their attempts. Oshie fared worst at this stat, which surprises me given his skill set but not given his current status.
- Now to Beck Malenstyn, whose 39.8 percent of shot attempts is lowest on the team and better than only five full-time forwards in the whole NHL. Unlike Strome and the Caps overall, Malenstyn’s on-ice expected-goal share is not much better than his shot-attempt numbers. But the critical detail about Malenstyn is his deployments. Maybe my biggest surprise with head coach Spencer Carbery is the continuity he’s had with Peter Laviolette regarding how uses his fourth line, i.e. almost never offensively. Malenstyn sees a smaller share of his shift starts (at least the ones that start with faceoffs) begin in the offensive than… literally anyone in the entire NHL. He’s a defensive-zone-only player, so we should kind of expect him to get shelled. And he does. In the graph below, each dot is an NHL forward. The horizontal position is how often they start in the offensive zone; the vertical position is the share of shot attempts that belong to the player’s team.
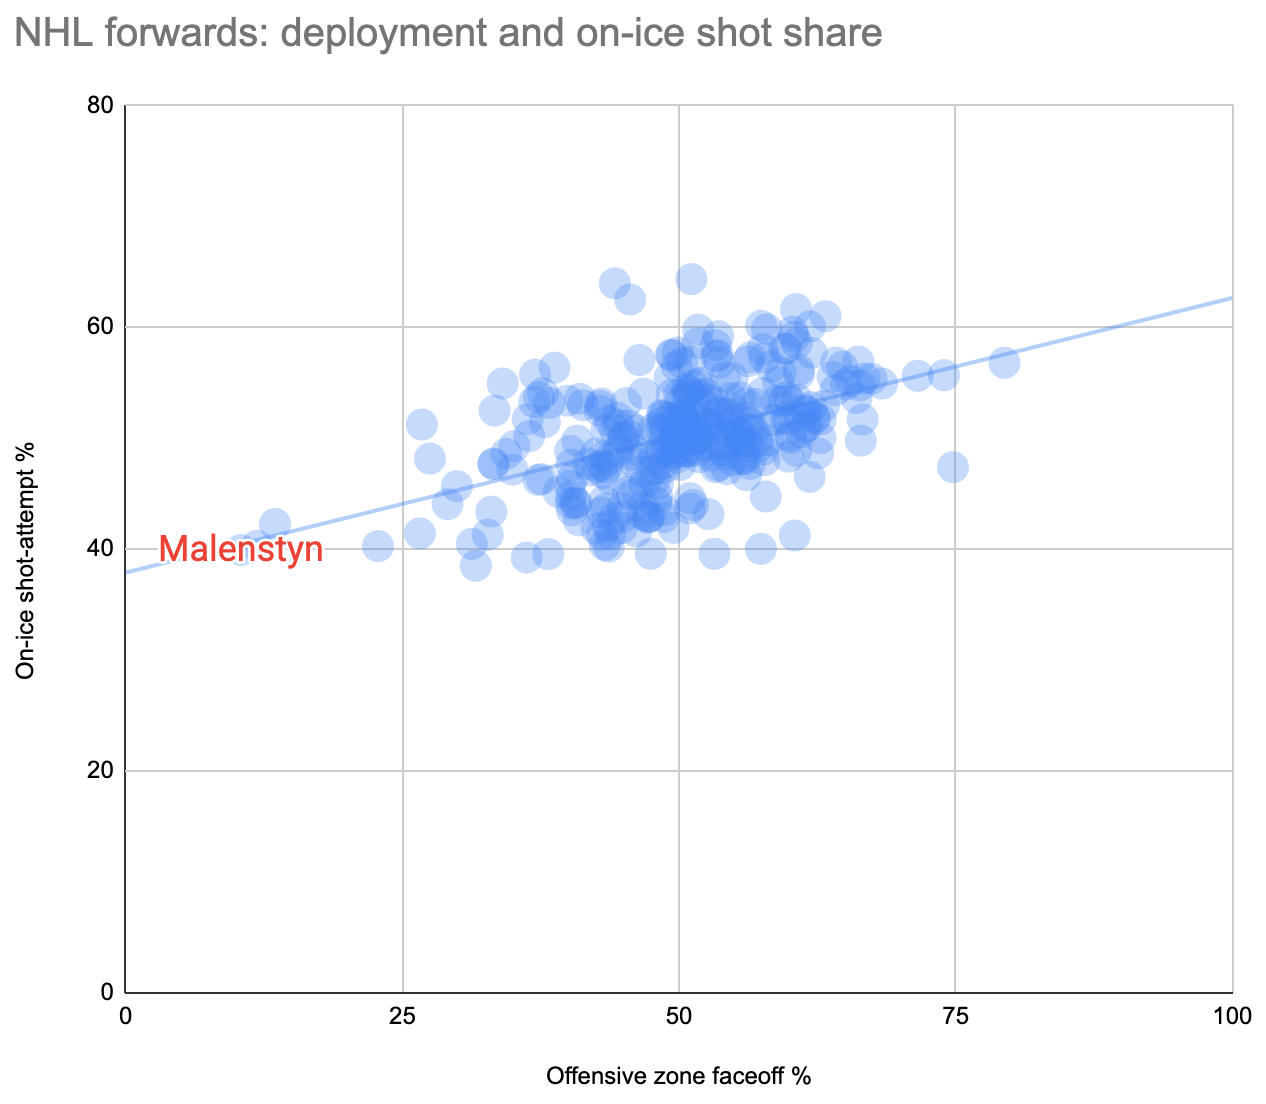
- The importance of zone starts has shifted in the minds of analysts over the last decade, but for players at the extremes it should still hold sway. Malenstyn is the most extreme. He finally had the bad month his underlying play has promised all along: a minus-6 goal differential, better than only his linemate, Nic Dowd. There’s a broader conversation to be had about Malenstyn’s value, but for now: Carbery’s chickens have come home. So ultimately I’m skeptical about Malenstyn, but I wish I could see him used in a different context at least once to know better.
- I haven’t added him to the snapshot proper yet, but Ivan Miroshnichenko played nearly the whole month of March. The Caps controlled 58.1 percent of the expected goals when he was on the ice, second best behind Strome, but they got outscored by one goal due to a slightly below-average save percentage. Miro got the un-Malenstyn treatment with mostly offensive deployments, but man, he looks good. He looks like an NHL player. Using HockeyViz’s reckoning (with a small sample warning), he looks like a good NHL player.
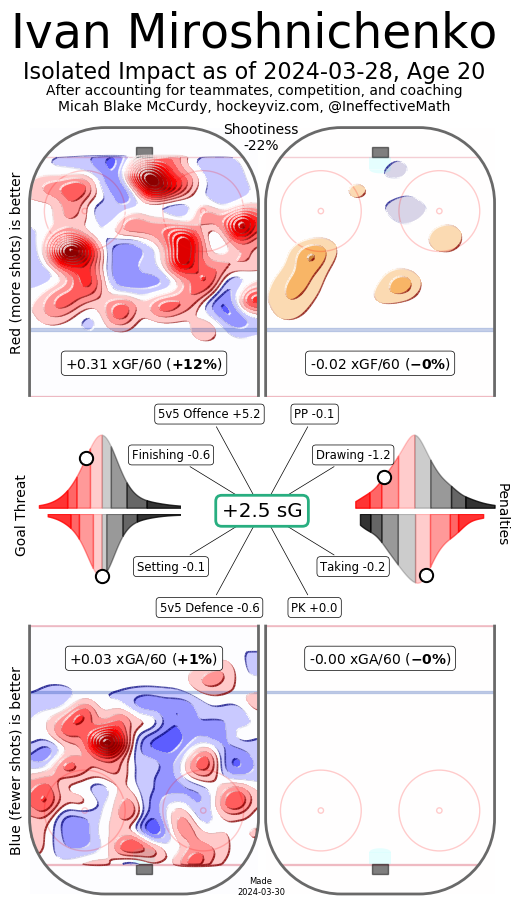
- The diagram at top left is the offensive side of the ice, and the red blobs mean the Caps shoot more from those locations as an estimation of Miroshnichenko’s impact. Miro goes to the net; he had a higher rate of individual high-danger chances than any Caps player except known net-crasher Tom Wilson.
- I don’t have anything earth-shattering to say about Trevor van Riemsdyk except that he was Washington’s best defender in March and has a case for being Washington’s best defender all season. He’s another one of those players with a gap between shot-attempt percentage – a not-very-impressive 45.3 – and expected-goal percentage – a respectable-at-least-on-this-team 49.5. TVR’s been an ideal partner for both Nick Jensen, who otherwise struggles, and Rasmus Sandin, although goaltending has been brutal (.889) when they’re on the ice.
- TVR has not been so successful with Alex Alexeyev (262 minutes together), about whom I have nothing positive to say. He really, really struggles getting the puck back in his own zone and transitioning to offense. I’m not surprised he’s at the bottom of the stack ranking among defenders, and I’m a bit disappointed the Caps couldn’t find a better option for depth defense.
This story would not be possible without Natural Stat Trick, All Three Zones, Evolving Hockey, and Hockey Viz. Please consider joining us in supporting them.