The gold price and silver price will likely continue to rise if the Yen confirms its spectacular turnaround. Precious metals and the Yen are positively correlated since 2 years. The Yen seems to be confirming a triple bottom formation, suggesting an upward move is underway, leading gold and silver prices higher.
Related – 3 Reasons Why The Gold Price Breakout Will Continue To Make All-Time Highs In 2024
It is a matter of days, maximum two to three weeks, until the triple bottom in the Yen will be confirmed.
In a way, gold and silver investors can monitor the Yen chart to understand future price direction of gold and silver prices.
The Yen/Gold correlation
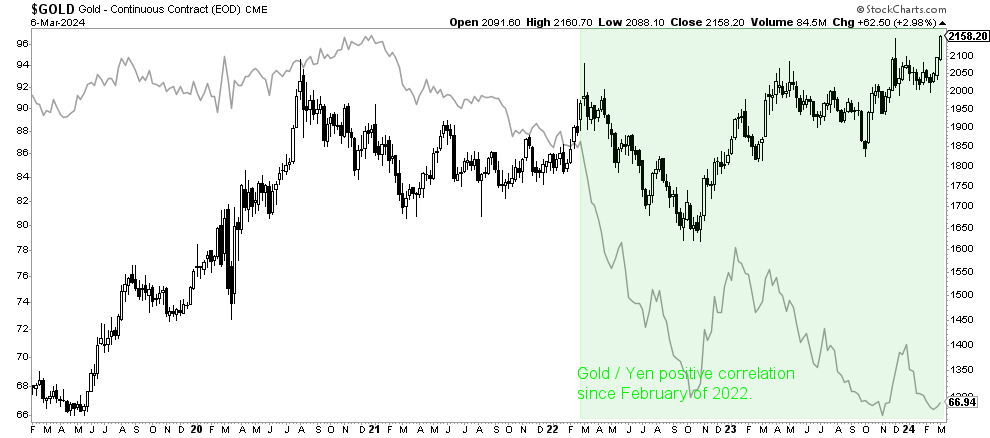
Intermarket dynamics 101 – the Yen declined significantly since February 2022, and so did the price of gold.
On every spike in the Yen, for instance in Nov of 2022 and Nov of 2023, gold followed suit.
While the correlation may not materialize on a day by day basis, it certainly is visible on the longer term timeframe, weekly chart below.
This is the Yen chart – the triple bottom is such an obvious formation, the higher low against Nov of 2023 might be a very powerful bullish sign (good for precious metals).
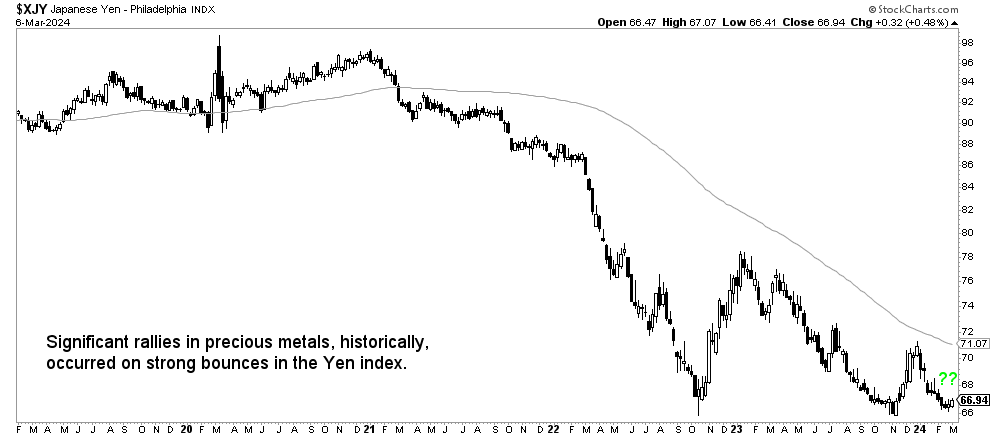
Note that, on December 1st, when the Yen was setting a local top, a Yen carry trade article came out, published by Reuters: Forex swings will upend lucrative yen carry trade. The Yen spiked 4 trading days later. However, it looks like the Yen is ready for ‘prime time’ now.
Yen seasonality confirms a bullish Yen period starting this week.
Indicators supporting higher gold and silver prices
There are more indicators that support gold and silver prices to move higher, consistent with our gold forecast 2024 and recent silver prediction.
The positive correlation between the price of gold and the inflationary index PCE has a clear trend – both higher.

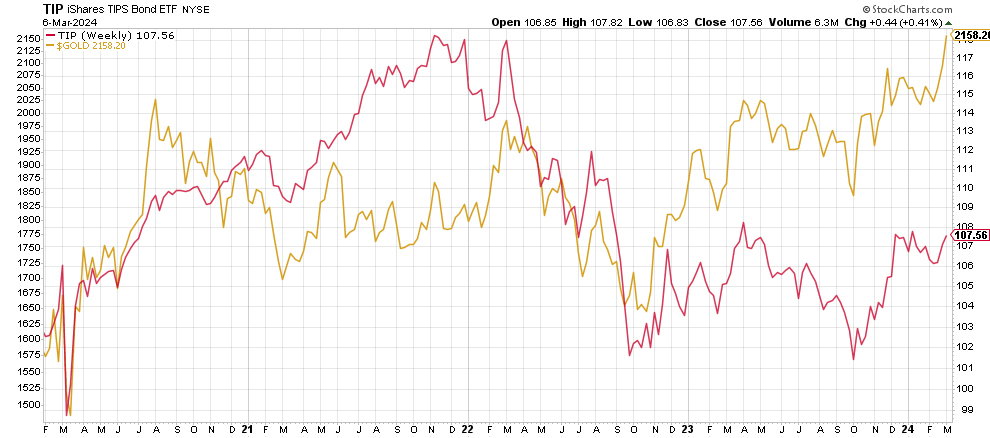
Inflation expectations, after setting a double bottom, looks to be set higher. Gold and silver prices should be following the path higher.
Gold price higher
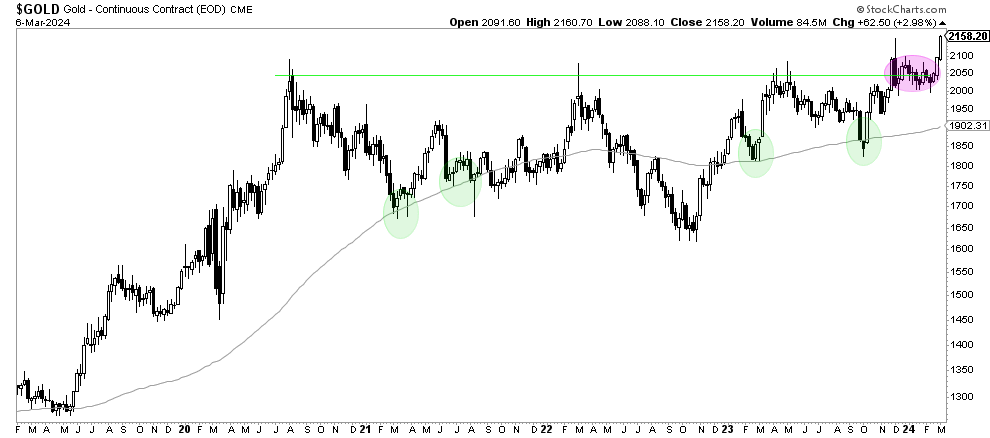
The gold price chart says it all – it’s a breakout.
Gold is hitting new all-time highs, as expected and explained many months ago. We did so in this article: Is Gold Expected To Move Higher And Set New All-Time Highs?
The secular breakout on the gold price weekly chart is nothing short of spectacular. More importantly, it’s a solid breakout. This looks for real, gold will be creeping higher in the coming months. That’s the way we read this chart setup.
Silver price much higher
The gold chart looks good? Frankly, the silver chart looks so much better.
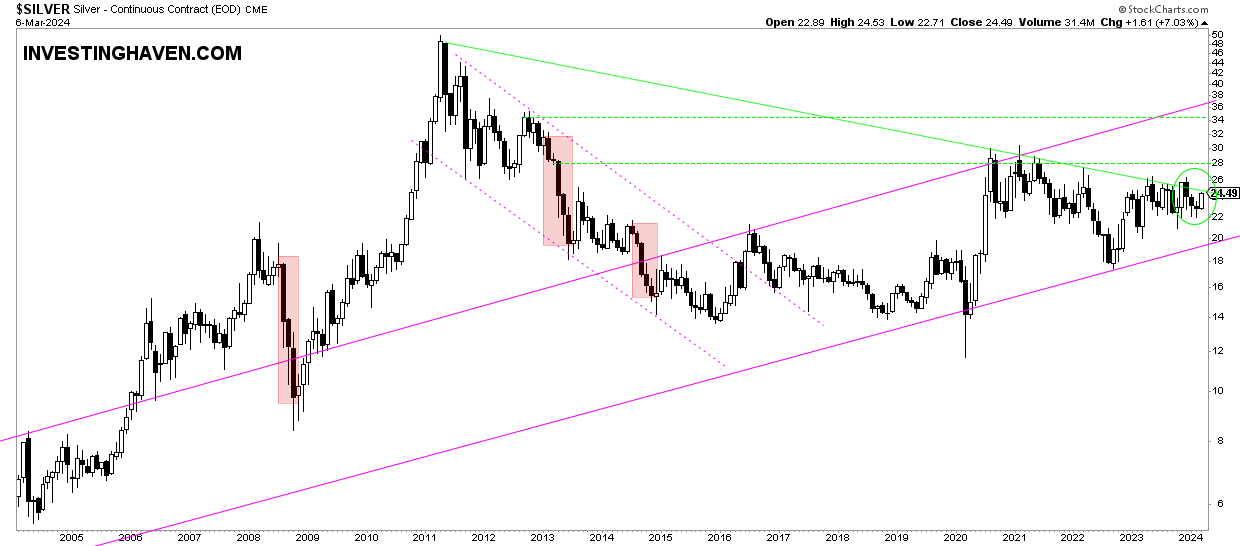
The longer term, monthly silver chart, is now at a breakout point.
While gold, as seen on the above chart, is breaking out to new ATH (horizontal trendline breakout), the silver chart is now attempting to clear a 13-year falling trendline.
Needless to say, a tiny push higher in the price of silver will trigger an epic secular breakout.
We asked the question a while ago When Exactly Will The Price Of Silver Start A Rally To $50? – maybe the journey is starting right here right now?
Follow our premium gold and silver analysis for weekly detailed alerts >>

