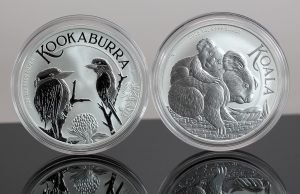
In December, Australian bullion sales showed a slight increase for silver-struck products but experienced a significant slowdown for those minted in gold, according to the latest figures from The Perth Mint of Australia.
In the course of 2023, the Mint witnessed a decrease in bullion sales for both gold and silver products in contrast to the strong performance in 2022 when they achieved annual totals not seen since CoinNews started collecting their data in 2013.
The Perth Mint’s bullion gains compare against divided precious metal for December and 2023, with LBMA prices (USD) rising 1.3% for gold and dropping 4.9% for silver in December, while for the year, they soared by 13.8% for gold but slipped 0.6% for silver.
December and Annual 2023 Perth Mint Gold Bullion Sales
The Mint’s total sales of gold coins and gold bars in December amounted to 36,297 ounces, the lowest monthly total since August. This represents a decline of 32.2% from November and a 40.1% decrease compared to December 2022.
“As well as a noticeably slowdown in demand for gold bullion products in the USA, our Coining Division closed for the year on 23 December, with a consequent reduction in ounces shipped,” said Neil Vance, General Manager Minted Products.
In 2023, The Perth Mint recorded annual gold bullion sales of 665,889 ounces. Below, you can find a year-by-year comparison:
- Down 40.4% from the 1,116,969 ounces in 2022
- Down 36.6% from the 1,050,242 ounces in 2021
- Down 14.5% from the 778,797 ounces in 2020
- Up 71% from the 389,463 ounces in 2019
- Up 65.6% from the 402,049 ounces in 2018
- Up 82.2% from the 365,410 ounces in 2017
- Up 28% from the 520,295 ounces in 2016
- Up 46.1% from the 455,630 ounces in 2015
- Up 28.9% from the 516,709 ounces in 2014
- Down 11.8% from the 754,636 ounces in 2013.
December and Annual 2023 Perth Mint Silver Bullion Sales
In December, the Mint reported sales of 681,490 ounces for minted silver coins and bars, marking a modest increase of 1.3% from November when they reached a 45-month low but reflecting a significant drop of 58.3% compared to December 2022.
“With several key releases scheduled in coming months, including January’s launch of the Australian Kookaburra 2024 Silver Bullion Coin Series, we’re hopeful of a strong start to the new year,” Vance said.
The Perth Mint’s annual silver bullion sales in 2023 totaled 14,896,564 ounces. Here is the year-by-year comparison:
- Down 35.7% from the 23,176,142 ounces in 2022
- Down 22% from the 19,091,681 ounces in 2021
- Down 9.5% from the 16,452,490 ounces in 2020
- Up 28.7% from the 11,573,602 ounces in 2019
- Up 61.2% from the 9,243,058 ounces in 2018
- Up 54.6% from the 9,636,408 ounces in 2017
- Up 21.7% from the 12,236,766 ounces in 2016
- Up 28.5% from the 11,595,504 ounces in 2015
- Up 96.9% from the 7,567,467 ounces in 2014
- Up 72.3% from the 8,647,862 ounces in 2013.
Monthly Perth Mint Gold and Silver Bullion Sales Since December 2022
Below is a monthly summary of Perth Mint bullion sales from December 2022 to December 2023. The figures show monthly ounces of gold and silver shipped as minted products by The Perth Mint to wholesale and retail customers worldwide. It excludes sales of cast bars and other Group activities including sales of allocated/unallocated precious metal for storage by the Depository.
| Perth Mint Bullion Sales (in troy ounces) | ||
|---|---|---|
| Silver | Gold | |
| December 2023 | 681,490 | 36,297 |
| November 2023 | 672,623 | 53,520 |
| October 2023 | 1,073,553 | 42,302 |
| September 2023 | 1,116,779 | 36,530 |
| August 2023 | 792,503 | 34,875 |
| July 2023 | 863,485 | 44,009 |
| June 2023 | 1,326,011 | 73,124 |
| May 2023 | 1,881,001 | 72,889 |
| April 2023 | 1,947,743 | 75,166 |
| March 2023 | 1,823,096 | 80,541 |
| February 2023 | 1,484,936 | 52,241 |
| January 2023 | 1,233,344 | 64,395 |
| December 2022 | 1,634,751 | 60,634 |

