- Economist Jeremy Siegel calls for emergency rate cuts following the recent market crash.
- Veteran trader Peter Brandt compared the recent Bitcoin sell-off to the 2015-2017 halving bull market cycle.
- Arkam Intelligence data shows major investors retained their Bitcoin holdings during the recent sell-off.
- On-chain data indicates that short-term investors are selling in a panic during the market downturn.
Bitcoin (BTC) price recovers above $55,00 on Tuesday after the sharp decline seen since the end of July. Economist Jeremy Siegel has called for emergency interest rate cuts after the recent market crash. At the same time, Arkham Intelligence data reveals that major investors like BlackRock, MicroStrategy, Grayscale, and Fidelity retained their Bitcoin holdings during the sell-off. Additionally, on-chain data shows short-term investors are selling in a panic, indicating a possible slight recovery before the downtrend resumes.
Daily digest market movers: Bitcoin holds $50,000 as Jeremy Siegel calls for emergency rate cuts
- Jeremy Siegel, a finance professor and chief economist, has urged an emergency 75 basis point cut in the Fed funds interest rate in response to the recent market downturn, stressing the need for immediate action and proposing an additional cut next month to better align with the Federal Reserve’s (Fed) inflation and employment targets, while criticizing the Fed’s slow response as a major policy misstep that could exacerbate negative market reactions.
“I’m calling for a 75 basis point emergency cut in the Fed funds rate, with another 75 basis point cut indicated for next month at the September meeting – and that’s minimum,” says Wharton’s Jeremy Siegel
- With the likelihood of a 50 basis point rate cut in September rising to 98.5% and some advocating for an “emergency rate cut” before the meeting — though such mid-meeting cuts are uncommon — a September rate reduction could potentially rejuvenate the crypto market from its recent downturn.
“I’m calling for a 75 basis point emergency cut in the Fed funds rate, with another 75 basis point cut indicated for next month at the September meeting – and that’s minimum,” says Wharton’s Jeremy Siegel: pic.twitter.com/s4CgWx962Q
— Squawk Box (@SquawkCNBC) August 5, 2024
- On Monday, veteran trader Peter Brandt posted on social media platform X that the recent Bitcoin sell-off was like the 2015-2017 halving bull market cycle.
- Brandt said,” Please note that $BTC decline since halving is now similar to that of the 2015-2017 Halving Bull market cycle.”
- According to Brandt, Bitcoin’s price dropped 27% from $650 at the halving week close in 2016 to a low of $474 before soaring to $20,000 in December 2017. Similarly, the recent decline to $49,050 represents a 26% drop from the post-halving price of $64,962.
- However, the slowdown in US economic activity and rising tensions between Israel and Iran could further depress Bitcoin’s price before it rallies.
- Arkham Intelligence data reveals that during Monday’s market sell-off, major institutional investors like BlackRock, MicroStrategy, Grayscale, and Fidelity chose to hold onto their Bitcoin holdings, signaling strong confidence in the cryptocurrency’s future.
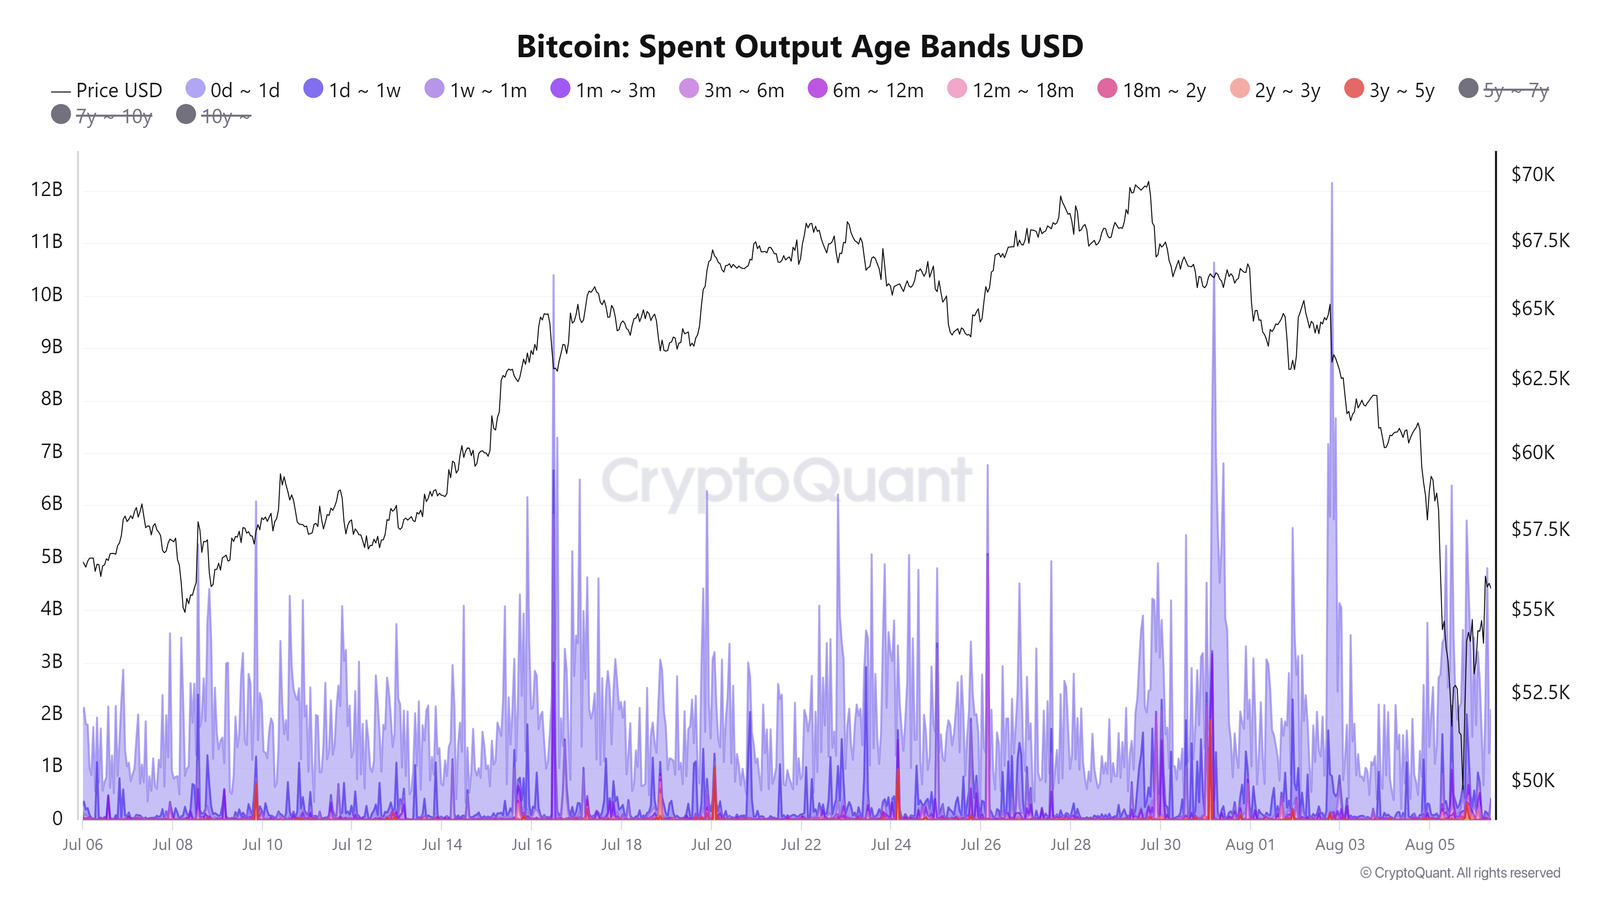
- CryptoQuant’s Spent Output Age Bands USD indicator tracks the value of spent outputs based on their creation time, providing insights into the behaviors of long-term versus short-term holders and their relationship with price movements.
- In Bitcoin’s case, the spent output by age range reveals that most on-chain activity came from coins less than a week old, with over $5.2 billion moving within a single hour from coins aged up to one week. This spending pattern included around $850 million in realized losses, of which only $600,000 were from long-term holders, with the majority coming from short-term investors. The high volume of coins held for less than three months suggests that the price drop pressures newer investors to capitulate.

Bitcoin Spent Output Age Bands USD chart
Technical analysis: BTC likely to have a relief rally before it continues its ongoing downtrend
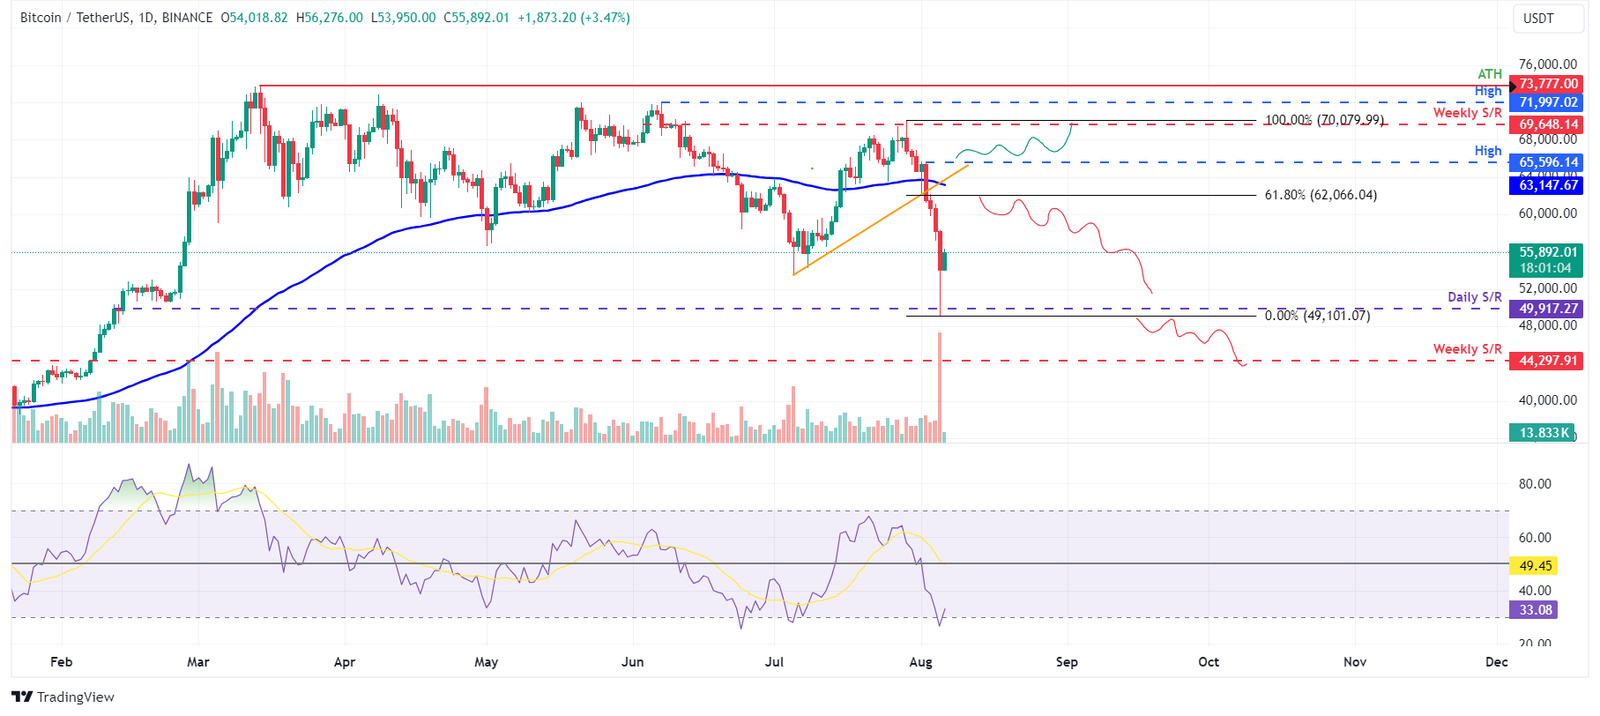
Bitcoin price broke below the ascending trendline (drawn by joining multiple swing lows from July 5) on Friday, leading to an 11.6% decline over the next three days, and tested the daily support around $49,917 on Monday. However, it modestly recovers at the time of writing on Tuesday, trading 3.5% higher at $55,892.
In this scenario, BTC might see a dead-cat bounce — a short-lived price increase amid a broader downtrend — potentially encountering resistance at the 61.8% Fibonacci retracement level of $62,066 (drawn from the swing high of $70,079 on July 29 to Monday’s low of $49,101). This level aligns with the broken trendline and the 100-day Exponential Moving Average (EMA) at around $65,596, marking it a critical reversal zone.
Failure to break above $62,066 might trigger a 19% crash, back to retest the $49,917 daily support level.
The Relative Strength Index (RSI) indicator on the daily chart is around 32, just above the oversold threshold. This indicates the possibility of a temporary relief rally before the downward trend resumes.

BTC/USDT daily chart
However, a close above the August 2 high of $65,596 would change the market structure by forming a higher high on the daily timeframe. Such a scenario might drive a 6% rise in Bitcoin’s price to retest its weekly resistance at $69,648.
Bitcoin, altcoins, stablecoins FAQs
Bitcoin is the largest cryptocurrency by market capitalization, a virtual currency designed to serve as money. This form of payment cannot be controlled by any one person, group, or entity, which eliminates the need for third-party participation during financial transactions.
Altcoins are any cryptocurrency apart from Bitcoin, but some also regard Ethereum as a non-altcoin because it is from these two cryptocurrencies that forking happens. If this is true, then Litecoin is the first altcoin, forked from the Bitcoin protocol and, therefore, an “improved” version of it.
Stablecoins are cryptocurrencies designed to have a stable price, with their value backed by a reserve of the asset it represents. To achieve this, the value of any one stablecoin is pegged to a commodity or financial instrument, such as the US Dollar (USD), with its supply regulated by an algorithm or demand. The main goal of stablecoins is to provide an on/off-ramp for investors willing to trade and invest in cryptocurrencies. Stablecoins also allow investors to store value since cryptocurrencies, in general, are subject to volatility.
Bitcoin dominance is the ratio of Bitcoin’s market capitalization to the total market capitalization of all cryptocurrencies combined. It provides a clear picture of Bitcoin’s interest among investors. A high BTC dominance typically happens before and during a bull run, in which investors resort to investing in relatively stable and high market capitalization cryptocurrency like Bitcoin. A drop in BTC dominance usually means that investors are moving their capital and/or profits to altcoins in a quest for higher returns, which usually triggers an explosion of altcoin rallies.

