As we close the books on another month, I realize it has been a while since my last piece on financial markets. Digging back through the archives took me to mid-March when I wrote about “3 Questions Heading into the March FOMC Meeting”. As I reread the piece, the reality is so much is different yet so much remains the same. This being the case, the financial sector remains an interesting puzzle as we head in 2024’s Q3. And as a teaser, I’ll add all eyes will be on where the S&P 500 closes July. The fate of the world might depend on it.

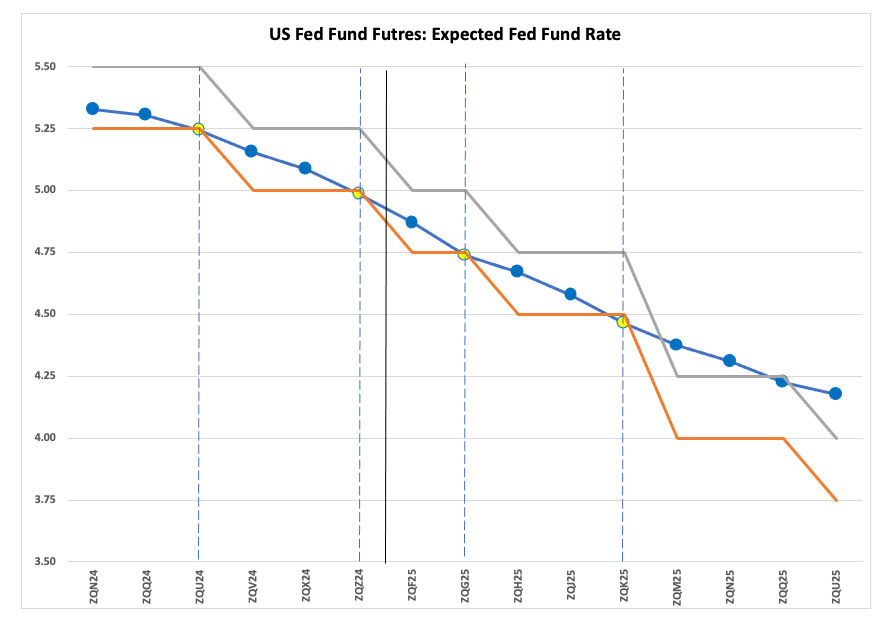
With that in mind, let’s look at the different pieces of the financial puzzle as the calendar page turns to July. Back in March, Fed fund futures indicated the US Federal Open Market Committee could cut rates three times over the last nine months of 2024, the first one possible at the conclusion of the June meeting. As we all know, this didn’t happen, and the front-running comments for the July meeting (July 30 and 31) have not been as clear as what we’ve seen in the past. One has to wonder how much of an impact this could have on the S&P on that important date of July 31. I’ll get to that later. For now, Fed fund futures are indicating two rate cuts over the second half of 2024, the first at the conclusion of the September meeting (September 18), then the end of the December meeting (December 18). In between we have the other key date for the S&P 500, October 31, and the next US Election Day (November 5).

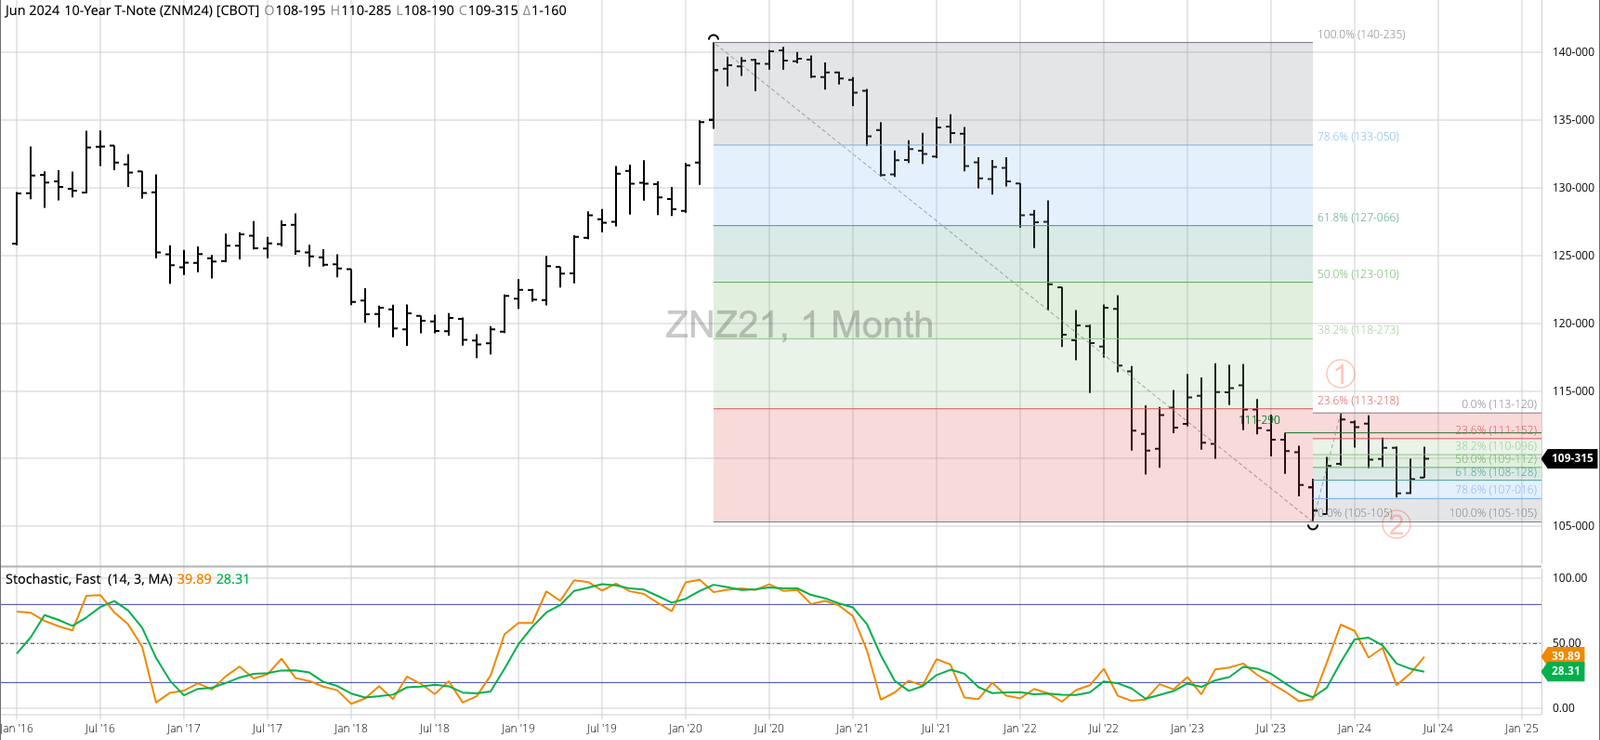
The idea of the Fed fund rate starting to come down fits with what I see on the long-term monthly chart for US 10-year Treasury note futures (ZNU24). The market has been in a major (long-term) 5-wave (Elliott Wave) uptrend since completing a bullish 2-month reversal during October and November 2023, with Wave 1 peaking at the December 2023 high of 113-120 and Wave 2 bottoming at the April 2024 low of 107-040. If the market is in Wave 3, a move that could be confirmed by a new 4-month high beyond 111-175 (March 2024), then the nearby futures contract would be expected to take out the Wave 1 peak over the course of time. Fundamentally this makes sense, as Treasury prices go up as yields go down in association with lower interest rates.

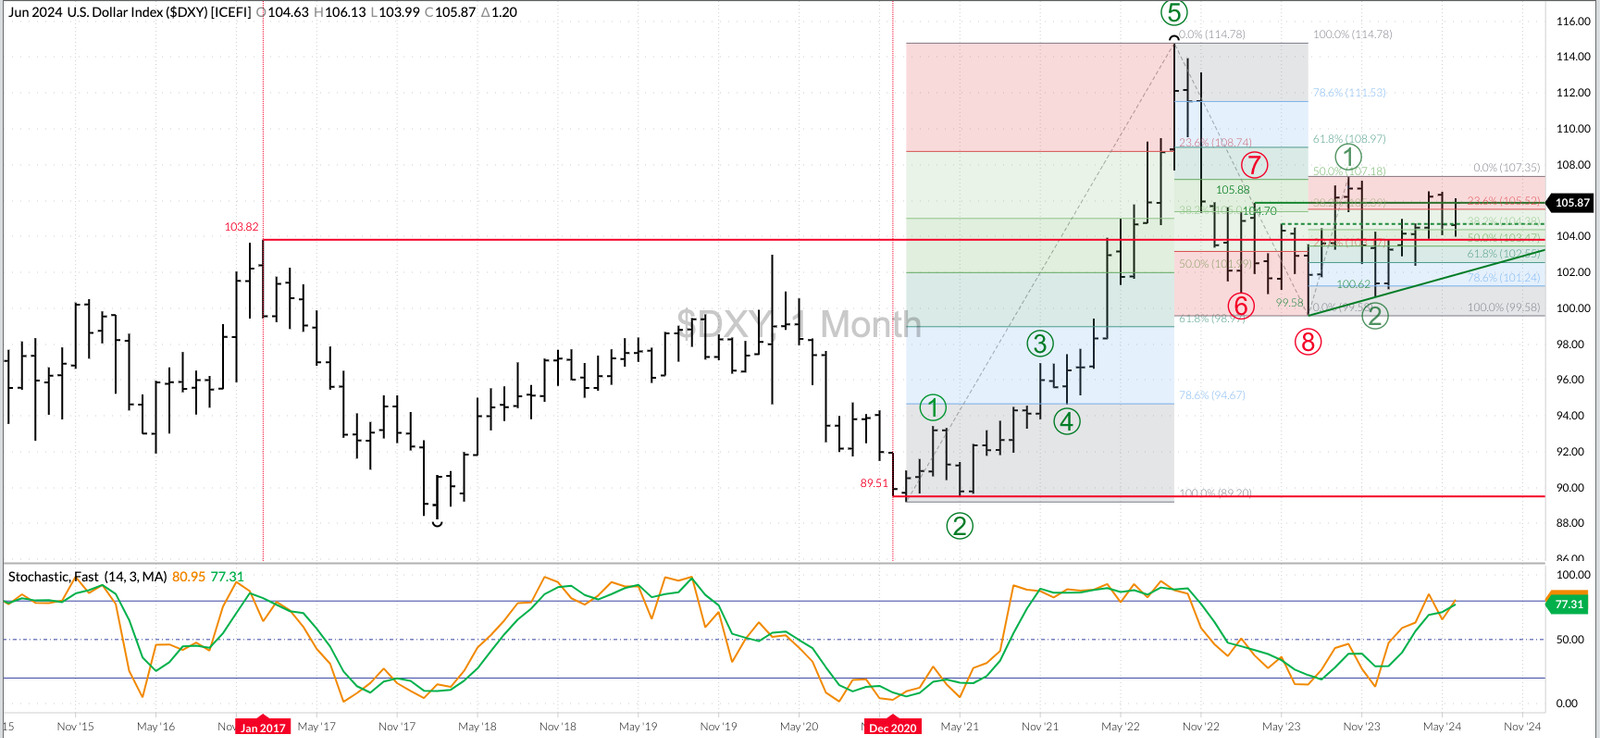
Then comes the US dollar index ($DXY). Again, interest rates are a key fundamental of any currency’s strength and/or weakness (the exception being crypto currencies), so if the FOMC is expected to lower rates then the US dollar index should be in a long-term downtrend. A look at the greenback’s monthly chart shows that to not be the case, as instead of moving counter to 10-year notes the trends look similar. The USDX appears to be in Wave 3 of its major uptrend, meaning it is expected to take out the Wave 1 high of 107.35 (October 2023). That doesn’t seem to fit the overall financial market scenario, though, unless it is telling us not to get ahead of ourselves when it comes to expected interest rate cuts.

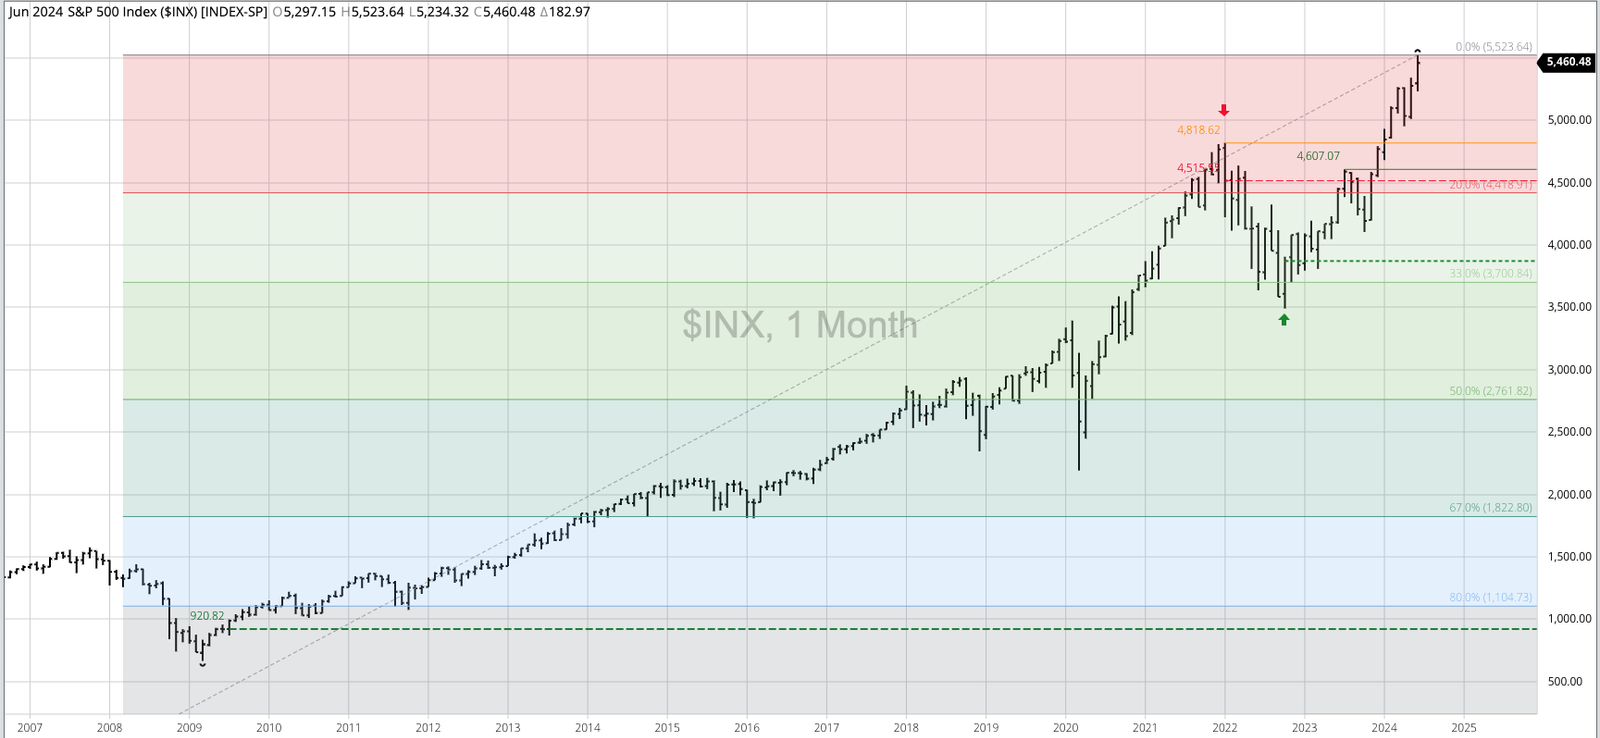
As for the S&P 500 ($INX), and US stock markets in general, the long-term trend remains up. This has been the case since major bullish reversals were completed at the end of October 2022 when the S&P 500 closed at 3,871.98. June 2024 saw the Index close at 5,460.48, a gain of 41% despite the fact interest rates have not been trimmed. Historically, US stocks move higher as interest rate cuts are made, so is there more room to the upside? The S&P 500’s monthly chart looks top-heavy, but that isn’t unusual as the index extends its major uptrends. I know the Chicken Littles on one side of the political aisle in the United States continue to squawk about how the sky is actually falling, despite evidence to the contrary. On the other hand, depending on what happens between July 31 and October 31, the good times could really be over for good in the not-too-distant-future.
As for the commodity sector, the end of June found the 3 Kings of Commodities showing different long-term trends:
- The cash index for Gold (GCY00) was still in an uptrend, technically, though consolidating below its recent high of $2,449.34. Momentum indicators are telling us the uptrend is nearing its end, a move that fits more with the uptrend in the US dollar index extending rather than interest rates coming down and 10-year T-notes moving higher.
- WTI Crude Oil (CLQ24) is trending sideways, with possible bullish technical patterns offset by a bearish seasonal timeframe from the end of June through late December.
- Corn is in a major downtrend, with the Dec24 contract (ZCZ24) extending the move that began at the conclusion of May 2022 to a low of $4.13 during June 2024.
We’ll see what happens as the next quarter could be interesting for investment traders.
Postscript: I want to thank all of you in the BRACE Industry[i]. You hysterics (I’ve seen words like “Epic!” and “Surprising used almost nonstop) following the latest USDA quarterly Grain Stocks and Acreage reports were invaluable to those of us who actually pay attention to markets. It increased the advantage in hedging/investing/trading we already had. I’ll use the quote from the late Charlie Munger I had in a previous piece, “It is remarkable how much long-term advantage people like us have gotten by trying to be consistently not stupid, instead of trying to be very intelligent”.
[i] BRACE = Brokers/Reporters/Analysts/Commentators/Economists. While not all in those professions fall into this group, a large percentage do. There are two telltale signs: 1) Regurgitating USDA numbers and 2) Ignoring reality so everything is always bullish.
More Stock Market News from Barchart
On the date of publication, Darin Newsom did not have (either directly or indirectly) positions in any of the securities mentioned in this article. All information and data in this article is solely for informational purposes. For more information please view the Barchart Disclosure Policy here.
The views and opinions expressed herein are the views and opinions of the author and do not necessarily reflect those of Nasdaq, Inc.
