
GeorgePeters
Introduction
40% per year.
That’s the average return of James Simons’ Medallion fund from 1988 through 2023.
On May 10, the mathematician-investor died at the age of 86 after he had become the most successful hedge fund manager in history.
To put things in perspective, Mr. Simons, who had an estimated net worth of roughly $32 billion when he died, had an annual return of roughly 4x the S&P 500. The chart below shows some of his returns through 2016, including the Institutional Equities Fund his firm started.

Bloomberg
Technically speaking, this would have turned a $100 investment into $139 thousand during these 35 years. That’s the average price of a new Porsche – and you would still have $10 thousand left!
I’m bringing this up for one very specific reason.
Mr. Simons wasn’t just an outlier. As it turns out, hedge funds, in general, are increasingly reporting poor returns.
When people think of hedge funds, they always think of an exclusive club of people with better intel, better resources, and better performances.
They are only partially right.
While I would be lying if I said I had a lot of experience with hedge funds, I did spend the start of my career in a team that advised a hedge fund. They absolutely have better connections, better data, and ties with the most powerful people in the world.
It truly is a very exclusive club.
But it’s not a club that you have to be a part of to make money.
Bloomberg just published a piece titled “Hedge Funds Are Just Too Big to Beat the Market.”
According to the article, in the early 2000s, hedge funds were generating elevated double-digit returns each year. Over the past ten years, they have been rather mediocre.

Bloomberg
Their main problem is capacity.
Or, to put it in more simple terms, the market does not offer enough opportunities for elevated gains for the “average” hedge fund to make money.
In the early 2000s and before, hedge funds were rather small, which allowed them to bet on specific opportunities.
They became so successful that it turned into a multi-trillion business segment.
The result was that a ton of money started to chase opportunities for outsized returns. It didn’t work anymore.
For example, let’s say you run a $50 million hedge fund. You can invest in small companies and potentially make a lot of money. A $10 billion hedge fund cannot do that. It would have to make too many small bets to get similar returns, risking an average total return.
Moreover, according to the article, hedge funds are unlikely to address that issue.
Why?
That’s because hedge funds make money from fees. If you’re paid 1% of assets under management, you want to run a big fund. After all, AUM fees are guaranteed. Performance fees are not.
Nonetheless, hedge funds still had one major benefit. They usually had better risk/adjusted returns than the S&P 500. While their returns may have been lower, they also came with subdued volatility.
Unfortunately, because the S&P 500 only went up since the Great Financial Crisis, nobody cared about that either. I’m painting with a broad brush here, but I think you get the idea.
This was when multi-strategy hedge funds became popular. These are funds that spread their bets over multiple hedge funds and assets. This increases the odds of buying at least one huge winner.
Unfortunately, it didn’t work out. While volatility was superior, the performance lagged the S&P 500 by a wide margin.

Bloomberg
Unsurprisingly, the past ten years weren’t kind to the industry, as North American hedge funds saw net inflows of less than $5.0 billion.
This also explains why James Simons’ Medallion fund limited its own size and returned everything beyond the limit that was estimated to be $10 billion.
The fund sacrificed assets under management fees for the sake of performance fees. As we have seen over the past few decades, that worked out wonderfully for all parties involved.
That said, in general, one thing has become very clear: you don’t have to be involved in a hedge fund to beat the S&P 500. In fact, you may be better off not investing in the “average” hedge fund.
This is also my segue to present three fantastic dividend (growth) stocks that I expect to allow investors to beat the market (and the average hedge fund!) for many years to come.
I own one of them and have the other two on my watchlist.
Let’s start with the one I own!
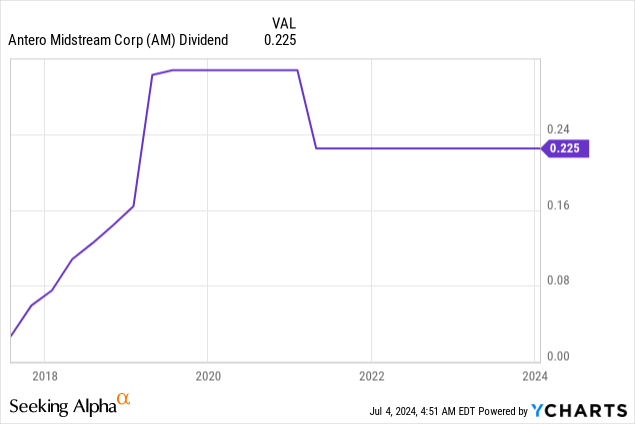
Antero Midstream (AM) – A High-Yield Midstream Gem
Antero Midstream is the first new company I bought earlier this year. In fact, I bought it with the proceeds of the sale of my stake in Duke Energy (DUK). As much as I like DUK (this is not a call to sell it), I wanted to own a different kind of infrastructure.
Antero Midstream was featured in one of my articles titled “My Favorite 4: How I’m Building A Superior Energy Portfolio:”
In that article, I explained the benefits of owning midstream assets, which own pipelines and other assets to support oil and gas production. While these companies are usually not the best tools to bet on potentially rising commodity prices, they often come with elevated yields and low earnings volatility, as their income is tied to the throughput of pipelines and other processed volumes.
Although opinions may differ, I believe quality midstream assets belong in every portfolio that includes energy.
That said, Antero Midstream owns the midstream assets of Antero Resources (AR), one of North America’s biggest natural gas producers. Antero Resources produces in the Marcellus Basin, the best place to be for low-cost natural gas production and deep reserves in the United States.

Antero Midstream
Antero Resources also has one of the best cost profiles in North America, allowing the company to produce gas when others are forced to cut in an environment of subdued prices.
These operations are supported by Antero Midstream, which owns more than 400 miles of low-pressure pipelines, 230 miles of high-pressure pipelines, and 4.5 billion cubic feet of daily compression capacity. It also owns roughly 380 miles of water pipelines.
Another benefit is that Antero Midstream owns an increasingly mature asset base, which reduces capital expenditure requirements and increases free cash flow.
Since early 2022, the company has reduced its net leverage ratio from 3.6x to 3.1x EBITDA and increased post-dividend free cash flow.

Antero Midstream
After a few tough pre-pandemic years, the company is now in such a good spot that it has enough free cash flow to cover and grow its dividend, reduce debt, and spend money on acquisitions.
As you can see, after the initial outspend to fund the drilling partnership growth in the first half of 2022, we transitioned to generate consistent free cash flow after dividends. The first quarter represented the seventh consecutive quarter of generating free cash flow after dividends, which totaled almost $270 million on a cumulative basis. This has been used to reduce absolute debt and internally financed two highly accretive bolt-on acquisitions – AM Q1’24 Earnings Call (emphasis added)
For example, due to acquisitions, the company now has room to significantly grow its compression capacity. Currently running at 95-100% utilization, recent acquisitions allow for a substantial increase in compression capacity.

Antero Midstream
With regard to shareholder returns, the company has a 3.0x net leverage goal. Once that goal has been reached, it will start growing the dividend and use buybacks to improve the per-share value of its business.
According to analyst estimates, that goal can be achieved at the end of this year. This bodes well for shareholders, as the same analysts expect more than $700 million in 2025 free cash flow, roughly 10% of its market cap.
This protects its 6.1% dividend yield and creates a lot of room for buybacks.
After a few challenging years, I expect the future to be bright, with consistent dividend growth, buybacks, and opportunistic M&A to gradually increase the company’s footprint and capabilities in the Appalachian region.
It also helps that AM trades at just 8.8x operating cash flow. A return to its normalized 10.4x multiple would unlock a potential stock price of $19, roughly 30% above its current price.

FAST Graphs
Given the mix of income and growth in a market with a lofty valuation, I have little doubt that AM is in a great spot to deliver long-term alpha.
The second pick does not come with a high yield. However, it perfectly embodies the low-volatility returns hedge funds seek.
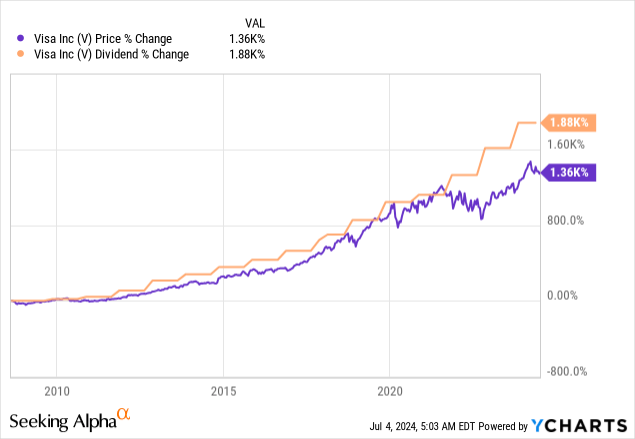
Visa (V) – Low-Volatility Dividend Growth
A 0.8% yield is nothing to write home about. A $10,000 investment will end up paying you $80 in pre-tax dividends. That won’t even cover a weekly trip to the grocery store for most families.
However, this dividend comes with a payout ratio of just 21% and a five-year CAGR of 15.9%!
Moreover, the only reason why the dividend yield is low is because capital gains offset dividend growth. Since Visa started paying a dividend in 2008, the dividend has been hiked by almost 1,900%. The stock price has soared by 1,360%.
It also has one of the best low-volatility profiles on the market, supported by a fantastic business model with plenty of long-term growth opportunities.
For example, during the most recent Annual Strategic Decisions Conference from Bernstein, the company highlighted a total addressable market of $200 trillion. This consists of $145 trillion in business-to-business and $55 billion in business-to-consumer, government-to-consumer, and peer-to-peer transactions.
Growth in this market is supported by partnerships and innovations like “Tap for Everything,” which allows consumers to use tap payments for a wide range of transactions.
It is also implementing AI, which it is using for fraud detection, risk management, and improving transaction efficiency.
Recent initiatives include a $100 million venture capital fund to support AI-driven startups and the development of data tokens to support consumers to control their data and personalize shopping experiences.
So far, this is translating into strong growth. In the second quarter of the fiscal year 2024, the company reported an 8% year-over-year increase in payment volume, with domestic U.S. growth at 6% and international growth at 11%.

Visa
Meanwhile, cross-border transactions surged by 16% year-over-year, and cross-border travel volumes were up 17%.
As a result, analysts expect the company to do what it does best: grow its earnings.
Using the FactSet data in the chart below, analysts expect 12-14% annual EPS growth through at least 2026, which would support its normalized P/E ratio of 27.0x (the blue line).

FAST Graphs
Currently trading at 27.8x earnings, I see a path to sustained double-digit returns and believe the stock remains one of the best low-volatility dividend growers to beat the market on a long-term basis.
With that said, stock number three is flying under the radar. It’s a dividend growth stock that, I believe, deserves a lot more attention.
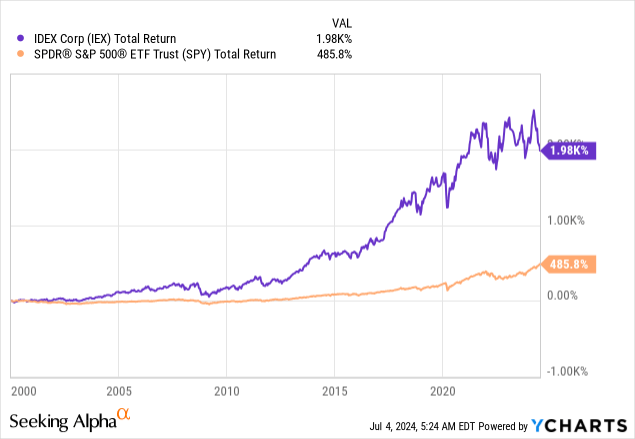
IDEX Corp. (IEX) – A Compounder You May Not Have Heard Of
Like Visa, the IDEX Corporation is a long-term compounder.
Since the year 2000, IEX has returned close to 2,000%, beating the S&P 500 by a huge margin.
However, there are at least two differences compared to Visa.
The first one is its yield. IEX yields 1.7%. This dividend also comes with a low payout ratio of just 33% and a five-year CAGR of 13.6%.
The second difference is its business model.
With a market cap of $15 billion, IEX is a cyclical industrial stock that recently saw some stock price headwinds.
As we can see below, since the leading ISM Manufacturing Index (orange line) peaked, the IEX stock price was unable to continue its impressive post-pandemic uptrend.

TradingView (IEX, ISM)
This makes sense, as IEX is a major supplier of highly engineered industrial and technology solutions for “mission-critical niches.“
In fact, the company is a serial acquirer, as it has a track record of countless acquisitions to improve its capabilities.

IDEX Corporation
Currently, the company serves countless markets, with a leading position in most niche markets. It generates roughly half of its sales in the United States, a quarter in Europe, and the remaining in the rest of the world.

IDEX Corporation
In the first quarter, the company explained it is actively improving its technical capabilities, mainly within its Health & Science Technologies segment to support cutting-edge sectors like AI-driven semiconductor technologies and low-orbit space broadband.
The company is also focusing on developing advanced technologies for national defense, which makes sense in the current environment.
Essentially, these initiatives are largely driven by inorganic growth through strategic acquisitions and aim to leverage the company’s balance sheet to expand growth in attractive markets.
That said, currently, cyclical headwinds are pressuring the company, as Q1’24 organic sales were down 6%. However, it still managed to grow free cash flow by 13% and guided for flat sales on a full-year basis.
This year, analysts expect the company to grow EPS by 1%, potentially followed by 10% and 9% growth in 2025 and 2026, respectively.

FAST Graphs
While it’s hard to say when cyclical growth will improve, I expect the company’s growth trajectory to significantly improve once the ISM Index starts to recover.
However, even in this environment, expectations are for 8-10% annual returns. Since January 2004, IEX returned 12.9% annually, making it a great long-term play to potentially beat the market.
Takeaway
James Simons’ Medallion fund achieved a mind-blowing 40% annual return over 35 years, turning $100 into $139,000.
Yet, despite this remarkable success, hedge funds, in general, have become somewhat overrated.
While they once came with double-digit returns, their performance has slowed due to their size, something James Simons overcame by limiting the size of his fund.
With that said, for most investors, beating the market doesn’t require hedge fund involvement.
Instead, consider high-quality dividend growth stocks like Antero Midstream, Visa, and IDEX Corporation.
These companies offer the potential for consistent returns, combining income with growth to potentially outperform the average hedge fund over the long term.