
In this blog post, we explore the most recent update of MSCI’s data universe of private-capital closed-end funds. We report the performance results for the major asset classes, detail the trends in distribution rates that have been a concern for limited partners in private-equity funds and examine the paucity of distributions from particular fund vintages.
Performance across global asset classes in Q1
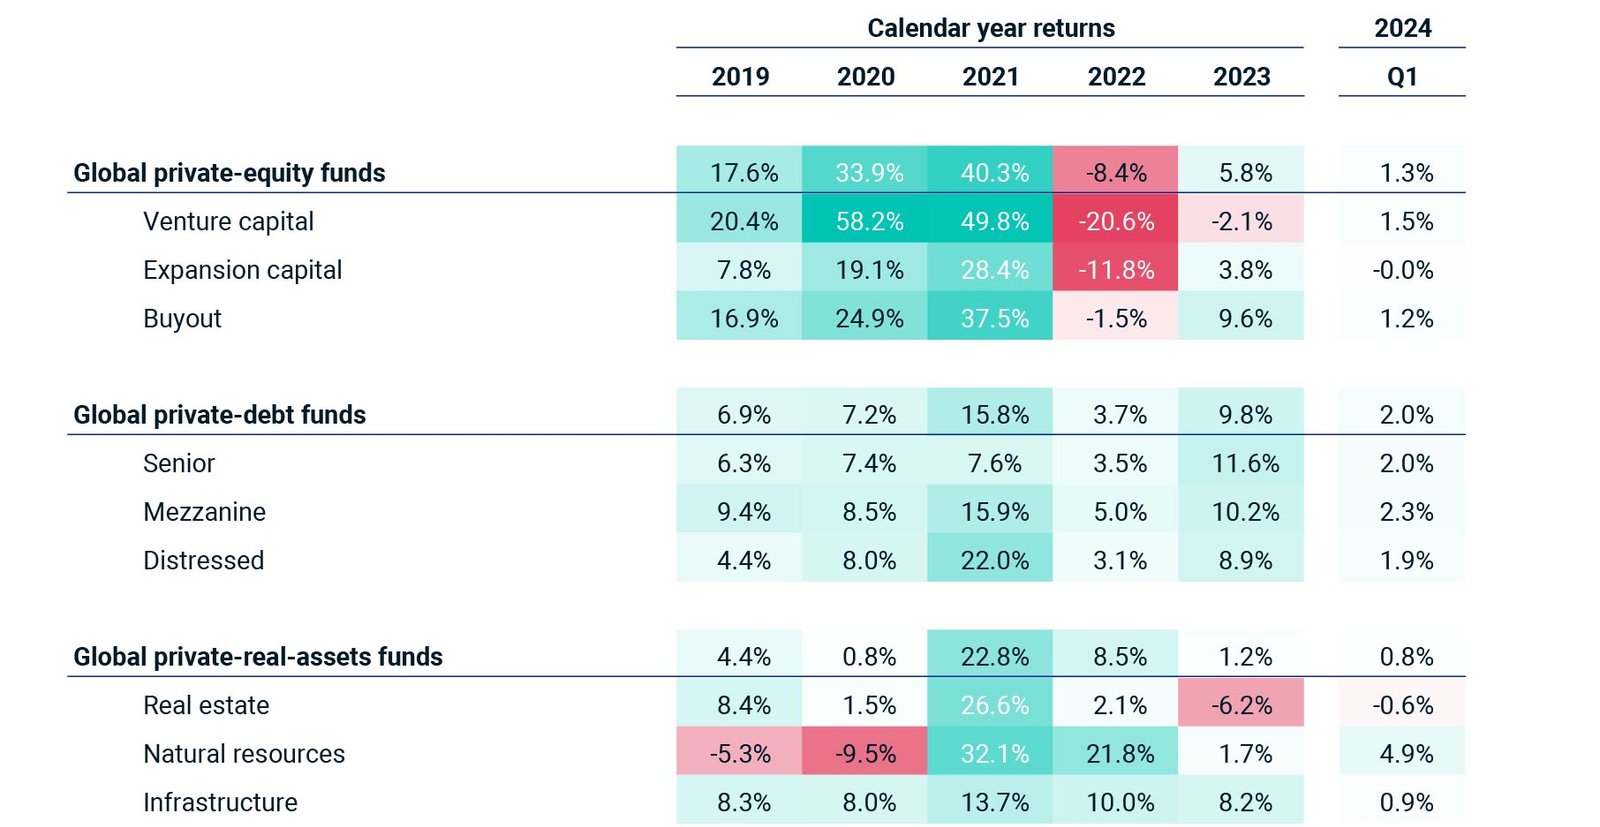
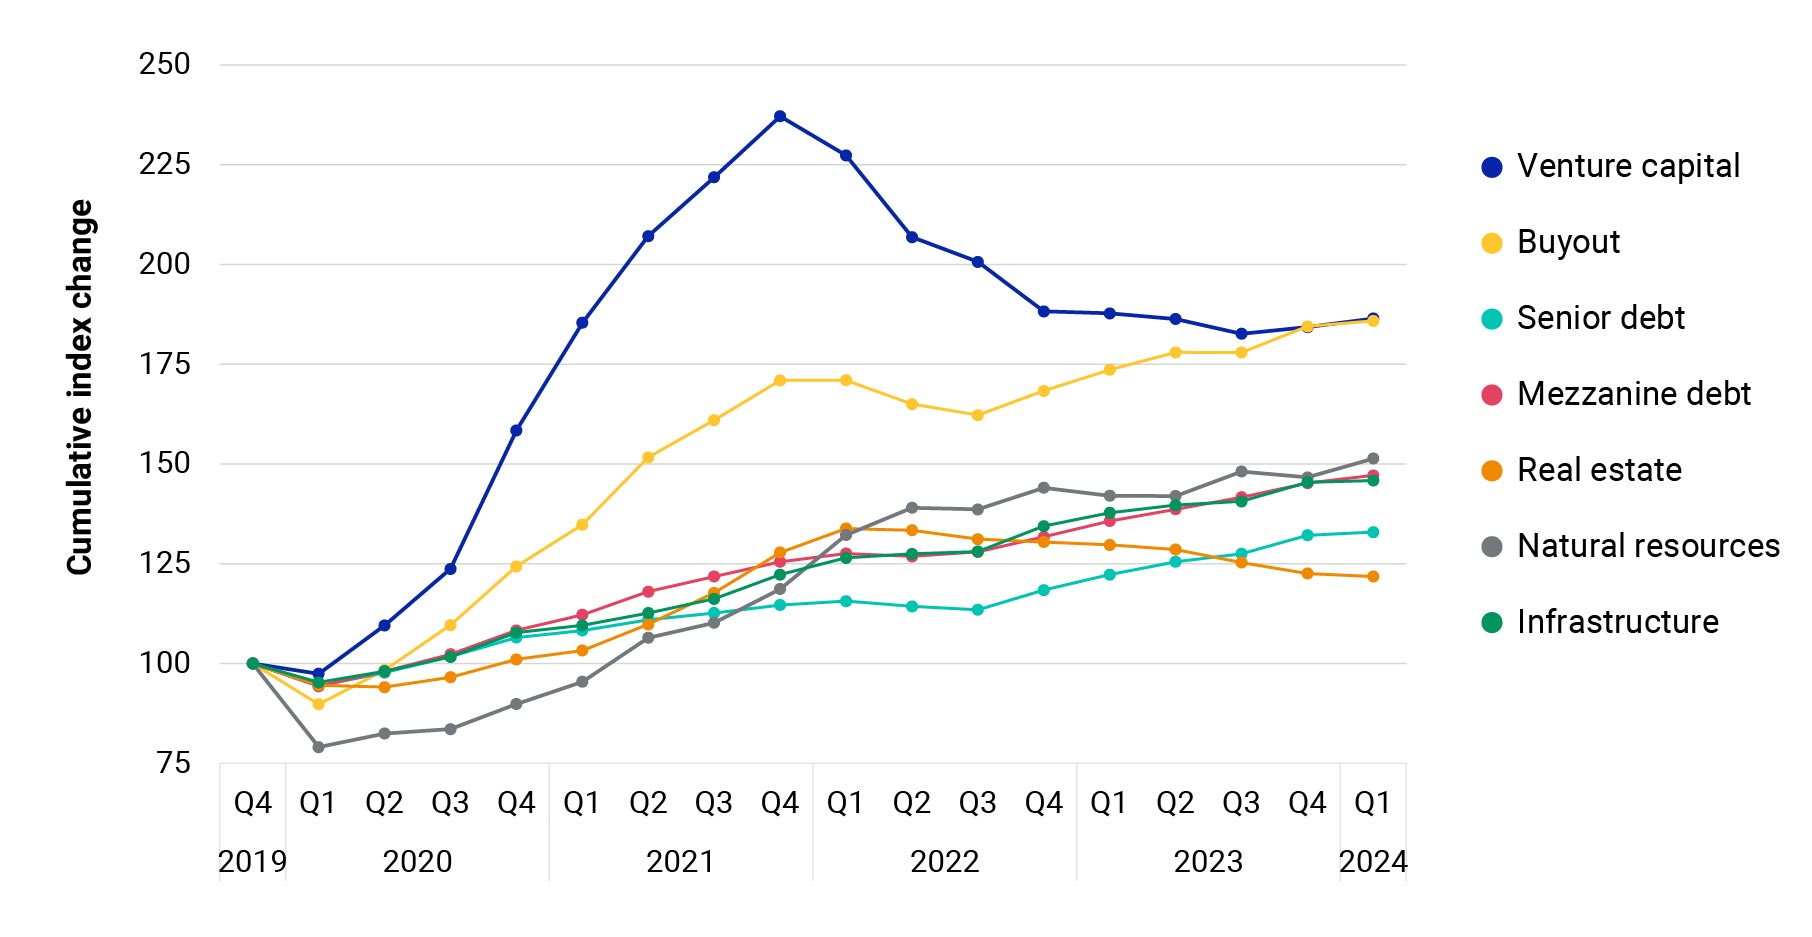
Venture-capital funds began 2024 with a positive quarterly return of 1.5%, outperforming buyout funds for the first time since 2021. With this quarter’s return, venture capital has outperformed buyout on a cumulative basis since the end of 2019 — albeit by just 0.6%.
Private-credit funds, which ended 2023 with the highest annual returns, remained among the strongest-performing asset classes. Senior-debt funds, mezzanine-debt funds and distressed-debt funds each returned between 1.9% and 2.3% during the quarter.
Real-asset funds showed mixed performance. While natural-resource funds posted a positive return of 4.9% and infrastructure funds returned 0.9%, real-estate funds registered an eighth consecutive quarterly decline as the commercial-property market continued to struggle.
Private-credit funds had highest returns in Q1
Venture capital has just outperformed buyout since 2019
Trends in distributions for private equity
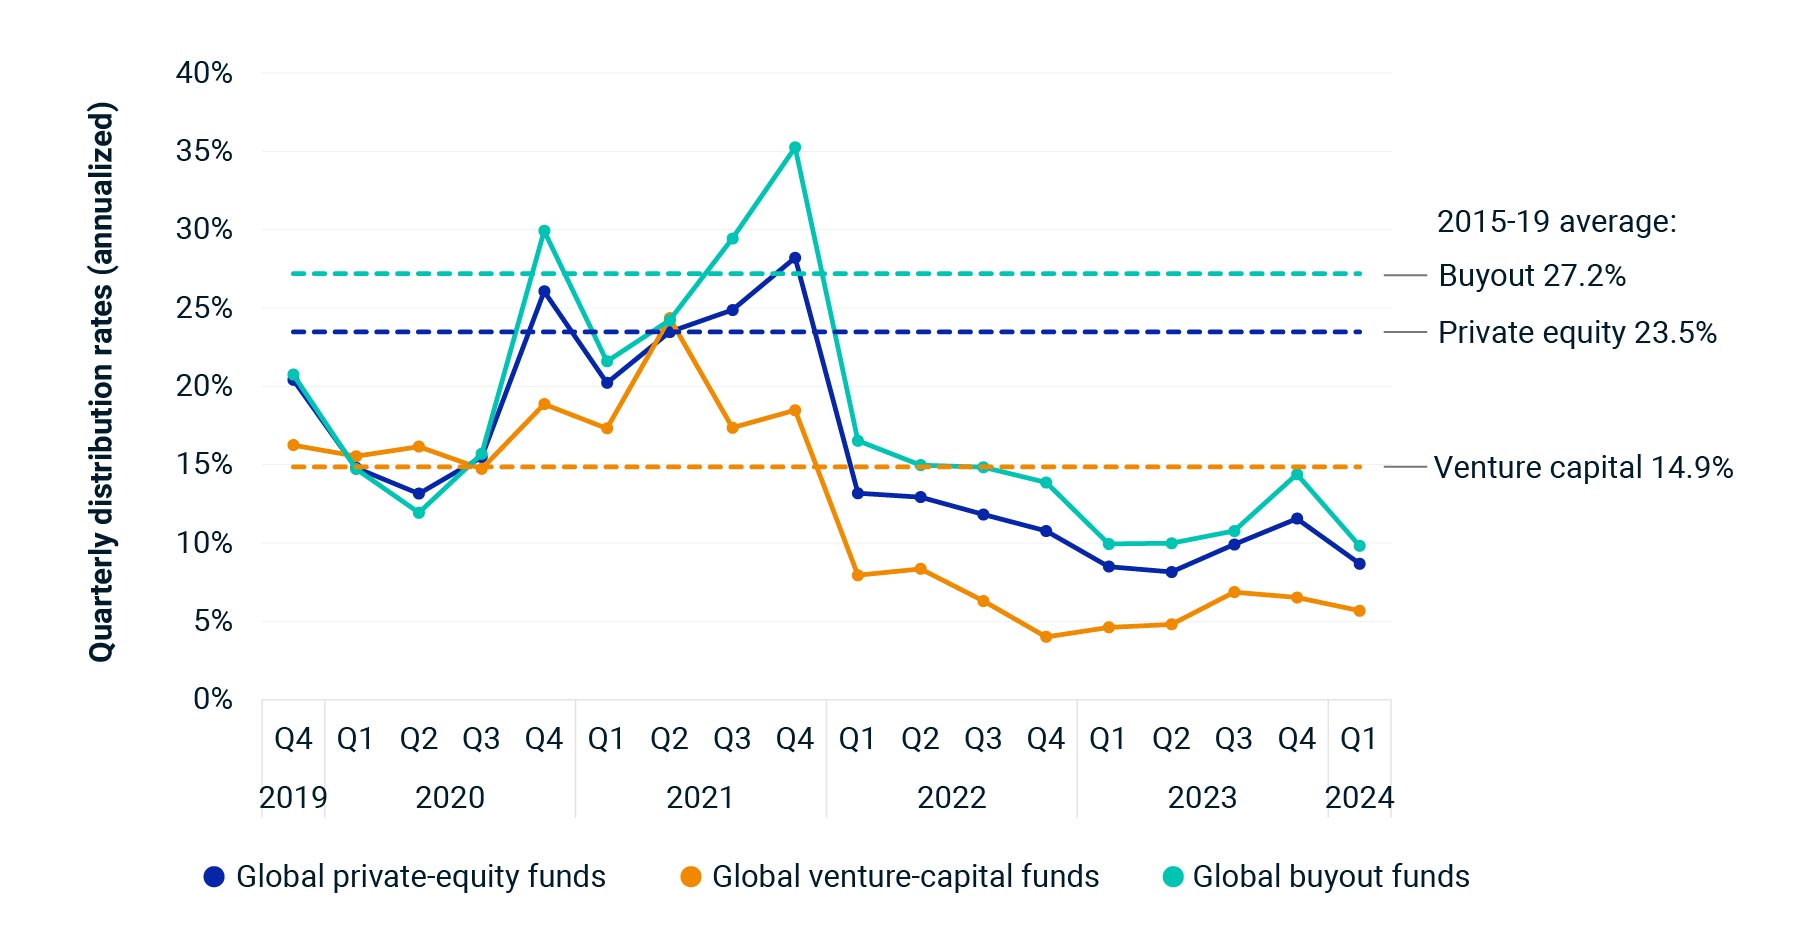
Distributions — or the lack thereof — have been a key topic for asset owners since they began to slow in 2022. Private-equity distributions during Q1 2024 were just 8.7% of valuation. While there is a seasonality to cash flows (with activity during the first quarter generally lower than the rest of the year), this distribution rate is a notable decline from the 11.6% level in Q4 2023 and back near the 8.2% lows from earlier in 2023. For 2015 through 2019, the distribution rate averaged 23.5%.
With the first quarter behind us, asset owners will now be looking to the ongoing second quarter to see if distributions can rebound on an upward trajectory as at the end of 2023 or whether the start of the year was a harbinger of continued sluggishness. Unfortunately, early indications from the Q2 data show distributions will likely decrease. Further, preliminary data indicates that contributions increased during the quarter. This combination will likely exacerbate the net-cash-flow challenges afflicting the industry as asset owners are less able to fund new commitments from their existing portfolio.
Distribution rates of private-equity funds slowed
Mid-life vintages have stalled
While earlier in this blog post we examined distributions from the full universe of funds, the investment experience of the private-capital asset owner is based on individual funds, each of which is part of a vintage cohort that defines its investment and exit opportunities. These finite-lived funds typically draw down capital and make investments for their first five years and spend the next five (or more) years exiting these investments and distributing capital back to asset owners.
Under this basic model, the 2014 funds should be nearing the end of their harvest stage, whereas the 2019 funds will be just beginning this process. While each investment program has different allocations and different portfolios, asset owners generally rely upon distributions from mature vintages to fund new commitments.
The exhibit below shows the net-cash-flow curves for venture capital, buyout and private real estate (the asset classes most affected by the weaker exit markets), with all vintages from 2005 through 2023 included for historical context. The 2014-19 vintages are shown in shades of blue.
For some fund vintages, net cash flows have stumbled
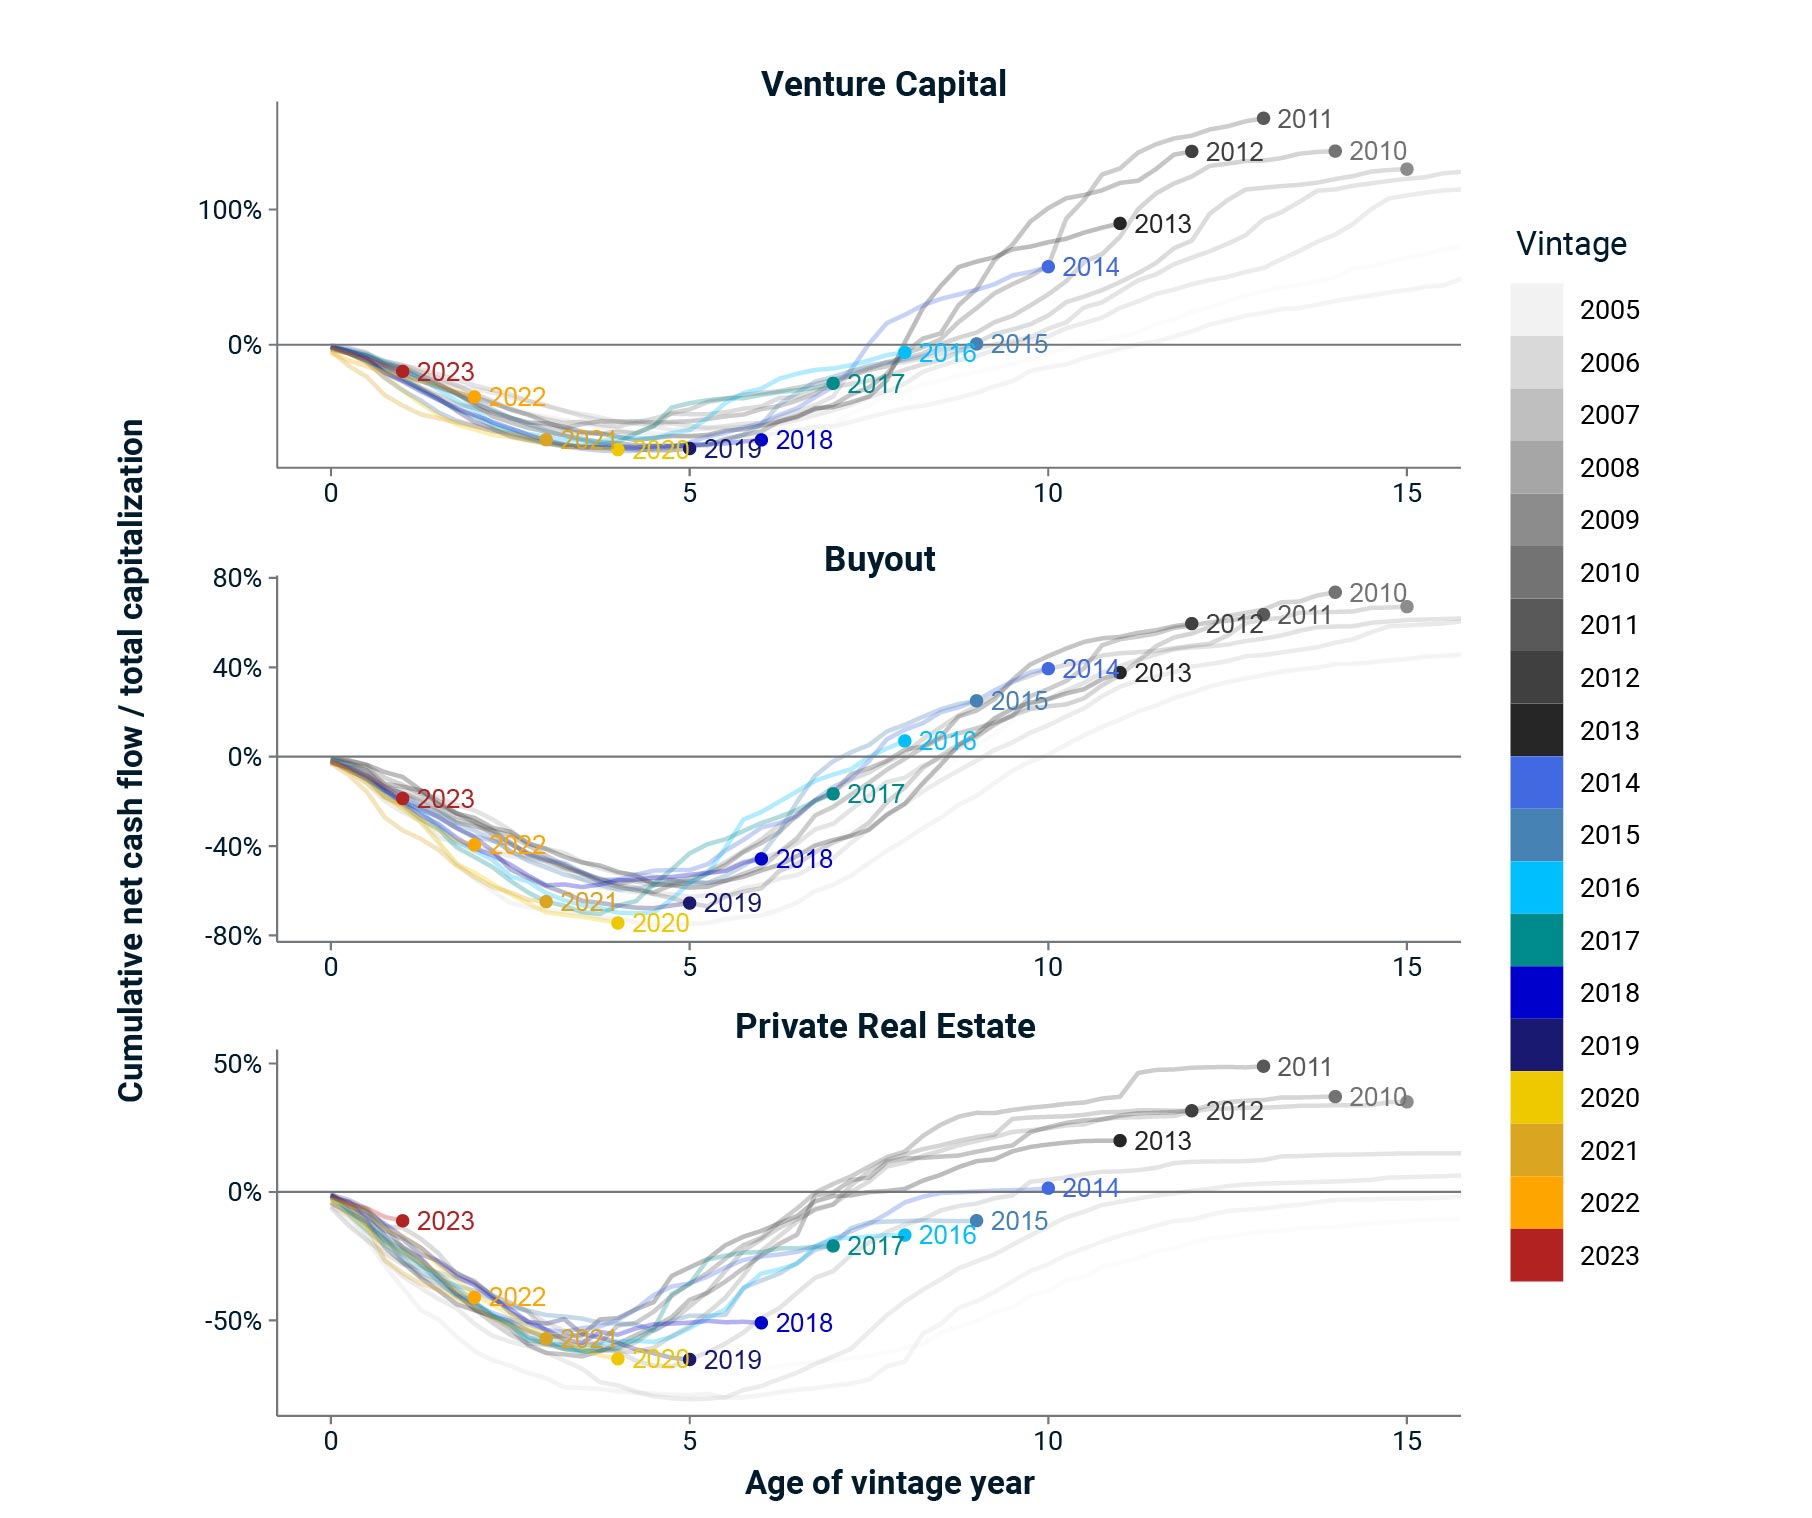
In venture capital, the net-cash-flow curves of 2015-17 funds have continued to flatten (i.e., return capital more slowly) as the strong exit markets of 2020-21 have given way to weaker exits in 2022 and later. The 2018-19 funds should have entered their harvesting years these past few quarters but have instead moved below the outer edge of the historical dispersion and are on track to return capital more slowly than any vintage since 2005.
While buyout funds have experienced the same general flattening in recent quarters, they have generally fared better than venture capital. The 2014-16 vintages remain at the upper edge of the dispersion (having returned capital more quickly than historical vintages), and the 2017-19 funds have slowed but remain in the middle of the dispersion.
This lack of distributions is most apparent in private real estate. The entire 2014-19 set of funds has stalled in the past few years as asset managers struggle to exit investments and asset owners are left waiting. While these vintages have still distributed more capital than some during the vintage years of the global financial crisis (some of which never reached cash-flow breakeven), these funds are tracking well below the 2009-13 vintages, which were generally able to reach cash-flow breakeven by year seven.
Looking ahead, the private-capital landscape remains uncertain as asset owners navigate through challenges such as a slowdown in private-equity distributions and the stalling of distributions from some venture-capital and real-estate fund vintages. Still, on the plus side, performance has generally been positive for most major private-asset classes since the lows of 2022.