

Simon Property Group (NYSE:SPG) has been analyzed by 5 analysts in the last three months, revealing a diverse range of perspectives from bullish to bearish.
The following table provides a quick overview of their recent ratings, highlighting the changing sentiments over the past 30 days and comparing them to the preceding months.
| Bullish | Somewhat Bullish | Indifferent | Somewhat Bearish | Bearish | |
|---|---|---|---|---|---|
| Total Ratings | 0 | 0 | 5 | 0 | 0 |
| Last 30D | 0 | 0 | 1 | 0 | 0 |
| 1M Ago | 0 | 0 | 0 | 0 | 0 |
| 2M Ago | 0 | 0 | 2 | 0 | 0 |
| 3M Ago | 0 | 0 | 2 | 0 | 0 |
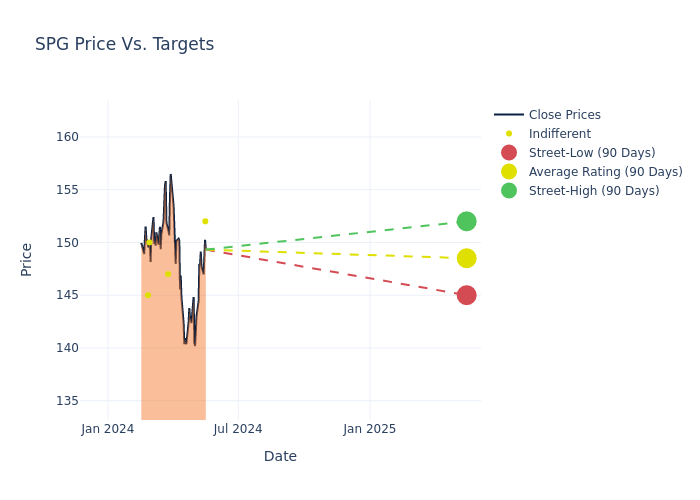
In the assessment of 12-month price targets, analysts unveil insights for Simon Property Group, presenting an average target of $148.2, a high estimate of $152.00, and a low estimate of $145.00. Observing a 5.11% increase, the current average has risen from the previous average price target of $141.00.
Investigating Analyst Ratings: An Elaborate Study
The analysis of recent analyst actions sheds light on the perception of Simon Property Group by financial experts. The following summary presents key analysts, their recent evaluations, and adjustments to ratings and price targets.
| Analyst | Analyst Firm | Action Taken | Rating | Current Price Target | Prior Price Target |
|---|---|---|---|---|---|
| Nicholas Yulico | Scotiabank | Raises | Sector Perform | $152.00 | $142.00 |
| Ki Bin Kim | Truist Securities | Raises | Hold | $147.00 | $139.00 |
| Ki Bin Kim | Truist Securities | Raises | Hold | $147.00 | $139.00 |
| Steve Sakwa | Evercore ISI Group | Raises | In-Line | $150.00 | $142.00 |
| Ronald Kamdem | Morgan Stanley | Raises | Equal-Weight | $145.00 | $143.00 |
Key Insights:
- Action Taken: In response to dynamic market conditions and company performance, analysts update their recommendations. Whether they ‘Maintain’, ‘Raise’, or ‘Lower’ their stance, it signifies their reaction to recent developments related to Simon Property Group. This insight gives a snapshot of analysts’ perspectives on the current state of the company.
- Rating: Delving into assessments, analysts assign qualitative values, from ‘Outperform’ to ‘Underperform’. These ratings communicate expectations for the relative performance of Simon Property Group compared to the broader market.
- Price Targets: Understanding forecasts, analysts offer estimates for Simon Property Group’s future value. Examining the current and prior targets provides insight into analysts’ changing expectations.
Capture valuable insights into Simon Property Group’s market standing by understanding these analyst evaluations alongside pertinent financial indicators. Stay informed and make strategic decisions with our Ratings Table.
Stay up to date on Simon Property Group analyst ratings.
Unveiling the Story Behind Simon Property Group
Simon Property Group is the second-largest real estate investment trust in the United States. Its portfolio includes an interest in 230 properties: 136 traditional malls, 69 premium outlets, 14 Mills centers (a combination of a traditional mall, outlet center, and big-box retailers), 6 lifestyle centers, and 5 other retail properties. Simon’s portfolio averaged $743 in sales per square foot in 2023 compared with $693 in sales per square foot over the 12 months before the pandemic. The company also owns a 21% interest in Klépierre, a European retail company with investments in shopping centers in 16 countries, and joint-venture interests in 33 premium outlets across 11 countries.
Financial Milestones: Simon Property Group’s Journey
Market Capitalization Analysis: With a profound presence, the company’s market capitalization is above industry averages. This reflects substantial size and strong market recognition.
Revenue Growth: Simon Property Group’s revenue growth over a period of 3 months has been noteworthy. As of 31 March, 2024, the company achieved a revenue growth rate of approximately 6.79%. This indicates a substantial increase in the company’s top-line earnings. When compared to others in the Real Estate sector, the company faces challenges, achieving a growth rate lower than the average among peers.
Net Margin: Simon Property Group’s net margin excels beyond industry benchmarks, reaching 50.72%. This signifies efficient cost management and strong financial health.
Return on Equity (ROE): Simon Property Group’s ROE stands out, surpassing industry averages. With an impressive ROE of 24.2%, the company demonstrates effective use of equity capital and strong financial performance.
Return on Assets (ROA): Simon Property Group’s ROA surpasses industry standards, highlighting the company’s exceptional financial performance. With an impressive 2.15% ROA, the company effectively utilizes its assets for optimal returns.
Debt Management: With a high debt-to-equity ratio of 8.5, Simon Property Group faces challenges in effectively managing its debt levels, indicating potential financial strain.
The Significance of Analyst Ratings Explained
Analyst ratings serve as essential indicators of stock performance, provided by experts in banking and financial systems. These specialists diligently analyze company financial statements, participate in conference calls, and engage with insiders to generate quarterly ratings for individual stocks.
Some analysts will also offer forecasts for metrics like growth estimates, earnings, and revenue to provide further guidance on stocks. Investors who use analyst ratings should note that this specialized advice comes from humans and may be subject to error.
This article was generated by Benzinga’s automated content engine and reviewed by an editor.