Starting 1 July, the Reserve Bank of New Zealand’s new
debt-to-income (DTI) ratios will change the game for
property buyers, capping borrowing at six times household
income (for owner occupiers) to curb excessive debt and
enhance financial stability. For property investors,
borrowing is capped at seven times your income. However,
analysis of average asking prices over the last 12 months
reveals significant variations in the household income
required to buy a home across the motu.
Based on
our 12-month national average asking price of $902,988,
property seekers will need a household income of $120,398.
Assuming a 20% deposit, this is calculated by dividing the
total loan amount of $722,390 by six, per the new DTI
regulations. This $120,398 is just $6,0411 less than the average
annual household gross income of
$126,411.
However, in many regions of New Zealand, the
significant gap between household incomes and what will be
required under the new DTI regulations is likely to be
challenging.
How will these new DTI ratios
impact Kiwis across the country? Which districts will be
hardest hit, and will any be immune to the
changes?
Location, location,
location
Queenstown was the most expensive
district in which to buy property, with a 12-month average
asking price of $1,953,091. Under new DTI requirements,
property seekers wanting to borrow the full 80% on property
in this region would need a minimum household income of
$260,412. Waiheke Island followed with an average price tag
of $1,901,507, requiring an income of $253,534. Wanaka,
Rodney and North Shore City rounded out the top five,
needing incomes between $175,544 and $245,381.
Advertisement – scroll to continue reading
Vanessa
Williams, spokesperson for realestate.co.nz, attributes the
high prices to lifestyle appeal:
“These
districts offer a blend of urban and rural lifestyle options
and, in most cases, are an easy boat ride, flight, or drive
to our main commercial hub of
Auckland.”
City of sails…and
sky-high property prices?
It’s not
just Waiheke Island, Rodney and North Shore City where
households need high incomes. Auckland City and Hauraki Gulf
Islands were just shy of the top five most expensive
regions, requiring minimum incomes of $171,447 and $167,076,
respectively, “With beautiful golden sand beaches,
inner-city living, and café culture, lifestyle is a
significant drawcard. Ultimately, buying a property is not
about choosing a home; it’s about choosing the life you
want to lead.”
Papakura, Waitakere City,
Manukau City & Franklin are the only four of nine
Auckland districts where the minimum required income fits
within Auckland’s annual gross income. Based on having a
20% deposit, property seekers will need a minimum household
income of $108,796 in Papakura, $119,841 in Waitakere City,
$132,111 in Manukau City, and $139,480 in Franklin. These
all sit below the Statistics
New Zealand reported annual gross income of $153,159 for
Auckland for the year ending June 2023.
Vanessa
notes that individual circumstances will vary:
“Opportunities can be found in every market. Property
seekers need to be patient, consider their expectations, and
seek advice from their local real estate agent.”
She
also notes that these regulations apply to household income;
therefore, purchasing via a syndicate or as a couple could
offer more opportunities.
New
Zealand’s lowest-cost regions
Prices vary
significantly across regions due to factors such as local
economic conditions, population density, and demand for
housing. At the affordable end of the spectrum, Bay of
Plenty’s Kawerau was the lowest-cost district, with a
12-month average asking price of $432,604. To meet DTI ratio
requirements and borrow 80%, an income of $57,681 per annum
is required. With average asking prices around $450,000,
Grey on the West Coast and Southland’s Gore came in a
close second and third, requiring household incomes of
around $60,000.
Otago’s Clutha and
Canterbury’s Waimate rounded out the bottom five,
requiring incomes of around $65,000 to secure a property
based on average asking prices in the
districts.
“According to Statistics New Zealand,
the average household income in the Otago region is $109,943
and in Canterbury it is $114,961. Buyers in these regions
may have more flexibility to go up a price
bracket.”
“Like the rest of the country, average
asking prices in both regions have remained fairly flat for
the last 18 months,” explains
Vanessa.
Should we expect a
slowdown from 1 July?
The new
regulations may reduce the number of buyers by limiting
their options. However, with high interest rates, Vanessa
doesn’t expect DTI ratios to start biting
immediately.
“Some Kiwis are unable to enter the
market currently due to high interest rates, and that will
likely continue to be the case.”
“The idea
of DTI ratios is to slow down the market and, ultimately,
help prevent people from getting into unmanageable debt,
which isn’t necessarily a bad thing. We will have to wait
and see what impact this has
overall.”
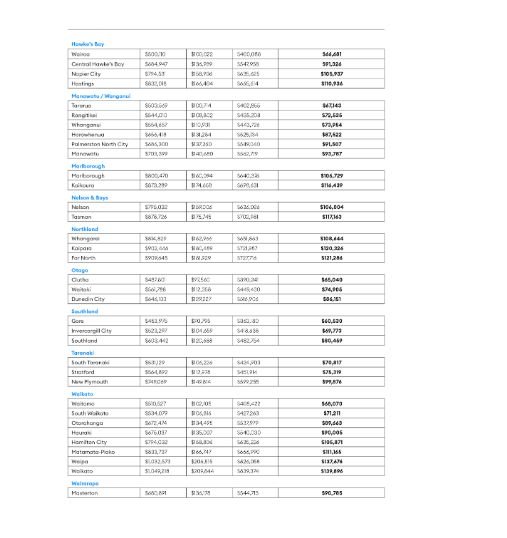
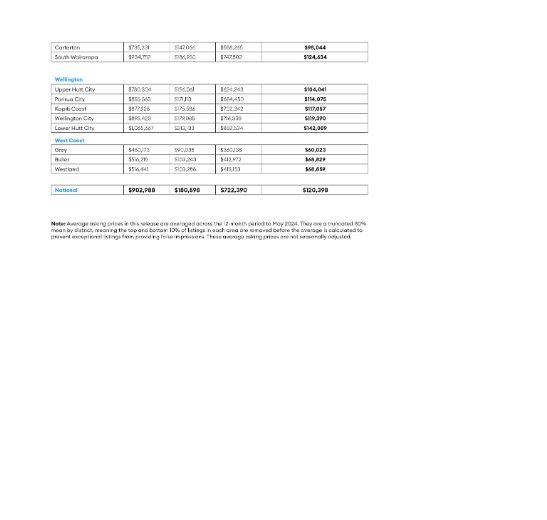
Curious if
your income stacks up against average asking prices in your
region? Check out the table below:


Note:
Average asking prices in this release are averaged across
the 12-month period to May 2024. They are a truncated 80%
mean by district, meaning the top and bottom 10% of listings
in each area are removed before the average is calculated to
prevent exceptional listings from providing false
impressions. These average asking prices are not seasonally
adjusted.
Glossary of
terms:
Average asking price
(AAP) is neither a valuation nor the sale
price. It is an indication of current market sentiment.
Statistically, asking prices tend to correlate
closely with the sales prices recorded in future months
when those properties are sold. As it looks at different
data, average asking prices may differ from recorded sales
data released simultaneously.
New
listings are a record of all the new
residential dwellings listed for sale on realestate.co.nz
for the relevant calendar month. The site reflects 97% of
all properties listed through licensed real estate agents
and major developers in New Zealand. This description gives
a representative view of the New Zealand property
market.
Stock is the total
number of residential dwellings that are for sale on
realestate.co.nz on the penultimate day of the
month.
Inventory is a measure
of how long it would take, theoretically, to sell the
current stock at current average rates of sale if no new
properties were to be listed for sale. It provides a measure
of the rate of turnover in the
market.
Seasonal
adjustment is a method realestate.co.nz uses
to represent better the core underlying trend of the
property market in New Zealand. This is done using
methodology from the New Zealand Institute of Economic
Research.
Truncated mean is the
method realestate.co.nz uses to supply statistically
relevant asking prices. The top and bottom 10% of listings
in each area are removed before the average is calculated to
prevent exceptional listings from providing false
impressions.
Advertisement – scroll to continue reading

