Sample demographics
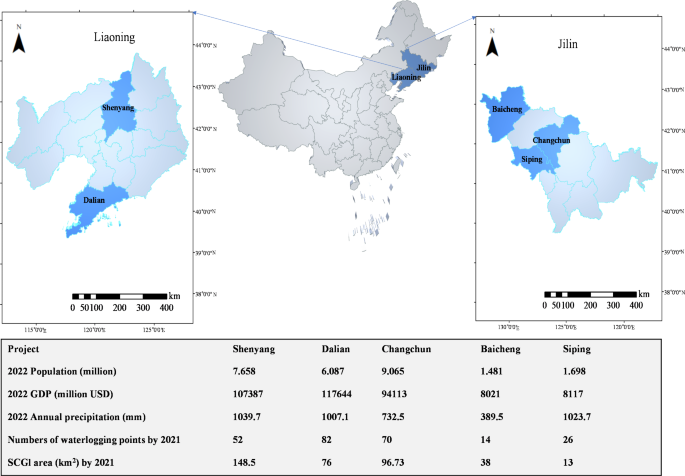
A total of 1,534 individuals from five distinct cities participated in the survey. The socio-demographic data gathered from these respondents has been analyzed and contrasted with the latest available statistics from 2021, as published by the Chinese National Bureau of Statistics (NBS)40. This comparison is concisely presented in Fig. 3.
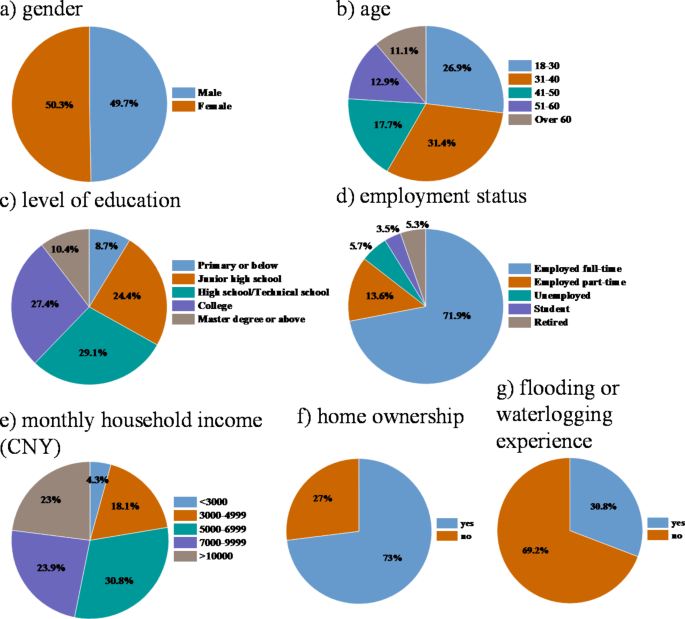
Socioeconomic profile of the 1534 respondents. (a) Gender, (b) Age, (c) Level of education, (d) Employment status, (e) Monthly household income (CNY), (f) Home ownership, (g) Flooding or waterlogging experience.
Figure 3(a) reveals that the gender distribution among the survey respondents is almost even, with males accounting for 49.7% and females for 50.3%. This closely aligns with the actual population proportions in the areas under study, as indicated by the NBS data. For instance, in Liaoning Province, the population is 49.92% male and 50.08% female. In Jilin Province, the proportions are 48.86% male and 51.14% female.
Figure 3(b) displays the age distribution of the survey participants, categorized into various age groups. Notably, a significant portion, nearly 60%, consists of individuals aged between 18 and 40. This is expected, as the online questionnaire was primarily completed by younger respondents. On the other hand, older respondents were more likely to participate in the in-person surveys conducted at selected locations. A direct comparison with the NBS data is not feasible, given that minors were not included in our survey. Consequently, and for the aforementioned reasons, our questionnaire evidently did not engage a substantial proportion of the population over 60 years old. While only 11.1% of our respondents are above 60, this age group represents more than 20% of the overall Chinese population.
Figure 3(c) depicts the educational levels of the survey respondents. In this sociodemographic aspect, we focused on individuals with higher education, as literature suggests that this group tends to be more engaged with policy matters and often exhibits a higher willingness to invest or pay. This approach aligns with the educational trends in the regions under study. Liaoning and Jilin Provinces rank 7th and 8th respectively among China’s 31 provinces in terms of education level. The Northeast has historically led the nation in educational attainment, and it remains one of the areas with the highest proportion of population with higher education. In Jilin Province, 16.64% hold a bachelor’s degree or higher, while in Liaoning Province, the figure is 17.56%. Given these premises, the educational level of the participants surpasses the regional average, with 37.8% holding at least a bachelor’s degree.
Figure 3(d) shows the employment status of the survey respondents. A direct comparison with the NBS data was challenging due to missing categories. Notably, only 5.3% of our respondents are retired, which is significantly lower than the pensioner population in Jilin Province at 16.4%, and Liaoning Province at 20.5%. This discrepancy may be attributed to the survey’s online distribution and in-person locations, which may have limited accessibility for the older demographic.
The monthly net household income analysis presented in Fig. 3(e) could not be directly compared with the NBS data. According to the 2022 statistics from the Statistics Bureau of Jilin and the Liaoning Provincial Bureau of Statistics41, the average monthly wage in Jilin Province is 6,655 CNY, with an average monthly pension for retirees at 2,850 CNY, and a minimum wage standard of 1,880 CNY. In Liaoning Province, the average monthly wage stands at 6,843 CNY, the average monthly pension is 3,198 CNY, and the minimum wage is set at 1,910 CNY. The income categories in the survey were determined based on these real-world figures from both provinces.
Figure 3(f) details home ownership, showing that 73% of the respondents own local housing, while 27% do not. According to the NBS data, the rate of home ownership in various cities within Jilin and Liaoning Provinces exceeds 70%. Therefore, the survey results fall within a reasonable range.
Figure 3(g) presents data on the respondents’ experiences of property damage due to flooding or waterlogging. According to the survey, 30.8% of respondents have experienced property losses due to flood disasters, while 69.2% have not. Although the northern regions of China, including the Northeast, receive less rainfall than the southern regions, with an average annual precipitation of around 800 mm, the Northeast has faced increasing challenges in recent decades. Factors like frequent extreme weather events, rapid urbanization, and aging drainage infrastructure have led to issues such as urban flooding, waterlogging, and non-point source pollution. These disasters have resulted in significant damage to houses and vehicles, and in more severe areas, there are threats of landslides and mudflows, endangering lives.
Respondents’ knowledge of SCSM
The second part of our survey was dedicated to assessing perceptions and knowledge regarding SCSM and preferences for the benefits of SCGI ecosystem services. It was found that a majority of respondents (59.6%) were familiar with the concept of SCSM, while 40.4% reported a lack of understanding. As outlined in Table 1, we conducted a Chi-squared test to statistically analyze the relationships between socio-demographic and socio-economic factors, homeownership, flood experiences, and awareness of the SCSM concept.
Our null hypothesis (H0) stated that there is no significant relationship between respondents’ knowledge of SCSM and variables such as gender, age, education level, income, current employment status, homeownership, and flood experience. We set a significance level of 95%; thus, if the p-value exceeded 0.05, we failed to reject H0, indicating no significant correlation. Conversely, a p-value less than 0.05 would lead to the rejection of H0. Our analysis revealed that, indeed, there is no statistically significant correlation between respondents’ knowledge with SCSM and their gender, age, education level, household income, homeownership status, or experience with flood waterlogging, as the p-values were all above 0.05.
Evaluation and analysis of the importance and influencing factors of potential ecosystem service benefits of SCGI.
The assessment of respondents’ preferences, as depicted in Fig. 4, indicated a clear prioritization of ecosystem services provided by SCGI, particularly in flooding and waterlogging mitigation, which was identified as the foremost benefit. Additionally, the capacity for water reuse was highly rated, reflecting a growing acceptance and positive perception of non-potable water reuse. This is particularly interesting given that people are often reluctant to embrace water reuse due to perceived health risks, psychological and aesthetic factors, cultural and social factors, and trust issues.
The positive perception observed in our survey may be attributed to several factors. First, there has been a significant shift in attitudes toward water conservation in urban areas, driven by the increasing recognition of the need to conserve freshwater resources. Cities and urban areas are major consumers of water, and as populations grow, the pressure on existing water supplies intensifies42. A continuing growth of population, coupled with a reduction in surface and groundwater resources over the past years, has heightened the demand for secure water supplies and the long-term sustainable management of water resources. The world’s population is expected to grow by 2–3 billion people by 2050, which will further increase the demand for freshwater. Additionally, by 2050, the urban population is projected to be about 2.9 billion more than in 2009 (3.4 billion), with urbanization occurring at the same rate as global population growth, plus migration from rural areas43. This growing demand has led to a greater emphasis on sustainable water management practices, including the adoption of decentralized water recycling systems for non-potable uses.
Moreover, advanced water treatment technologies have played a crucial role in making water reuse more acceptable to the public44. These technologies ensure that water is treated to a high standard, making it safe for various non-potable applications45. For instance, countries like Japan and Australia have successfully implemented non-potable water reuse systems that are well-integrated into daily life, providing benefits such as cost reduction, resource efficiency, and improved water security46. A study conducted on university students in Pretoria revealed their willingness to adopt recycled water systems for non-potable uses, especially if it would lead to lower bills47. In some Chinese cities, rainwater collected from rooftops is used not only for outdoor purposes like gardening, car washing, and firefighting storage but also for indoor uses such as flushing toilets48,49,50.
The services associated with SCGI’s regulatory functions received widespread acclaim, evidencing the community’s strong appreciation for their role in flood prevention and water management. Supportive services were also well-regarded, emphasizing the community’s value on biodiversity and its enhancement through SCGI. Notably, services directly impacting human welfare, such as flood control, freshwater supply, recreational opportunities, and aesthetic appreciation, garnered widespread recognition and value among the residents. This observation is consistent with analogous results found in other research studies51,52. However, it is noteworthy that more than 40% of respondents rated the restoration of wildlife habitat as “Not at all important,” and more than 20% responded similarly to pollination.
This trend might reflect a broader pattern observed in urban areas, where residents often prioritize services that have immediate and visible benefits to human well-being over those with more indirect effects. For instance, concerns about potential negative impacts, such as an increase in mosquitoes, unkempt aesthetics, and physical safety issues, have been observed in other contexts, such as in Toronto, Canada, where residents worried that brownfield conversions to green infrastructure might expose children to contamination from unknown chemicals53. Similarly, a study found that urban populations tend to undervalue ecosystem services that are less directly connected to their daily lives, such as pollination and wildlife habitat restoration, due to a lack of awareness about their critical roles in maintaining long-term ecological health54. Furthermore, in a review of studies on public attitudes towards the ecosystem service benefits generated by green infrastructure, it was found that in 77% of the studies, people were surveyed or interviewed about their attitudes towards these benefits. The most frequently discussed values were functional aspects like flood protection and water quality improvements, along with aesthetic, health, and safety benefits. Less frequently mentioned were values related to the conservation of biodiversity and financial aspects like property value55. This aligns with our findings, suggesting that services such as wildlife habitat restoration and pollination, which are crucial for the sustainability of ecosystem health but less directly connected to daily human experiences, are often undervalued.
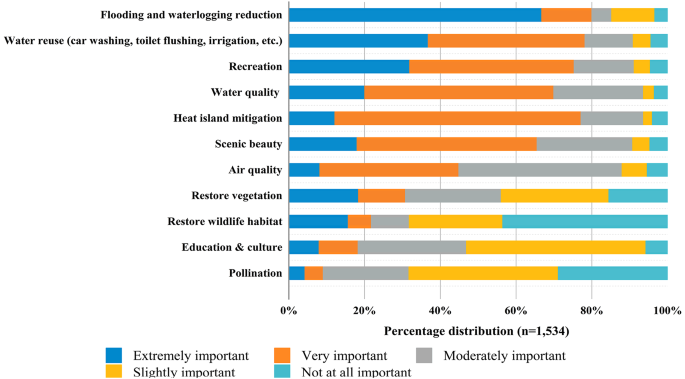
Respondents’ perceived importance of ecosystem service benefits provided by SCGI.
To examine the factors influencing public prioritization of the value attributed to ecosystem services by urban green infrastructure, we employed Pearson’s correlation analysis to discern the impact of socio-economic factors. Pearson correlation coefficients and their significance levels were calculated56.
This comprehensive analysis encompassed a range of socio-economic variables, including gender, age, education level, employment status, household income, homeownership, knowledge of SCSM, and experience of property damage due to flooding or waterlogging. The resultant heatmap presented in Fig. 5 delineates the interplay between the level of interest in ecosystem service benefits (rows within the heatmap) and the diverse socio-demographic categories (columns of Fig. 5). A notable finding was that homeownership exerted a statistically significant influence (p < 0.01) on the valuation of four specific ecosystem services: educational and cultural enrichment, water quality enhancement, aesthetic appeal, and flood control efficacy. This implies that individuals with higher homeownership status tend to place greater emphasis on these particular benefits. Moreover, the analysis uncovered a significant relationship between the experience of flood-related property damage and the valuation of flood control and drainage services—indicating that increased personal exposure to flooding correlates with a heightened concern for these services.
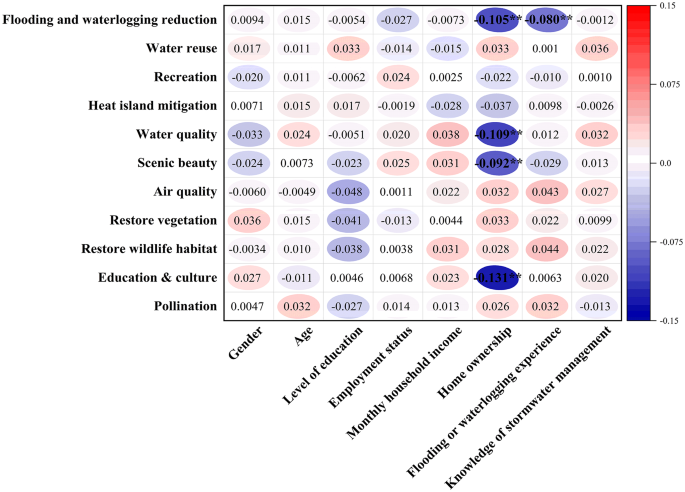
Heat map of correlation between socioeconomic variables and preference for ecosystem service benefits.
Analysis of public willingness to invest in SCSM construction and influencing factors
The final section of the study examined public willingness to invest in SCSM construction and the factors influencing this willingness. To ensure informed responses, an informational session with a concise overview of SCSM and SCGI was introduced prior to inquiring about investment intentions. This provided participants with essential knowledge about SCGI and its functionality. Subsequently, they were asked to make investment choices regarding SCSM projects. Among the 1,534 respondents, approximately 84.22% supported public investment in sponge city stormwater management projects, 56.71% expressed willingness to purchase green bonds if issued by the government, and 65.97% were agreeable to paying a specific stormwater fee to support these projects.
A logistic regression analysis was employed to explore the relationship between public investment willingness and various factors, including respondents’ demographic characteristics, property attributes, flood or waterlogging experiences, and knowledge of SCSM. The findings, detailed in Tables 2 and 3, and 4, revealed distinct significant influencers for the three types of investments, with statistical significance at the 10%, 5%, or 1% levels. The logistic model’s fit was assessed using the Hosmer and Lemeshow (H&L) statistical test57. This test’s null hypothesis assumes congruence between model predictions and observations; with H&L’s significance values exceeding 0.05 in all three models, this suggests acceptance of the null hypothesis, indicating a good model fit.
As illustrated in Table 2, a significant and positive correlation exists between respondents’ homeownership, experiences of property damage from flooding or waterlogging, and knowledge of stormwater management, and their willingness to support public investment (P < 0.01). Those with homeownership are more likely to back public investment, 88 times more than non-homeowners. Individuals who have experienced property damage due to flooding or waterlogging are 5 times more inclined to support public investment compared to those who haven’t. Moreover, respondents knowledgeable about stormwater management are 245 times more likely to support public investment than those without such knowledge.
Table 3 reveals that the willingness to invest in green bonds is influenced by a wider range of factors, including the ones mentioned above, as well as educational level and household income. Compared to those with primary education, individuals with junior high school, high school or technical school, and university education are 3, 2, and 7 times more likely to invest, respectively, while those with postgraduate education are 6 times more likely. Household incomes within the 7000–9999 and > 10,000 ranges are 9 and 11 times more likely to invest compared to the < 3000 income group. Homeowners’ willingness to invest is three times that of non-homeowners; those who have experienced flood-related property damage are twice as likely to invest; and those knowledgeable about stormwater management are 44 times more likely to invest than those without this knowledge.
Table 4 shows similar patterns in respondents’ willingness to pay additional stormwater fees, where educational level, household income, and knowledge of stormwater management are significant determinants. The educational levels of junior high and high school do not exhibit statistical significance (p > 0.1). In contrast, respondents with a university degree or postgraduate education demonstrate a willingness to pay that is 3 times greater than those with only primary education. Additionally, respondents with household incomes between 7000 and 9999 and over 10,000 exhibit a willingness to pay that is 13 and 17 times greater, respectively, compared to those earning less than 3000. Furthermore, respondents knowledgeable about stormwater management show a willingness to pay that is 26 times higher than those without such knowledge.