Chemical structure characterizations of Ru1/CeO2 and Run/CeO2 catalysts
The detailed synthesized processes of nanoflower-like CeO2 microspheres and Ru1/CeO2 catalyst were described (Supplementary Fig. 1). The atomically dispersed Ru1/CeO2 catalyst was synthesized using the GBMD method33, while the reference catalyst of supported Ru nanoparticles (NPs) on nanoflower-like CeO2 (Run/CeO2) was obtained through the gas bubbling-assisted membrane reduction method34. Inductively coupled plasma optical emission spectroscopy (ICP-OES) analysis revealed that the actual Ru loading amounts in Ru1/CeO2 and Run/CeO2 catalysts are 0.46 wt.% and 3.80 wt.%, respectively (Supplementary Table 1). The powder X-ray diffraction (XRD) patterns of all samples exhibit characteristic peaks of CeO2 nanocrystals with a cubic fluorite structure (JCPDS 34-0394). Notably, no characteristic diffraction peaks associated with Ru or RuOx NPs are detected, implying that the Ru species are highly dispersed on the surface of CeO2 (Fig. 1a). The lattice constant of CeO2 in the Ru1/CeO2 catalyst slightly decreases to 5.4084 Å compared to pure CeO2 (5.4101 Å) (Supplementary Table 1). This decrease is attributed to the substitution of Ce-sites on the surface lattice by smaller cation radius Ru ions (Supplementary Fig. 2). The SEM and TEM images provide a detailed view of the monodispersed nanoflower-like CeO2 microspheres, composed of single-crystal nanosheets (Supplementary Figs. 3a–d and 4). The thickness of these nanosheets is about 18 nm (Supplementary Fig. 5a, b), and the distance between two Ce atoms measures 3.1 Å, with clear step sites observed at the edge of the nanosheets (Supplementary Fig. 6).

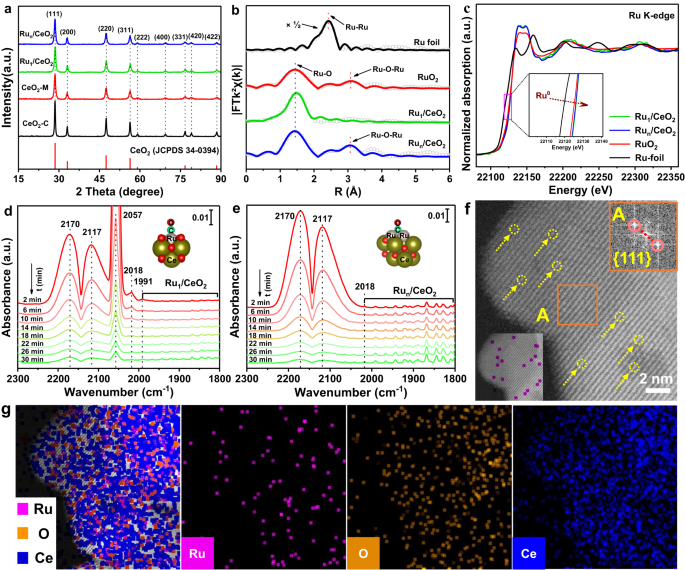
a XRD patterns of all samples and standard card of CeO2. b EXAFS fitting results in R space and the Ru K- edge for Ru1/CeO2 and Run/CeO2 catalysts with RuO2 and Ru foil. The shell radii (R) of Ru-O and Ru-O-Ru are marked. c The Ru K-edge XANES profiles. d and e In-situ DRIFT spectra of CO adsorption at 50 oC for the Ru1/CeO2 and Run/CeO2 catalysts with the extension of purge time (N2 flow, 30 mL min-1). f STEM-ADF image of Ru1/CeO2 catalyst with scale bars of 2 nm. The yellow circles represent atomically dispersed Ru sites. g STEM EDX mapping of Ru1/CeO2 catalyst (Purple, Ru; Orange, O; Mazarine, Ce).
In the N2 adsorption-desorption isotherms, all catalysts exhibit an H4 hysteresis loop in the P/P0 range 0.4-1.0, indicating the presence of a porous structure in the as-prepared samples (Supplementary Fig. 7a). The pore size distribution profiles of nanoflower-like CeO2, Ru1/CeO2, and Run/CeO2 catalysts all exhibit two peaks centered at 4.5 and 13.0 nm, in contrast to the single peak observed for CeO2-C at 8.0 nm (Supplementary Fig. 7b). The formation of these pores is attributed to the interwoven CeO2 nanosheets and stacked CeO2 nanoparticles (Supplementary Fig. 8a, b). To investigate the local electronic structure and coordination environment of Ru in the Ru/CeO2 catalysts, X-ray absorption measurements were conducted. The extended X-ray absorption fine structure (EXAFS) of Ru1/CeO2 shows only a primary peak at 1.49 Å, while the Run/CeO2 catalyst exhibits two peaks at 1.49 and 3.07 Å (Fig. 1b), corresponding to the Ru-O and Ru-O-Ru bond, respectively35,36. Further EXAFS curves fitting analyses provide insights into the coordination environment of Ru species in Ru1/CeO2 and Run/CeO2 catalysts, giving the coordination number of nearest-neighbor O atoms surrounding the isolated Ru atom (Fig. 1b and Supplementary Table 2). The coordination number of O atoms surrounding Ru atom in Ru1/CeO2 catalyst is 5.3, with a mean bond length of 2.01 Å, while the value of Run/CeO2 catalyst is 3.4, with the bond length of 2.04 Å. As a result, the atomically dispersed Ru species in the Ru1/CeO2 catalyst diffuse into the surface lattice of CeO2, forming coordination unsaturated Ru1O5 active sites. The atomic dispersion of Ru species in the Ru1/CeO2 catalyst is further corroborated by subsequent characterizations.
The X-ray photoelectron spectroscopy (XPS) spectra of Ru1/CeO2 and Run/CeO2 catalysts were acquired to determine the status of Ru species. The Ru 3p spin-orbit splits into 3p3/2 and 3p1/2 components, corresponding to the binding energy (BE) of 462.2 and 484.1 eV37,38. The two BE pairs (461.7 and 484.7 eV; 463.3 and 485.3 eV) corresponding to Ru 3p3/2 and 3p1/2 can be assigned to Ru0 and Run+ species, respectively (Supplementary Fig. 9)39,40. In the Ru1/CeO2 catalyst, the Ru 3p XPS only shows the oxidation state, indicating the presence of single positively charged Ru atoms. Conversely, the Ru 3p peak of the Run/CeO2 catalyst exhibits the coexistence of Ru0 and Run+ (4 ≤ n ≤ 6) species, attributed to the formation of a core-shell structured Ru@RuOx layer in Ru sub-nanometric particles (SNPs)41. This suggests that the Ru species in the Ru1/CeO2 catalyst consist of single-atom Ru with a positively charged feature, while the Ru species in Run/CeO2 catalyst contain a certain amount of metallic state. Furthermore, the Ru K-edge adsorption position of the near-edge X-ray absorption fine structure (NEXAFS) spectra over the Ru1/CeO2 catalyst is slightly higher than that of Run/CeO2 and RuO2 observed through local magnification (Fig. 1c). This observation indicates that the valence state of single-atom Ru species in the Ru1/CeO2 catalyst is higher than +4, consistent with the result obtained from the Ru 3p XPS analysis.
Diffuse reflectance infrared Fourier transform spectrum of CO adsorption (CO-DRIFTS) on noble metal catalysts is widely used to investigate the atomic and electronic structures of metal-support binding sites. In the case of Ru/CeO2 catalysts, CO-DRIFTS can differentiate between active Ru sites in single atoms and nanoparticles. The CO-DRIFTS spectrum of Ru1/CeO2 catalyst shows four strong adsorption peaks (Fig. 1d), whereas the spectrum of Run/CeO2 catalyst shows only two strong adsorption peaks (Fig. 1e). The strong adsorption peaks centered at 2170 and 2117 cm-1 are assigned to the R and P branches of the rotation vibrational spectra of gas-phase CO species42. The strongest peak centered at 2057 cm-1 is ascribed to the C-O stretching vibration of dicarbonyl CO species (Run+(CO)2) adsorption on single atomically dispersed Run+ sites43,44,45. The peak centered at ~2018 cm-1 can be assigned to C-O vibration of CO linearly bound Ru sites with high coordination46, while the peak at ~1991 cm-1 could be ascribed to the CO adsorbed on oxygen vacancies or Ru-doped CeO247. These findings indicate that the Ru species in Ru1/CeO2 catalyst exist as a single atomically dispersed ionic state, forming a Ru-O-Ce bond originating from the surface lattice site of CeO2, which has been substituted by a single Ru atom. On the other hand, the CO adsorption peak of the Run/CeO2 catalyst, centered at 2057 cm-1, is difficult to detect, but it demonstrates two weak bands at 1830 and 1860 cm−1, which can be attributed to the bridged adsorption of CO on two and three Ru atoms46,48, indicating the presence of Ru sub-nanometric particles (SNPs). With increasing purging time, the intensity of CO adsorption band on single atomic Ru sites decreases significantly, whereas that on Ru SNPs remains relatively unchanged. This suggests that the binding strength of CO to Ru1 is lower than that of Ru SNPs.
To further visualize the existence and dispersion state of the Ru species, aberration-corrected STEM images of the catalysts were obtained. Upon the introduction of the Ru species, Ru1/CeO2 catalyst maintains the initial nanoflower-like morphology of CeO2 (Supplementary Fig. 10a, b). The atomically dispersed Ru species in Ru1/CeO2 catalyst are faintly observed and coincided with the atomic lattice of CeO2 (Fig. 1f). The interplanar crystal spacing of CeO2 paralleled to the edge is 3.1 Å, as determined from the fast Fourier transform (FFT) pattern in the inset (A) of Fig. 1f, and corresponds to the exposed CeO2 (111) crystal facets. STEM images and corresponding Energy-dispersive X-ray (EDX) element mapping of the Ru1/CeO2 catalyst demonstrate the homogeneous dispersion of single-atom Ru species on the surface of CeO2 support (Fig. 1g). In contrast, the Ru species in Run/CeO2 catalyst exhibit a certain degree of aggregation and form small Ru SNPs (Supplementary Fig. 11a, b). The size distribution and EDX element mapping analysis in STEM-ADF images show the uniformed dispersion of Ru SNPs (d = 0.9 ± 0.2 nm) deposited on the surface of CeO2 nanosheets (Supplementary Fig. 12). Based on the results of EXAFS, in-situ CO-DRIFTS and STEM characterizations, it is evident that the state of Ru species in Ru1/CeO2 catalyst is predominantly isolated single-atom dispersion, occupying the surface lattice sites of CeO2 nanocrystals to form Ru1O5 structure. Conversely, the state of Ru species in the Run/CeO2 catalyst is RuO2 SNPs.
Catalytic performance and kinetics of Ru/CeO2 catalysts in soot oxidation
The performance of all catalysts for soot oxidation was evaluated under the loose contact mode. To highlight the catalytic performance of the CeO2-M nanosheet catalyst, conventional powder-type CeO2 (CeO2-C) was synthesized as the reference sample. The relative reaction rates (R) of catalyzing soot oxidation were calculated through an isothermal oxidation reaction at 280 oC (Fig. 2a). The CeO2-M catalyst exhibits a higher R value (0.94 μmol g−1 min−1) compared to the CeO2-C sample (0.79 μmol g−1 min−1), indicating that the nanoflower-like morphology effectively enhances catalytic performance for soot oxidation. Additionally, the tight soot-catalyst contact mode over the same catalyst showed higher performance compared with the loose contact mode, which approximates real conditions (Supplementary Fig. 13a, b). Upon the introduction of Ru species, the R values of Ru1/CeO2 and Run/CeO2 catalysts remarkably increased to 2.59 and 2.38 μmol g-1 min-1, respectively. The actual Ru content obtained by ICP-OES allowed the representation of the reaction rate per each Ru atom, represented as the turnover frequency (TOFRu). The TOFRu value of Ru1/CeO2 catalyst (0.218 h-1) is approximately nine-fold higher than that of Run/CeO2 catalyst (0.023 h-1) (Fig. 2b). This suggests that a single atomic Ru site possesses both high activity and atom utilization. Moreover, the selectivity of CO2 product (SCO2) over the Ru1/CeO2 catalyst is close to 100 %, allowing for the rapid removal of CO product emitted from vehicle exhaust. Furthermore, the Ru1/CeO2 catalyst exhibits excellent intrinsic catalytic performance during auto-exhaust soot oxidation compared to the commercial Pt-based catalysts (Supplementary Table 3).

a Soot conversion amount as a function of times by isothermal oxidation reaction at 280 oC. b TOFRu over Ru1/CeO2 and Run/CeO2 catalysts. c Active oxygen amount by isothermal anaerobic titration at 280 oC. d Ozawa plots of ln[-ln(1-α)/T2] vs T-1 for different soot conversion. e Time-TOFRu and the selectivity of CO2 over Ru1/CeO2 and Run/CeO2 catalysts (Reaction condition: Soot, 20 mg; Catalyst, 200 mg; Reactant gas flow, 50 mL min-1; At 280 oC). f NO2 concentration curves of NO temperature-programmed oxidation.
The amount of active surface oxygen species plays a crucial role in catalytic performance for deep oxidation reactions, and it was determined by isothermal anaerobic titration at 280 oC (Supplementary Fig. 14a-d). The presence of single atomic Ru species in the Ru1/CeO2 catalyst significantly increased the active oxygen amounts from 31.3 (CeO2-M) to 48.6 μmol g-1 (Ru1/CeO2), owing to the contribution of interface oxygen species in Ru-O-Ce bond (Fig. 2c and Supplementary Fig. 14a-d). To explore the reaction energy barrier on single atomic Ru sites during soot oxidation, the Arrhenius plots of the catalysts were analyzed (Fig. 2d). The Ru1/CeO2 catalyst exhibited the lowest apparent activation energy (Ea, 75.2 kJ mol−1) in comparison with CeO2 and Run/CeO2 catalysts (Supplementary Table 4), indicating that single atomic Ru sites play a pivotal role in boosting the catalyzing soot oxidation.
Addressing the stability concerns associated with single-atom catalysts, we further investigated the stability of Ru species in the catalysts via the TOFRu and SCO2 values versus time (Fig. 2e). The TOFRu and SCO2 values of the Ru1/CeO2 catalyst remain relatively stable during 400 min, whereas those of the Run/CeO2 catalyst gradually decrease. In line with the cyclic test results of soot oxidation (Supplementary Figs. 15 and 16a, b), this confirms that the Ru1/CeO2 catalyst demonstrates higher catalytic stability compared with the Run/CeO2 catalyst. Additionally, the morphology and crystal phase structure remain unchanged during six-cycle TPO tests (Supplementary Fig. 17). On the other hand, ICP-OES analysis revealed a significant loss of Ru content on the used Run/CeO2 catalyst, which could be attributed to the volatilization of Ru species (Supplementary Fig. 18). The Ru1/CeO2 catalyst, with the surface lattice confinement single atom Ru, effectively inhibited the volatilization of Ru species. The CO-DRIFTS of the used Ru1/CeO2 catalyst demonstrated Ru species maintain a single atomically dispersed ionic state (Supplementary Fig. 19a, b), and STEM EDX mapping of Ru1/CeO2 catalyst also showed high dispersion of Ru species (Supplementary Fig. 20a, b). Conversely, the Ru species in the Run/CeO2 catalyst had aggregated into larger particles (Supplementary Fig. 21). The Ru 3p XPS spectra of the used Ru1/CeO2 catalyst still maintained the oxidation state with peaks located at 463.3 and 485.3 eV, corresponding to Run+ species (Supplementary Fig. 22). Raman spectra of the used Ru1/CeO2 revealed that the lattice-confined single-atom Ru1/CeO2 structure remains stable (Supplementary Fig. 23a, b). However, for the used Run/CeO2 catalyst, the peak intensity of RuO2 species (~323 cm−1) increased, indicating the aggregation of RuO2 into larger particles after six cycles of soot-TPO tests. After six cycles of tests, the ID/IF2g value (area ratio of D peak to F2g peak for Raman spectra) of the Run/CeO2 catalyst significantly decreased. This suggests that the interaction between the Ru species and CeO2 has changed, resulting in a decrease in the number of oxygen vacancies on the CeO2 surface. Additionally, the surface plasmon resonance (SPR) peak of UV-Vis red-shifted for the used Run/CeO2 catalyst (Supplementary Fig. 24), further indicating an increase in the average size of RuO2 nanoparticle during the reaction49. Consequently, the weakening of the interaction facilitates the volatility and migration of Ru species, leading to the formation of large particles, which in turn reduces the number of active sites and deactivates the catalyst during soot oxidation. These results demonstrate that the single-atom Ru sites anchored on the surface lattice of CeO2 nanocrystals exhibit high thermal and structural stability during soot oxidation.
Nitric oxide (NO) emissions from automobile exhaust are inevitable and can promote the removal efficiency of soot particles through NO oxidation into NO2, enhancing soot oxidation via a NO2-assisted mechanism50. We also investigated the role of NO over single-atom Ru active sites during catalytic soot oxidation (Supplementary Fig. 25a, b). Interestingly, the catalytic activity of Run/CeO2 catalyst is higher than that of the Ru1/CeO2 catalyst under the sole presence of O2. However, with the addition of NO, the T50 values significantly shift to the lower temperature for both Ru1/CeO2 and Run/CeO2 catalysts. The temperature difference (ΔT50) of Ru1/CeO2 and Run/CeO2 catalysts is 87 and 54 oC under the sole presence of 5 vol% O2, and 5 vol% O2 + 0.2 vol% NO, respectively. This observation indicates that the presence of NO has a more pronounced effect on soot oxidation, emphasizing the critical role of NO activation and oxidation in enhancing catalytic activity for soot oxidation. It suggests that the Ru1/CeO2 catalyst can significantly promote the activation and oxidation of NO, thereby enhancing catalytic activity for soot oxidation via the NO2-assistant soot purification mechanism. The catalytic performance for NO oxidation was further evaluated using NO-temperature programmed oxidation (NO-TPO, Fig. 2f). It is noted that the Ru1/CeO2 catalyst has a higher NO2 concentration than the Run/CeO2 catalyst. Moreover, the Ru1/CeO2 (305 oC) catalyst exhibits a lower temperature of NO2 concentration peak comparison with the Run/CeO2 catalyst (315 oC). Therefore, the single-atom Ru sites anchored on the surface lattice of CeO2{111} facets exhibit improved catalytic performance for low-temperature NO oxidation compared with the Run/CeO2 catalyst. The relatively low temperature of NO oxidation over the single-atom Ru catalyst indicates that the Ru1/CeO2 catalyst demonstrates excellent activation and oxidation of NO molecules, contributing to its super-catalytic performance for NO2-assistant soot oxidation.
Identifying active species and reaction pathways during soot oxidation
The performance of the catalysts during deep oxidation strongly depends on the presence of surface-active oxygen species, which are generated from activated O2 molecules by the low-coordinatively unsaturated cation (CUC) sites. Identifying the active species involved in catalyzing soot oxidation is crucial to understanding the reaction mechanism. We investigated the surface density of CUC sites induced by single-atom Ru species using Raman scattering spectra (Fig. 3a). The strong vibration peak at ~464 cm−1 corresponds to the first-order F2g symmetry of CeO2 nanocrystals. Interestingly, the presence of Ru in the Ru1/CeO2 catalyst causes this peak to shifts down by ~7 cm−1 (Supplementary Fig. 26), suggesting that the atomically dispersed Ru species either lowers the symmetry of Ce-O bond on the Ru1/CeO2 catalysts or facilitates the transfer of electrons from Ru species to CeO2, affecting the electronic structure of the catalyst51,52. Additionally, the Raman peak centered at ~598 cm−1 corresponds to the defect-induced (D) mode of CeO2, and its intensity noticeably increases with the introduction of Ru species53. For Ru1/CeO2 and Run/CeO2 catalysts, two exclusive peaks at ~682 and ~975 cm−1 indicate the formation of the Ru-O-Ce bond, further confirming the presence state of Run+ species in the catalysts54. Moreover, a weak peak at ~323 cm−1 can be attributed to RuO2 formation in Run/CeO2 catalyst55. Furthermore, the peak at ~831 cm−1 is assigned to isolated two-electron surface defect sites on oxidized surfaces of Ce-based oxide56. To evaluate the surface density of oxygen vacancies, we examined the area ratio of D peak to F2g peak (denoted as ID/IF2g)57. The Ru1/CeO2 catalyst exhibits the highest ID/IF2g value (Supplementary Fig. 27), indicating that the formation of the Ru-O-Ce bond induces electronic transfer from Ru to Ce4+, leading to two Ce4+ ions replaced by two Ce3+ ions for creating each oxygen vacancy. As a result, the surface density of CUC sites is increased.

a Raman spectrum with an excitation wavelength of 532 nm. b H2-TPR profiles. c XPS spectra of O 1 s. d The ratio of oxygen species determined by XPS. e Temperature-dependent in-situ DRIFT spectra and (f) corresponding contour projection results of NO oxidation on Ru1/CeO2 catalyst (Catalyst, 10 mg; 5 vol% O2 and 0.2 vol% NO).
The amount of active oxygen species generated by CUC sites can be evaluated using temperature-programmed reduction with H2 (H2-TPR). CeO2-M catalyst exhibits a lower reduction temperature (457 and 781 oC) and higher H2 consumption (1.389 mmol g-1) compared to CeO2-C catalyst (Fig. 3b and Supplementary Fig. 28), indicating that the exposed CeO2{111} facets enhance the oxidation property of surface oxygen species. In the H2-TPR profile of the Run/CeO2 catalyst, the first peak located at 127 oC is assigned to the reduction of RuOx. However, the reduction of Ru species in the Ru1/CeO2 catalyst occurs at a higher temperature, 173 oC, indicating a stronger interaction between Ru species and the support compared to that in the Run/CeO2 catalyst56. The reduction temperature of Ru species in the Ru1/CeO2 catalyst is higher than in the Run/CeO2, indicating two different existing states of Ru species. The initial H2 consumption rate reflects the activity of low-temperature surface oxygen species, and for supported Ru catalysts, their values increase more than thirteen-fold compared to bare CeO2-M (Supplementary Fig. 29), which results in the relatively low ignition temperature (T10) during catalytic soot oxidation (Supplementary Fig. 13). XPS was used to investigate the surface element state in the catalysts. The O 1 s XPS can be deconvoluted into three peaks (Fig. 3c). Surface peroxy-(O22-) and super-oxygen (O2–) species, activated by CUC sites, are considered active oxygen species rather than lattice oxygen (O2-) during deep oxidation reactions. The percentage of active oxygen species in the single-atom Ru catalyst is the highest (37%) (Fig. 3d), suggesting that the CUC sites induced by Ru species greatly enhance the adsorption-activation of O2 molecules, leading to the formation of active oxygen species. This finding is consistent with the analysis result of Ce 3d XPS which shows that the Ru1/CeO2 catalyst has the highest percent (27.6%) of coordinatively unsaturated Ce3+ species, resulting from the strong Ru-O-Ce electronic interaction (Supplementary Fig. 30 and Supplementary Table 5). This electronic interaction is crucial for boosting the catalytic activity of soot oxidation56.
The transformation pathways of surface-active species over the catalysts were studied using in-situ DRIFTS. At 50 oC, a series of NOx-containing species is observed on surface of the Ru1/CeO2 catalyst after introduction of NO and O2 into the reactor (Fig. 3e). These species include N2O4 dimer (1766 cm-1), bridging nitrates (1627 cm−1), monodentate nitrites (1422 and 1360 cm-1), ionic nitrites (1390 cm-1) and nitrates (836 cm-1) (Supplementary Table 6). As the reaction temperature increases, the three characteristic peaks of ionic nitrites and monodentate nitrites gradually merge into one new peak (1372 cm-1), and its intensity increases significantly. At the same time, the peak of bridged nitrates gradually weakens and eventually disappears, while new peaks of anionic (1134 cm−1) and bidentate (1043 and 965 cm-1) nitrates appear (Fig. 3f). These changes suggest that the adsorbed NOx species gradually transform into labile NO3– intermediates, which subsequently decompose into NO2. The Run/CeO2 catalyst exhibits similar evolution processes of in-situ DRIFTS spectra for NO oxidation (Supplementary Fig. 31), and the Ru1/CeO2 catalyst exhibits the largest relative intensity of surface NO3– at 200 oC (Supplementary Fig. 32), indicating that single atomic Ru species significantly promote the transfer from surface active oxygen to NO3– intermediate. Finally, the gaseous NO2 produced by surface nitrate decomposition boosts catalyzing soot oxidation in the NO2-assisted mechanism. The electron and energy evolution processes of surface-active intermediate over the catalysts were further investigated through DFT calculations in the following discussion.
Insight into the mechanism of single atomic Ru catalyst for soot oxidation
To gain insight into NO2-assisted catalytic mechanism for soot oxidation over Ru catalysts, the reaction pathways were investigated by DFT calculations. Model active sites of single atom Ru1 and Ru10 SNPs were constructed on the surface of CeO2 (110) facets (Supplementary Fig. 33a-c). The charge density difference maps of Ru1/CeO2 and Ru10/CeO2 were used to investigate the strong interaction between Ru and CeO2, and the extra number of transferred electrons was calculated using Bader charge analyses. The results showed that the Ru1 model can donate 1.46 e– to CeO2 support (Supplementary Fig. 34a-c), while Ru10 model transfers a total of 1.26 e–, indicating a stronger electronic interaction between Ru1 and CeO2, which boosts the formation of CUC sites compared to Ru10 SNPs (Supplementary Fig. 35a-c).
The reaction pathways and relative energy (E) during catalyzing NO oxidation can be divided into six stages as follows (Fig. 4): first, a gaseous O2 molecule adsorbs on the unsaturated coordination Ce site (Ce-O-Ru) over the catalyst surface through O-O-Ce bond to form surface adsorption O2* (IM1). The adsorption energy of O2 (Eads(O2)) is -0.9 and -0.53 eV for Ru1/CeO2 and Ru10/CeO2, respectively, indicating that the single Ru site easily adsorbs O2 molecule. The calculated charge density difference shows that the O2 molecule can be adsorbed on coordination unsaturated Ce atom of Ru1/CeO2 and Ru10/CeO2, with a total net charge transfer from Ru1/CeO2 surface to O2 being 0.56 e– (Supplementary Fig. 36a, b) and 0.44 e– for Run/CeO2 catalyst (Supplementary Fig. 37a, b). The adsorbed O2 molecule over Ru1/CeO2 catalyst gains the more electrons, facilitating the activation of O = O bond. Second, one NO molecule adsorbs on the Ru site of the catalyst surface through the O-N-Ru bond to form surface NO species (IM2). The NO adsorption energy (Eads(NO)) of Ru10/CeO2 (-2.82 eV) is lower than that of Ru1/CeO2 (-1.63 eV), and this strong adsorption capacity is not conducive to the subsequent reaction over Ru10/CeO2. Third, the O-O bond of the adsorbed O2 is activated to dissociate into atomic O* species, and adsorbed NO combines with O* to form the surface intermediate NO2* species (IM3). The reaction barriers for these steps are 0.9 and 1.23 eV with the corresponding transition states (TS1) of Ru1/CeO2 and Ru10/CeO2, respectively. Fourth, the NO2 species desorb from the catalyst surface (IM4). The NO2 desorption energy (Edes(NO2)) for Ru1/CeO2 (1.01 eV) is lower than that of Ru10/CeO2 (2.60 eV), indicating that the desorption of NO2 molecules over the single atomic Ru site is easier than that of Ru10 site. This result in the rapid formation of NO2 on the surface of Ru1/CeO2 catalyst, a crucial step during soot oxidation. Fifthly, an additional NO molecule adsorbs on the O* to form ONO* (IM5). Finally, the formation of NO2* species desorbs from the catalyst surface, completing the reaction cycle (FS). The NO2 desorption energy (Edes(NO2)) for Ru1/CeO2 (1.70 eV) is lower than that of Ru10/CeO2 (2.15 eV), indicating that the NO2 molecule was easily desorbed from the catalyst surface. Based on the above results, we found that NO molecules prefer to adsorb on Ru active sites on the surface of the catalysts, while O2 molecules are strongly adsorbed on the CUC sites. The rate-determining step of NO oxidation at the Ru-CeO2 interface is the formation of NO2* intermediate species. The stronger oxidizing NO2 can migrate to the soot surface along with the reaction gas flow and oxidize them to form CO2 via the indirect pathway (NO + 1/2O2 → NO2 and NO2 + soot → CO2). These DFT calculation results for NO oxidation are consistent with our experimental findings. The single active Ru site easily boosts NO oxidation to NO2 intermediate, which is beneficial to further promote soot oxidation.

Reaction steps during catalyzing NO oxidation (Ru atom, black green; Ce atom, gray; O atom, red; N atom, blue). Color code: Ru1/CeO2 (brown line) and Ru10/CeO2 (blue line).