Rational design of the intuitive descriptor
We initiate by recognizing the lack of pertinent physical parameters to describe the overall performance of the Ru-based catalysts, irrespective of the reaction mechanism. Previously, reactivity descriptors, including the eg filling47,48, d band center28, p band center11, and the adsorption energy difference between catalytic sites and dopants proposed by ref. 49. were found feasible in describing the activity trend of the catalysts following either the AEM or LOM mechanism. However, a unified scale, which comprises information on activity and stability in combined reaction mechanisms (both AEM and LOM), is lacking, thereby obscuring the advancing direction of the catalysts.
We reasoned that, despite the complexity, the catalytic activity and stability are interrelated and bridged by the Ru-O bonding nature, i.e. bond covalency and level of difficulty in Ru-O bond breaking50, as follows. Weakening the Ru-O bond covalency implies the burying of the O 2p orbital under the Fermi level as well as the Ru 3d front orbital, thereby prohibiting lattice oxygen from participating in OER and the formation of oxygen vacancy (ΔGVO)45,51. In thus formed catalysts dominated by AEM, too low degree of Ru-O hybridization indicates too weak oxygen binding strength, which causes decreased Ru vacancy formation energy (ΔGVRu) and eases Ru loss52, resulting in a simultaneous decrease in activity and stability. Strengthening the Ru-O bonding will firstly lead to a moderate intermediate binding energy as well as an increased ΔGVRu under AEM, thereby improving both the activity and stability53,54. However, further increasing the bonding strength leads to arise of lattice oxygen redox, where O 2p becomes the front orbital and thereby causes lowered ΔGVO value18. Such a condition, though greatly boosts the intrinsic activity, causes the formation of oxygen defects and easy detachment of Ru-Ox moieties from defects’ neck, leading to rapid catalyst degradation28,37. To this end, an appropriate performance indicator might be a physical parameter that could precisely describe the local Ru-O bonding nature.
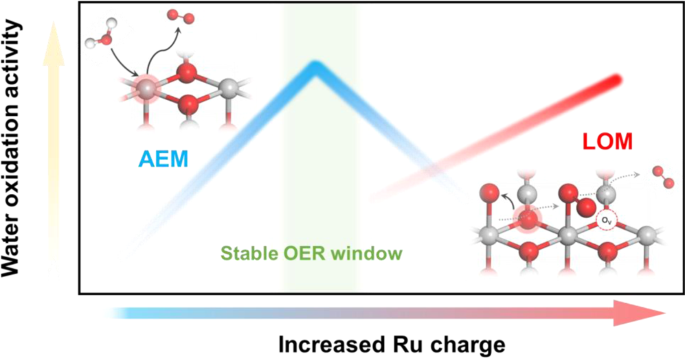
We postulate that the Ru charge might be able to serve as such an intuitive descriptor, because it could not only perfectly reflect the local Ru-O bonding structure, i.e., the ionic or covalent bonding, but also the bonding strength. Therefore, it is possible to customize both the reaction activity and stability, using Ru charge as a regulator (Fig. 1). We, therefore, begin our study by looking for a suitable model catalyst system to verify this idea, and found that the MRuOx solid solution (M in +4 valence to avoid additional structure influence) with a clear Ru-O-M structure motif might be suitable for such a proposal. Specifically, the Ru charge can be regulated by adjusting the ionic electronegativity of M, where M4+ in higher ionic electronegativity than Ru4+ leads to reduced electron density on Ru, and vice versa. Consequently, we selected M = Ce4+, Sn4+, Ru4+, and Cr4+ with an ionic electronegativity of 1.608, 1.706, 1.848, and 1.861 to carry out our further study55,56.

Schematic illustration of OER activity and stability of Ru-based catalysts within different reaction routes on the scale of Ru charge.
DFT calculational predictions
We firstly carried out DFT calculations with the simulation model of M0.5Ru0.5O2 with Ru-O-M motifs constructed (Fig. 2a) based on the stable rutile RuO2 (110)18,57 (Supplementary Figs. 2–6 and Supplementary Note 1). The charge of Ru in Ru-O-M was first calculated. As the electronegativity of M4+ increases from 1.608 (Ce4+) to 1.861 (Cr4+), the charge of Ru increased from 1.49 (Ce0.5Ru0.5O2) to 1.57 (Cr0.5Ru0.5O2) (Fig. 2b). We then evaluated the dependence of theoretical OER activity on the Ru charge, in both AEM and LOM reaction pathways on Ru sites, as the M sites were calculated to possess extremely poor activities under both reaction pathways (M = Ce, Sn, Cr) (Supplementary Figs. 7–13 and Supplementary Note 2).

a Schematics of two OER pathway (AEM and LOM) on the surface of M0.5Ru0.5O2 (110). b The variation of Ru charge in M0.5Ru0.5O2 with an ionic electronegativity of different M. c Theoretical overpotential volcano plot under AEM pathway as a function of the Ru charge. d Projected DOS plots of Ru (d) and O (p) near the Fermi level for M0.5Ru0.5O2. The light gray filling shows the overlap between Ru (d) and O (p). e Variation of O (p) contribution near Fermi level with Ru charge. f Theoretical overpotential plot under LOM pathway as a function of the Ru charge. g The Ru vacancy formation energy (ΔGVRu) of M0.5Ru0.5O2 is characterized by Ru charge. For RuO2 and Cr0.5Ru0.5O2, ΔGVRu were calculated without (transparent dots in yellow and green) and with (opaque dots in yellow and green) the consideration of lattice oxygen vacancies. Source data are provided as a Source Data file.
The AEM pathway activities of the materials are revealed to follow a volcanic-like trend as a function of Ru charge. The theoretical OER overpotentials of M0.5Ru0.5O2 were calculated first, with the Sn0.5Ru0.5O2 sample exhibiting moderate Ru charge (1.52) representing the lowest theoretical OER overpotential. For the samples with both lower (Ce0.5Ru0.5O2) and higher (RuO2 and Cr0.5Ru0.5O2) Ru charge, increases in OER overpotentials are observed (Fig. 2c and Supplementary Figs. 14–17). While this phenomenon implies that an optimum Ru charge that is neither too high nor too low is beneficial for OER, the underlying reason is that Ru charge can be successfully used to reflect the Ru-O bonding interaction. Specifically, we calculated the overlap band center of Ru d orbital and O p orbital in the partial density of states (pDOS, Supplementary Fig. 18)58 and found that the overlap band center (ε-Rud-Op) takes the same trending with the change in Ru charge, i.e., increases from −4.19 to −2.95 eV with an increase in Ru charge (1.49–1.57). To this end, the Ru charge can truly be utilized as the intuitive descriptor because it reflects the status of both Ru itself and the Ru-O orbital interaction. Indeed, as the Ru charge increases, the M0.5Ru0.5O2 undergoes alteration in the potential determine step (PDS) from OH*/O* to O*/OOH* (Supplementary Figs. 13, 14), due to strengthening in Ru-O* binding, in line with bond shrinkage from 1.749 to 1.732 Å (Supplementary Fig. 19). Therefore, Ru sites charge can be successfully used to indicate the AEM reaction activity.
We then move to calculate the reactivity of lattice oxygen in different M0.5Ru0.5O2 structures and the feasibility of the LOM route. First, upshifting in O 2p band center (Fig. 2d, e and Supplementary Fig. 20) and strengthening in Ru-O bond covalency are observed with increases in Ru charge, as indicated by increases in both ε-Op-Rud, O 2p band contribution near the EF (from 2.2 to 25.2%)40,59,60 and downshifted ICOHP between Ru and O (from −1.280 to −1.733 eV, Supplementary Figs. 21, 22). Second, we calculated the formation energies of oxygen vacancy(ΔGVO) in different samples, to analyze the occurrence possibility of LOM18. The significantly downshifted ΔGVO from 7.20 eV (Ce0.5Ru0.5O2) and 8.25 eV (Sn0.5Ru0.5O2) to 5.68 eV (RuO2) and 5.29 eV (Cr0.5Ru0.5O2) suggests the higher possibility of LOM involvement in RuO2 and Cr0.5Ru0.5O2 with high Ru charge (Supplementary Fig. 23). The lower ΔGVO of Ce0.5Ru0.5O2 compared to that of Sn0.5Ru0.5O2 may originate from the distortion of the crystal structure61 (Supplementary Figs. 24–27 and Supplementary Note 3). Third, we turned to calculate the LOM energy variation for M0.5Ru0.5O2 (Fig. 2f and Supplementary Figs. 28–31). Clearly, the theoretical overpotential of OER under the LOM path gradually decreases from 0.84 V for Ce0.5Ru0.5O2 to 0.34 V for Cr0.5Ru0.5O2. Therefore, the direct O-O coupling on the O p band above the EF is more thermodynamically favored with a higher Ru charge (i.e., in RuO2 and Cr0.5Ru0.5O2). Based on the above calculations, the correlation between a charge of the Ru site and the reaction path (AEM and LOM) as well as reaction energy on M0.5Ru0.5O2 (Fig. 1) is unveiled. While low charge (Ce0.5Ru0.5O2 and Sn0.5Ru0.5O2) at Ru sites leads to the domination of the AEM path, the LOM route is energetically more favored at elevated Ru charge. Moreover, by changing the Ru charge, the OER catalytic activity of catalysts following AEM can also be adjusted due to the regulation of Ru-O interaction in M0.5Ru0.5O2.
We then move to our next step, i.e., probing the applicability of the Ru charge in describing the stability of the catalysts. Two indicators, i.e., the formation energies of Ru (ΔGVRu) and O (ΔGVO) vacancies, are used jointly to describe the stability of the catalysts. On one hand, it is expected that increasing the Ru charge results in strengthened Ru-O bonding and thereby increased ΔGVRu in perfectly crystallized M0.5Ru0.5O2 samples, with ΔGVRu increasing gradually from 9.44 eV in Ce0.5Ru0.5O2 to13.92, 14.60, and 15.13 eV for Sn0.5Ru0.5O2, RuO2, and Cr0.5Ru0.5O2, respectively (Fig. 2g). On the other hand, however, increase in Ru charge causes ease formation of OV (Supplementary Fig. 23) and thereby decreases in ΔGVRu (Supplementary Fig. 32) due to lower overall Ru-O chelation number. Specifically, with the formation of one neighboring OV, the ΔGVRu value for RuO2 and Cr0.5Ru0.5O2 decreases from 14.60 and 15.13 eV to 8.51 and 7.95 eV, respectively, resulting in poor stability (Fig. 2g). To this end, the Sn0.5Ru0.5O2 near the apex of the volcano curve under the AEM path demonstrates the best stability. The rationale behind this is that the low Ru charge (Ce0.5Ru0.5O2) makes the Ru species prone to dissolution in acid, too high Ru charge leads to the readily generation of OV defects and smaller ΔGVRu, thus resulting in the overall destabilization. Since metal dissolution may occur during acidic OER, defective structures with Ru and M vacancies were also constructed for calculations (Supplementary Figs. 33–43 and Supplementary Note 4). Although the inclusion of metal center vacancies leads to the trend of crossover between AEM and LOM pathways (Supplementary Fig. 44), in line with recent work from Alexandrov et al.62,63, Ru charge is still valid in describing the reaction path and energy as the vacancies influence the Ru charge and OER reaction in the same way. Specifically, the inclusion of vacancies leads to the evolution of the Ru-O bonding feature and thereby Ru charge (Supplementary Fig. 45 and Supplementary Note 5), which thus determines the theoretical activity under different paths. As a result, the theoretical performance of defective M0.5Ru0.5O2 on the scale of Ru charge perfectly matches that of the non-defective structure. To here, it is clear that the Ru charge can be used to describe not only the major reaction path and OER activity, but also the structural stability, due to its successful reflection in both electronic features of Ru and overall Ru-O bonding interactions (Fig. 1).
Synthesis and characterization
To experimentally validate the DFT prediction, MRuOx oxide solid solution with a M/Ru ratio close to 1 was synthesized according to the previous reports (see Methods for details)16,35. Powder X-ray diffraction (XRD) patterns show that all prepared MRuOx samples possess a rutile-type structure without any distinct diffraction peaks corresponding to MOx and RuO2 (Supplementary Fig. 46), indicating the formation of MRuOx oxide solid solution, in line with the uniform elements distribution revealed by energy-dispersive X-ray spectroscopy (EDX) (Supplementary Figs. 47–50). Rietveld refinement analysis (Supplementary Fig. 51 and Supplementary Table 1) suggests the random displacement of Ru by M in MRuOx solid solution, giving the formation of Ru-O-M structure motif (Supplementary Fig. 52). The atomic ratios of M and Ru were close to 1, as analyzed by inductively coupled plasma optical emission spectrometer (ICP-OES) and EDX (Supplementary Fig. 53 and Supplementary Table 2).
We then move on to probe the local structure and chemical states of Ru and O in MRuOx. X-ray photoelectron spectra (XPS) show that both Ru 3d and Ru 3p3/2 (Fig. 3a) signals could be deconvoluted into two doublets, representing Ru4+ (fill in green) and the satellite peaks (fill in yellow)54,64. Notably, the Ru 3d and Ru 3p binding energies for CeRuOx (280.1 and 461.9 eV), SnRuOx (280.4 and 462.1 eV), RuOx (280.6 and 462.5 eV), and CrRuOx (280.8 and 462.8 eV) consecutively shifted to more positive values, implying a successive increase in Ru valence states, in line with the DFT calculation results. We further collected the Ru K edge spectra through X-ray absorption near-edge spectroscopy (XANES) to quantitatively describe the oxidation state of Ru. As presented in Fig. 3b, taking Ru foil and commercial RuO2 as references, the oxidation states of Ru in MRuOx were estimated to be +3.3, +3.6, +3.9, and +4.2 for CeRuOx, SnRuOx, RuOx, and CrRuOx, respectively. The variation in Ru valence and its consistency with DFT calculation results verifies the feasibility of tailoring the Ru electron density via controlling the element M in the Ru-O-M motif, making it promising for reaction path and O* adsorption energy regulation.

a High-resolution Ru 3d and Ru 3p3/2 XPS pattern of MRuOx, demonstrating the variation of Ru chemical states. b Ru K edge XANES spectra and corresponding first derivative (insert in the left part of b) of MRuOx, Ru foil, and oxidized commercial RuO2. The right part of b show the relation between the Ru K-edge absorption energy (E0) and oxidation states for MRuOx and reference samples. c Ru L3-edge XAS spectra and the corresponding second derivative (insert in the left part of c) of MRuOx. The right part of c illustrated the relation between the energy splitting ΔE and Ru oxidation states of MRuOx. d DEMS signals of 32O2 (16O16O), 34O2 (16O18O), and 36O2 (18O18O) from the reaction products for MRu16Ox in H18O aqueous sulfuric acid electrolyte. The right part of d presented the variation of the 16O: 18O ratio with Ru oxidation states of MRuOx. The dashed lines in c and d are used to guide the eyes. Source data are provided as a Source Data file.
We next turned to validate experimentally if the OER path of MRuOx truly follows the DFT calculation results as a function of Ru charge, initiated by monitoring the Ru-O bond covalency via Ru XANES spectrum at L3 edge (Fig. 3c)65. As reported previously, the Ru XANES spectrum at the L3 edge can be fitted by two peaks ascribable to eg and t2g, and the energy splitting ΔE (ΔE = Eeg – Et2g) is positively correlated with the Ru-O bond covalency. Notably, we find that ΔE increases from 1.51 to 1.95 eV (Fig. 3c, right) with the increase in valence state (+3.3 to +4.2), thus testifying to the greatly enhanced Ru-O bond covalency with increased Ru charge, in line with the increase in Rud–Op overlap in the calculation (Fig. 2d, e). O 1 s XPS spectra (Supplementary Fig. 54 and Supplementary Table 3) further suggest significant increases in OV contents in RuOx (36%) and CrRuOx (41%) compared with that of CeRuOx (25%) and SnRuOx (15%), in good compliance with the increase in bond covalency11. The occurrence of LOM is further verified by in situ 18O isotope-related DEMS measurements on all MRuOx samples (Fig. 3d, Supplementary Figs. 55–63, and Supplementary Note 6) according to the previous reports66,67,68. By extrapolating the integration of the mass spectra signal (16O/18O) per second to the OER onset, the content of the LOM path during OER is determined (Supplementary Figs. 55–63e). Specifically, the AEM path is revealed to be dominant on CeRuOx and SnRuOx, as the 16O/18O ratio of O2 catalyzed by CeRu16Ox and SnRu16Ox in 18O-labeled 0.5 M H2SO4 is 6.88 and 6.85% (Supplementary Figs. 56, 57e), respectively, which is consistent with that of the commercial IrO2 (6.56%, Supplementary Fig. 55), attributable to the isotopic abundance of 16O in H218O. On Ru18Ox and CrRu18Ox, however, the 16O/18O ratio in products significantly increased to 28.63 and 41.96%, leading to an increment in the LOM ratio of RuOx and CrRuOx to 12.6 and 36.7%, respectively (Supplementary Figs. 58–59). Besides, the DEMS measurements in 18O-labeled 0.1 M PBS (pH = 6) also demonstrate similar results (Supplementary Figs. 60–63). It is noted that the LOM ratio differs significantly in literature as reported by refs. 67,68,69, etc., mainly owing to the difference in structural properties of the catalysts, while our result is in high accordance with that reported by ref. 38, due to the similar solid solution structure (Supplementary Note 7). To here, it is clear that the Ru charge is a useful parameter to customize the OER path on MRuOx.
OER catalytic performance in a three-electrode configuration
The OER performance of the prepared MRuOx was firstly evaluated in a conventional three-electrode setup at a catalyst loading of 41.65 μgcat cm−2 (Supplementary Figs. 64, 65 and Supplementary Note 8) with 0.5 M H2SO4 electrolyte according to the guideline recently set70,71. The linear sweep voltammetry (LSV) curves normalized by the geometric area (Fig. 4a), electrochemical active surface area (ECSA) (Supplementary Fig. 66a, b), Ru mass loading on the electrode (Supplementary Fig. 66c) and corresponding Tafel slopes (Supplementary Fig. 66d–f) revealed the variation in OER catalytic activity of MRuOx. As summarized in Fig. 4b and Supplementary Fig. 67, the activity trend of MRuOx is in good agreement with DFT prediction. Specifically, on samples dominated by AEM path (CeRuOx and SnRuOx), the OER activity is significantly enhanced with an increase in Ru charge (strengthened O* adsorption), accompanied by the variation in reaction determine step as indicated by the difference in Tafel slope (60.2 and 38.2 mV dec−1) (Supplementary Fig. 66d and Supplementary Note 9). Further increase in the Ru charge leads to a performance decline in AEM but the occurrence of LOM. Therefore, an activity drop in RuOx and a slight lift in CrRuOx are observed, in line with the DFT calculation. Notably, the SnRuOx customized near the apex of AEM exhibited remarkable OER catalytic activity. Satisfactorily, a small catalytic overpotential (η) of 194 mV is needed for SnRuOx to deliver a current density of 10 mA cm−2, which is 176 mV lower than that of commercial RuO2 (Fig. 4a). Furthermore, the mass activity and turnover frequency (TOF) of SnRuOx at 1.48 V vs. RHE is 36.4 times that of commercial RuO2, reaching 2360 A gRu−1 and 0.63 s−1 (Supplementary Fig. 68). These results unambiguously suggest SnRuOx as one of the most active Ru-based catalysts towards acidic OER (Fig. 4e and Supplementary Table 4).

a Geometric area normalized LSV curves of MRuOx. b The variation of apparent overpotential at 10 mA cm−2 with Ru oxidation states. The theoretical overpotential of MRuOx is the weighted value of the theoretical activity of different reaction mechanisms to its proportions (from Supplementary Fig. 56–59). The apparent overpotential experimentally obtained is given as the blue dots scaled with the right Y-axis. The theoretical overpotential is given as the green dots scaled with the left Y-axis. c Chronopotentiometry curve of SnRuOx nanocatalyst operated at 100 mA cm−2 during the 250 h test. d Current retention of MRuOx after chronoamperometry test at various potentials (1.5 V, 1.7 V, and 1.9 V) for 5 h. e Comparison of OER performance (η at 10 mA cm−2 and activity degradation rate) for variously reported electrocatalysts. SnRuOx is presented by a red star. The electrocatalytic performance is collected with a catalyst loading of 41.65 μgcat cm−2. Source data are provided as a Source Data file.
We then tested the stability of MRuOx during operation to probe into the effectiveness of Ru charge in describing the stability. To start with, chronoamperometry (CA) tests (5 h) suggest SnRuOx as the most stable catalyst, with high current retention of 91.7, 77.15, and 66.48% after operating at 1.5, 1.7, and 1.9 V vs. RHE, respectively (Supplementary Fig. 69). By contrast, the CeRuOx, CrRuOx, and RuOx only demonstrate current retention of 54.75, 83.09, and 53.84% at 1.5 V vs. RHE, respectively, implying their poor stability. Furthermore, to eliminate the interference of other factors beyond the catalyst, i.e., thin film quality72,73, active sites blockage74, and back electrode passivation75,76, the stability of MRuOx was evaluated by monitoring the dissolution behavior of M and Ru during CA tests. By calculating the Ru stability number (S-number)77 during CA tests, the stability of MRuOx is found to be in line with the ΔGVRu from the DFT calculations (Supplementary Fig. 70). Given the perfect match in catalytic stability between experiments and theoretical computations, we further run a CP test at 100 mA cm−2 for the SnRuOx sample to verify its stability (Fig. 4c). Excitingly, during a 250 h test, the overpotential only increased by 26.8 mV, giving a degradation rate of merely 107.2 μV h−1, three orders of magnitude smaller than that of commercial RuO2 (Supplementary Fig. 71) and comparable to that of the advanced Ir-based catalysts (Fig. 4e and Supplementary Tables 5, 6)12,14,18,19,38,52,53,54,78,79,80,81,82,83,84,85,86,87,88,89,90. Besides, by carrying out CA tests in a weak acidic environment (0.1 M PBS, pH = 6), the contribution of M (M = Ce, Sn, and Cr) dissolution on the performance degradation of MRuOx is eliminated (Supplementary Figs. 72, 73 and Supplementary Note 10), further demonstrating the stability of MRuOx is dependent on the Ru stability. These results corroborate the effectiveness of the Ru charge not only in describing the trend in catalytical activity, but more importantly, in screening out the most durable catalysts ever reported.
The origin of the high stability
To further probe into the stabilization mechanism of SnRuOx during OER operation, we adopted in situ XAS and in situ Raman spectroscopy to investigate the dynamic variation in local Ru structure and chemical environment. RuOx was also tested as the counterpart catalyst for comparison. According to the literature, the over-oxidation of Ru originating from the structure damage under high oxidation potential is one of the main culprits leading to severe Ru dissolution91. Thus, Ru K edge XANES spectra were collected to monitor the change in Ru oxidation states of SnRuOx and RuOx during operation. As presented in Fig. 5a, b and summarized in Fig. 5c, SnRuOx and RuOx show big differences in Ru valence states during operation (Supplementary Fig. 74), especially at higher applied potentials. Specifically, switching on the electrode potential from open circuit potential (OCP) to 1.4 V vs. RHE leads to a rapid rise in Ru valence from +3.6 to +4.2 in SnRuOx, followed by a gentle and steady change from +4.2 to +4.4 with potential further lifted to 2.0 V vs. RHE. On the contrary, the Ru oxidation states in RuOx increase at a constant rate from +3.9 to +4.9 with the applied potential ranging from OCP to 2.0 V vs. RHE, showing no sign of stabilization. This result indicates that even at high oxidation potentials, the stable structure of SnRuOx can be maintained under the customized AEM path, whereas RuOx undergoes significant structural evolution, probably ascribable to the involvement of LOM.

a, b In situ Ru K edge XANES spectra of SnRuOx (a) and RuOx (b) with applied bias rise from 1.0 V to 2.0 V vs. RHE. c The variation trend of Ru K-edge absorption energy (E0) of SnRuOx and RuOx under different potentials. d, e Fourier transforms of k2-weighted EXAFS signals of SnRuOx (d) and RuOx (e) with applied bias rise from 1.0 to 2.0 V vs. RHE. f Summary of the Ru-O bond length of SnRuOx and RuOx under various potentials according to the quantitative fitting results (Supplementary Table 7). g, h Quasi in situ O K edge XAS TEY spectra of SnRuOx (g) and RuOx (h) with an applied potential increase from 1.2 to 2.0 V vs. RHE. i The variation of It2g-p/Ieg-p with applied potential for SnRuOx and RuOx. The dashed lines in c, f, i are used to guide the eyes. Source data are provided as a Source Data file.
We then carried out in situ Raman spectroscopy to clarify the structure evolution during OER. For both SnRuOx and RuOx, two major peaks at ~435 and 595 cm−1 assignable to Eg and A1g vibration modes were observed (Supplementary Fig. 75)92,93. With the potential increases from OCP to 1.8 V vs. RHE, the SnRuOx sample maintains a constant Raman shift, suggesting the consistency in Ru-O bonding structure during OER. However, a ca. 9 cm−1 positive shift in RuOx is noticed, implying the shrinkage in Ru-O bonding length during OER. To intuitively uncover the local structure evolution of SnRuOx and RuOx during OER, Fourier transforms (FTs) analysis of extended X-ray absorption fine structure (EXAFS) spectra was carried out to provide R-space information. A prominent peak of ~1.45 Å (phase uncorrected) corresponds to the first Ru-O coordination shell can be observed (Fig. 5d, e and Supplementary Figs. 76, 77) for both samples. Interestingly, while only small fluctuations in Ru-O bond length (rRu-O) are observed for SnRuOx (from 1.97 to 1.96 Å) with potential increases from 1.0 to 2.0 V vs. RHE, a significant rRu-O shrinkage from 1.96 to 1.86 Å is observed in RuOx (Fig. 5f), in well accordance with the Raman results. Meanwhile, while quantitative Ru K edge fitting results (Supplementary Table 7) show no significant change in Ru-O coordination number (CN) for SnRuOx, a significant decrease in CN from 6.4 to 4.7 is evidenced in RuOx, ascribable to the generation of OV due to the occurrence of LOM.
We further performed quasi in situ soft-XAS measurements to collect the O K edge information, to directly evidence the formation of OV by recording the total electron yield (TEY) intensity before and after operating under different potentials. Two pre-edge peaks at ~532 and 534.5 eV assignable to the unoccupied orbital of O 2p hybridized with Ru 4d t2g and eg orbitals are observed for both SnRuOx and RuOx (Fig. 5g–i)45. According to previous reports, the reduction in t2g–p/eg–p peak intensity (It2g-p/Ieg-p) implies the formation of the OV due to the electron occupation of the lowest energy state (t2g) of octahedral symmetry94,95. For RuOx, the ratio of It2g-p/Ieg-p decreases monotonously with potential increases from 1.2 to 2.0 V vs. RHE, implying the generation of a high amount of OV during OER. On the contrary, no obvious variation in It2g-p/Ieg-p is observed for SnRuOx, suggesting that there is no increase in OV content and thus ruling out the occurrence of LOM, which endows it with excellent operational stability. These results are in good agreement with the catalyst design idea as SnRuOx was customized to follow the AEM path and exhibited high stability during OER due to moderate Ru charge.
Performance of PEMWE devices
Encouraged by the overall high activity and stability of SnRuOx towards OER, we finally assembled a single cell using the catalyst as the anode to evaluate its performance in a real PEMWE device (Supplementary Fig. 78, see Methods for details). The steady-state polarization curve of membrane electrode assemblies (MEAs) operated at 50 °C (Fig. 6a) shows that the performance of PEMWE can be greatly improved with the utilization of SnRuOx. Specifically, cell voltages of only 1.565, 1.655, and 1.735 V are needed to reach current densities of 1, 2, and 3 A cm−2, respectively, far superior to that obtained with commercial RuO2 (1.733 V@1 A cm−2 and 1.883 V@2 A cm−2) (Supplementary Fig. 79) and also well surpassing the DOE 2025 target (3 A cm−2@1.9 V)96. Taking noble metal cost and cell performance into account, the overall advantages of SnRuOx are self-evident (Fig. 6b). With anode noble metal cost of US$ 0.0194 cm−2, high energy efficiencies at 78.7 and 74.3% were achieved at 1 and 2 A cm−2, respectively, corresponding to energy consumptions at 41.9 and 44.4 kWh kg−1H2, outperforming the prior reported most cost-efficient OER catalysts (Fig. 6b, Supplementary Table 8, and Supplementary Note 11)20,97,98,99,100,101,102. According to the calculation from US DOE, only US$ 0.838 is required for this PEMWE device to produce 1 kg H2, which is much lower than the DOE target (

a Polarization curve of the PEM electrolyzer obtained at 50 °C with Nafion 212 membrane. b Comparison of the efficiency of previously reported anode electrocatalysts. The X-axis represents the anode noble metal cost (Supplementary Table 8). The left and right Y-axis represent the cell voltage and energy efficiency at 1 and 2 A cm−2 respectively. c Chronopotentiometry curve of the PEM electrolyzer using SnRuOx catalyst operated at 1 A cm−2 at 50 °C with Nafion 115 membrane. Insert in c show the total dissolution amount of Ru during the 1300 h test. d Comparison of the operational stability (operation time and performance degradation rate) of SnRuOx with reported anode catalysts. Source data are provided as a Source Data file.
The long-term operational stability is even more exciting, as shown in Fig. 6c, the SnRuOx-based cell demonstrates well-maintained PEMWE performance after running under 1 A cm−2 for 1300 h, with apparent degradation rate only at 53 μV h−1. Such stability not only represents a record for Ru-based catalysts, but even superior to that of the advanced Ir-based OER catalysts recently reported (Fig. 6d and Supplementary Table 9)14,20,38,52,97,99,103,104,105,106,107. To more accurately determine the lifetime of SnRuOx in PEMWE, a modified MEA setup without metallic parts in the anode and cathode water cycle was employed according to the previous reports (Supplementary Fig. 80–84, Supplementary Table 10, and Supplementary Note 12)108. With all the Ru dissolved in the anode/cathode water and membrane monitored during 10 h operation at 1 A cm−2, the S-number of SnRuOx is calculated to be 1.04 × 10⁶ (Supplementary Note 13)77. These results reveal the inherently robust nature of SnRuOx as an OER catalyst with highlighted practical application prospects.