Newsfrom Japan
Tokyo, June 13 (Jiji Press)–The Japanese internal affairs ministry has released an online visualization tool that makes it easier to analyze the fiscal conditions of local governments.
The so-called dashboard of regional fiscal data allows users to examine data held by the central government on revenues, expenditures and fiscal indicators of prefectural and municipal governments through graphs and color-coded maps. It also enables easy comparisons between entities.
The ministry, which developed the dashboard in collaboration with the Digital Agency, is calling on local government employees and the public to use it. The tool is part of the agency’s Japan Dashboard project for government statistical data analysis designed to facilitate data-based policy decisions and visualize policy impacts.
A version containing data on municipalities was released in April, followed by that with data on prefectural governments the next month.
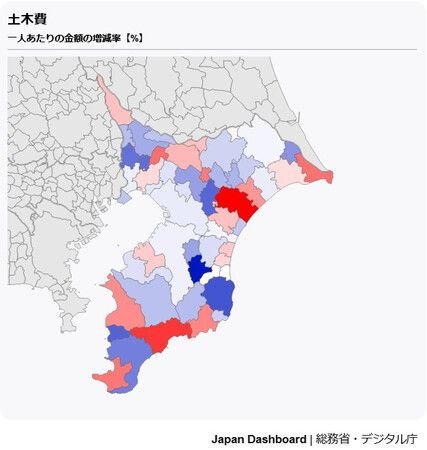
The dashboard can display changes in local governments’ real balance of revenues and expenditures and their financial strength index readings in a graph, for example. By selecting multiple local governments, users can generate color-coded maps for expenditures by category, such as civil engineering and education costs.

[Copyright The Jiji Press, Ltd.]