
- If you are wondering whether Royal Gold at around US$214.82 really offers value today, the first step is understanding what the current share price is and is not telling you.
- The stock is up 3.5% over the last week, even though it is down 3.4% over the last 30 days and down 2.8% year to date, while the 1 year and 3 year returns of 20.8% and 95.0% put its recent performance in a very different light.
- Recent coverage has focused on how Royal Gold fits into the broader materials and mining space and what that means for investor sentiment toward precious metals stocks. This context matters because shifting attention between sectors often affects how investors think about risk and potential reward for companies like Royal Gold, even when company specific news is limited.
- On Simply Wall St’s valuation checks, Royal Gold currently scores a 1 out of 6 valuation score. This sets up a closer look at how different valuation approaches assess the stock and suggests a more complete way to think about value that will be covered at the end of this article.
Royal Gold scores just 1/6 on our valuation checks. See what other red flags we found in the full valuation breakdown.
Approach 1: Royal Gold Discounted Cash Flow (DCF) Analysis
A Discounted Cash Flow, or DCF, model estimates what a stock like Royal Gold could be worth today by projecting future free cash flows and discounting them back to a present value. It is essentially asking how much those future cash flows are worth in $ right now.
For Royal Gold, the latest twelve month Free Cash Flow is about $236.3 million. Analysts have provided explicit free cash flow estimates out to 2029, with Simply Wall St extrapolating projections further to 2035 using a 2 Stage Free Cash Flow to Equity model. By 2029, projected free cash flow is $1.3b, and the model then tapers those estimates in later years, all expressed in $ and discounted back to today.
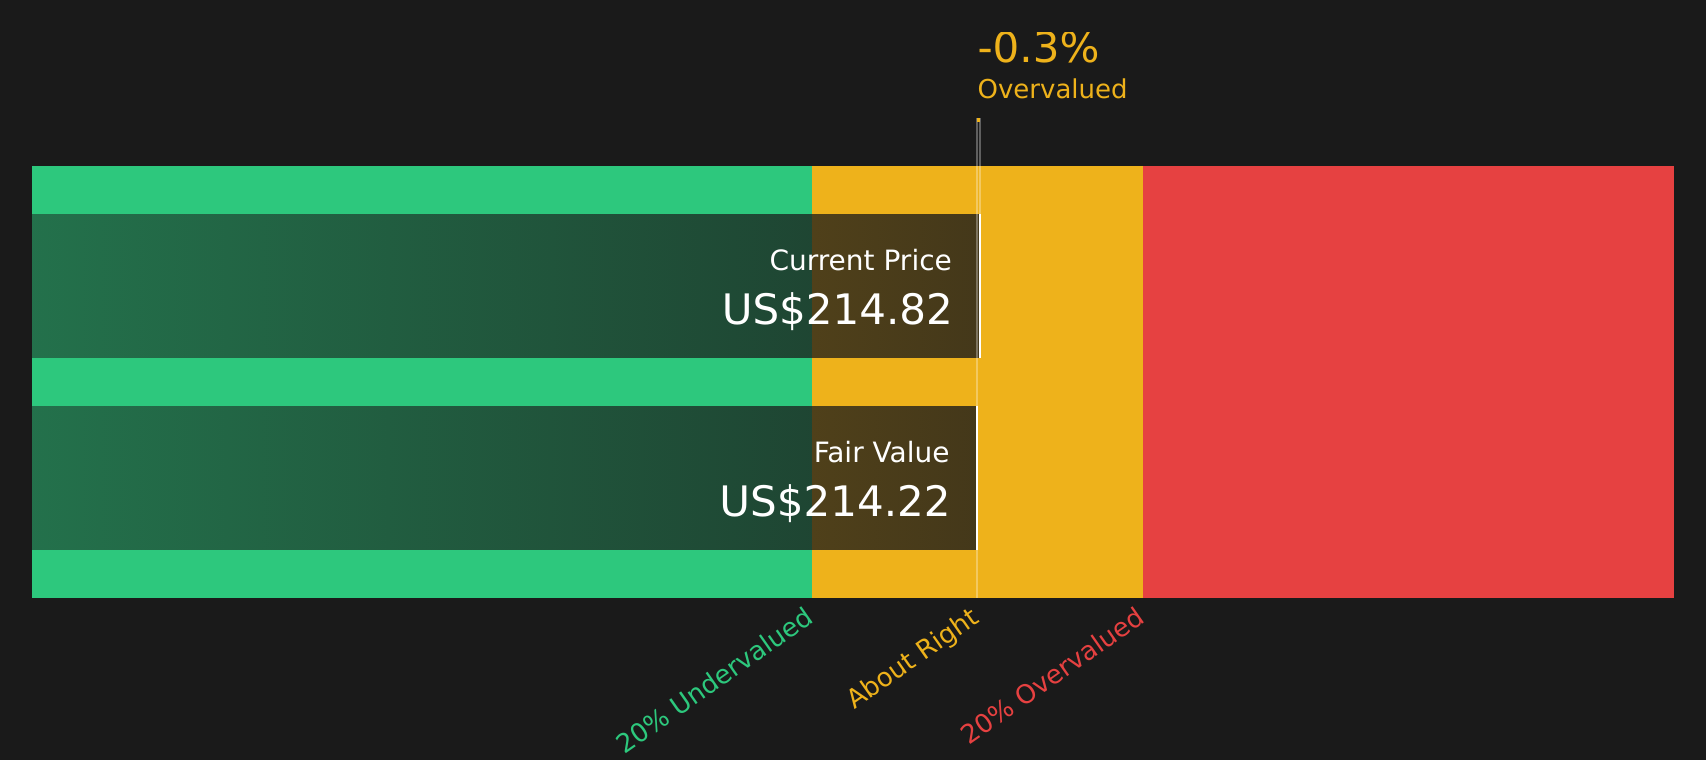
Adding up these discounted cash flows and the terminal value leads to an estimated intrinsic value of about $214.22 per share. Compared with a current share price of around $214.82, the DCF output suggests Royal Gold is roughly 0.3% more expensive than this model’s estimate, which is effectively a rounding difference for most long term investors.
Result: ABOUT RIGHT
Royal Gold is fairly valued according to our Discounted Cash Flow (DCF), but this can change at a moment’s notice. Track the value in your watchlist or portfolio and be alerted on when to act.
Approach 2: Royal Gold Price vs Earnings
For a profitable company like Royal Gold, the P/E ratio is a useful way to think about what you are paying for each dollar of current earnings. Investors typically accept a higher or lower P/E depending on what they believe about a company’s future growth and the risks around those earnings, so there is no single “right” number.
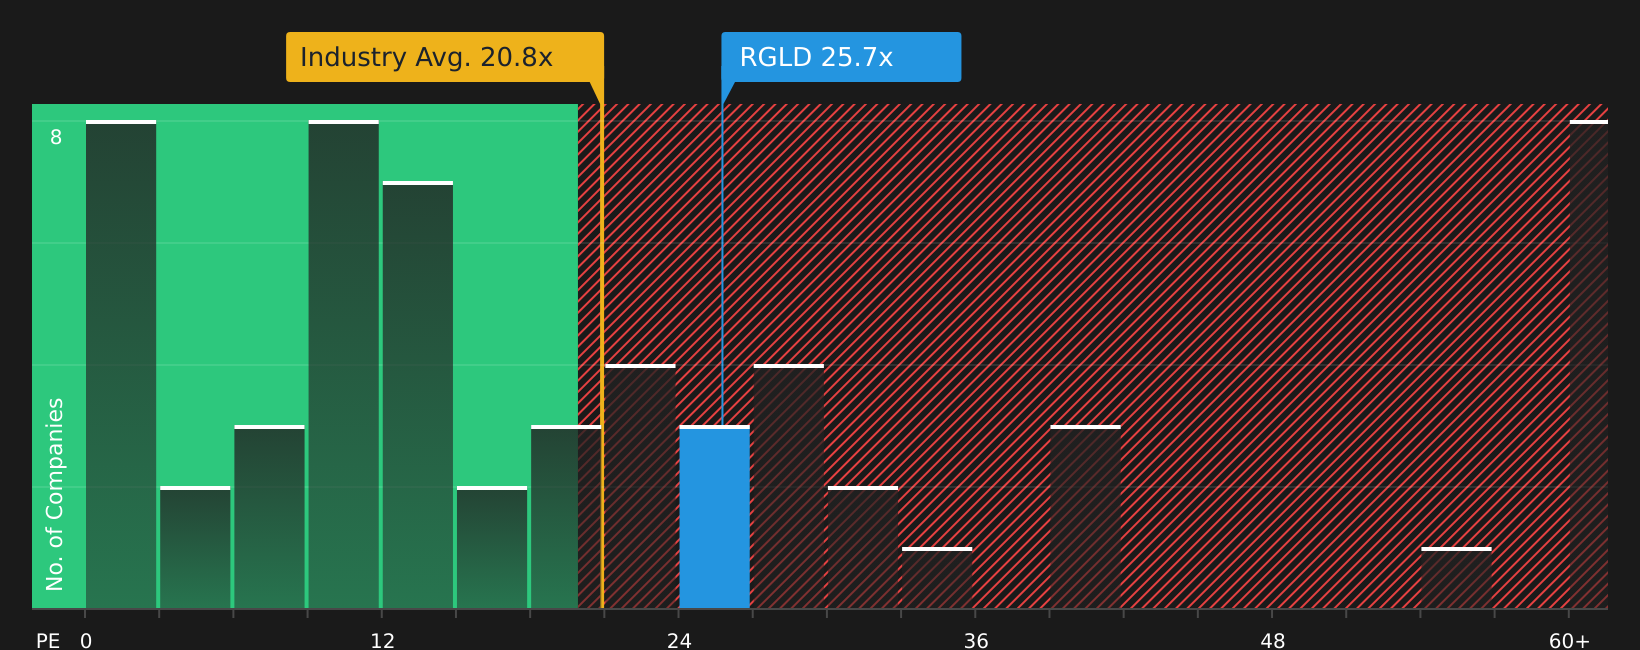
Royal Gold currently trades on a P/E of 28.8x. This sits above the Metals and Mining industry average P/E of 18.1x and slightly above the peer group average of 27.8x. On these simple comparisons, the stock is priced at a premium to both its sector and similar companies.
Simply Wall St’s Fair Ratio is designed to refine this view. It is a proprietary estimated P/E, here at 24.6x for Royal Gold, that reflects factors such as earnings growth, profit margins, industry, market cap and company specific risks. Because it adjusts for these drivers, the Fair Ratio can give a more tailored reference point than a broad industry or peer average. Comparing the Fair Ratio of 24.6x with the actual P/E of 28.8x suggests Royal Gold is trading above what this framework would imply.
Result: OVERVALUED
P/E ratios tell one story, but what if the real opportunity lies elsewhere? Start investing in legacies, not executives. Discover our 20 top founder-led companies.
Upgrade Your Decision Making: Choose your Royal Gold Narrative
Earlier Royal Gold was assessed using traditional tools like DCF and P/E, but an even better way to understand valuation is to use Narratives, which are simply your story about the company tied directly to a financial forecast and a fair value. On Simply Wall St’s Community page, Narratives let you plug in your own assumptions for future revenue, earnings and margins, then see what you think Royal Gold is worth and how that compares with today’s price to help you decide whether it looks closer to a buy, a hold or a sell for your portfolio. Because Narratives update automatically when fresh information arrives, such as new Hod Maden restructuring details, analyst target changes or earnings releases, your view stays current without needing to rebuild your model each time. For example, one Royal Gold Narrative might lean toward the higher fair value near US$356.00 if you focus on longer mine lives and a broad royalty portfolio, while another might sit closer to US$246.00 if you put more weight on concentration risk, leverage and execution concerns. Putting those side by side shows you exactly which assumptions drive those very different conclusions.
Do you think there’s more to the story for Royal Gold? Head over to our Community to see what others are saying!

This article by Simply Wall St is general in nature. We provide commentary based on historical data
and analyst forecasts only using an unbiased methodology and our articles are not intended to be financial advice. It does not constitute a recommendation to buy or sell any stock, and does not take account of your objectives, or your
financial situation. We aim to bring you long-term focused analysis driven by fundamental data.
Note that our analysis may not factor in the latest price-sensitive company announcements or qualitative material.
Simply Wall St has no position in any stocks mentioned.
New: AI Stock Screener & Alerts
Our new AI Stock Screener scans the market every day to uncover opportunities.
• Dividend Powerhouses (3%+ Yield)
• Undervalued Small Caps with Insider Buying
• High growth Tech and AI Companies
Or build your own from over 50 metrics.
Have feedback on this article? Concerned about the content? Get in touch with us directly. Alternatively, email editorial-team@simplywallst.com