
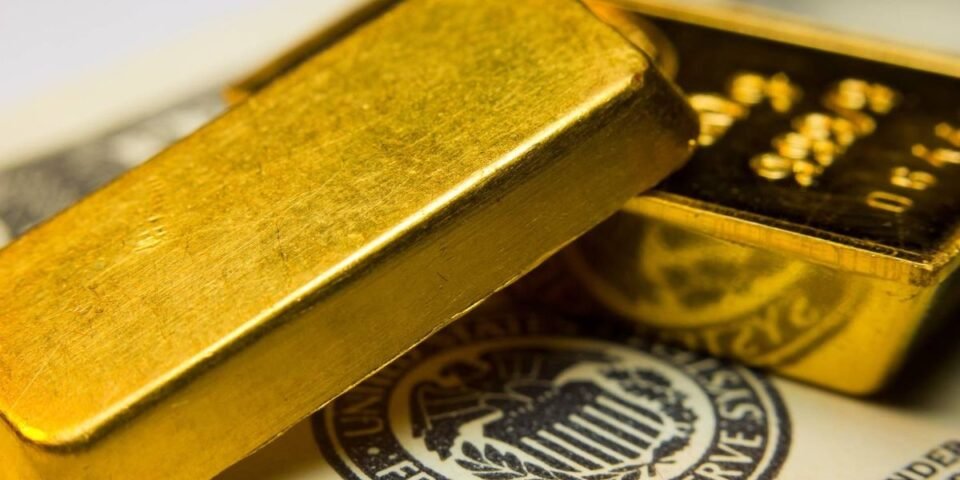
The US Federal Reserve’s decision to hold interest rates steady while signaling a clear bias toward future hikes has propelled gold to new highs while exposing silver’s macroeconomic vulnerabilities.
Following the Federal Open Market Committee (FMOC) meeting on July 29, the central bank maintained the federal funds rate at 3.5 to 3.75 percent.
However, the decision exposed divisions within the central bank. Three regional presidents dissented, voting instead for an immediate 25-basis-point rate hike.
The vote marked the largest hawkish dissent bloc since September 2016, driving US 10-year real yields from 1.7 percent up to 2.4 percent.
How did the Fed decision affect gold and silver?
The divergence in monetary expectations led to an immediate split in the commodities sector.
Gold, historically a risk hedge, absorbed the geopolitical premium tied to the expanding Middle East conflict and ticked upward, rising from US$4,042.23 just prior to the announcement to US$4,104.99 immediately following the press conference.
During his post-meeting briefing, Fed Chair Kevin Warsh eliminated any lingering market assumptions regarding near-term rate cuts, explicitly prioritizing price stability.
“We have begun a new chapter, and we understand that the five-plus years of inflation above target cannot be cured in nine weeks, or by a single month of modest price decreases,” Warsh stated. “This Fed will not waver. Our credibility rests on performing our duties and delivering on our responsibilities.”
But while gold investors looked past the yields to hedge against inflation, silver investors aggressively liquidated.
Silver faced the blunt force of the higher real yields. Following the Fed’s hawkish hold, silver prices settled near US$62.26 by early August, a 49 percent collapse from its January nominal record of US$121.67 per ounce.
The resulting price action severely distorted the gold-silver ratio, which tracks how many ounces of silver it takes to buy one ounce of gold.
The metric surged to 71.1 in July before hovering near 69:1 in early August. That places the ratio near the absolute upper end of its 50-year historical average of 65, signaling that monetary conditions are actively penalizing silver while insulating gold.
“Since the outbreak of the US-Iran conflict, silver has come under significant pressure, driven by a combination of macroeconomic headwinds and weakening physical demand,” analysts at Metals Focus noted in their recent Precious Metals Weekly report.
Safe haven versus industrial asset
The divergent price action between the two metals stems from their fundamentally different market drivers.
Ahead of the FOMC meeting, gold had already priced in the consensus expectation of a rate hold. When the hawkish dissent materialized, bullion investors largely looked past the surging real yields. Instead, they prioritized gold’s utility as a geopolitical safe haven and an inflation hedge, seeking shelter from the expanding conflict in the Middle East and the resulting surge in global energy markets.
Silver lacks the same safe-haven armor. The metal runs on two simultaneous engines: monetary policy and industrial consumption. When the Fed signaled a “higher-for-longer” rate environment, silver’s monetary engine stalled. Surging real yields aggressively increase the opportunity cost of holding the non-yielding metal.
Simultaneously, because 58 percent of annual silver demand comes from manufacturing, the metal carries heavy exposure to cyclical shifts. A hawkish Fed policy threatens to slow economic growth. This meant hitting silver’s industrial appeal at the exact moment its monetary appeal wanes.
Supply deficit for silver remains
Despite the combination of hawkish Fed policy and collapsing retail demand, the industrial foundation of the silver market remains tightly constrained.
The Silver Institute’s World Silver Survey 2026 projects a sixth consecutive annual supply deficit, forecasting that global demand will outpace mine supply by 46.3 million ounces this year.
Industrial consumption accounts for 58 percent of total global demand, which accounts for 657.4 million ounces annually.
Solar photovoltaic manufacturing, electric vehicle production, and AI data-center infrastructure continue to draw massive volumes of physical metal, regardless of the federal funds rate.Global mine supply cannot scale quickly enough to close the 46.3 million-ounce gap. Roughly 70 percent of all mined silver is extracted as a byproduct of copper, lead, and zinc operations.
Compounding the structural deficit, China restricted export approvals to just 44 licensed companies this year to guarantee domestic supply for its own solar and EV manufacturers.
Thus, the silver market is currently operating on two separate timelines. In the near term, financial demand dictating the price leaves the metal highly vulnerable to upcoming macroeconomic data.
In the long term, the 46.3 million-ounce physical deficit remains unresolved. Until industrial demand sinks or new mine supply comes online, silver continues to retain a hard physical floor even as hawkish monetary policy suppresses its financial ceiling.
As of 12:30 p.m. EDT gold is trading for US$4,338 per ounce and silver at US$63.27.
Don’t forget to follow us @INN_Resource for real-time news updates!
Securities Disclosure: I, Giann Liguid, hold no direct investment interest in any company mentioned in this article.