

- On August 19, silver broke below $63.40 one day after testing $66.40, turning a 4.5% trading range from recovery into a bearish setup.
- Free Press Journal reported on August 18 that solar-module silver use could fall 19% in 2026, cutting solar’s share of total silver demand to 14% from 18%.
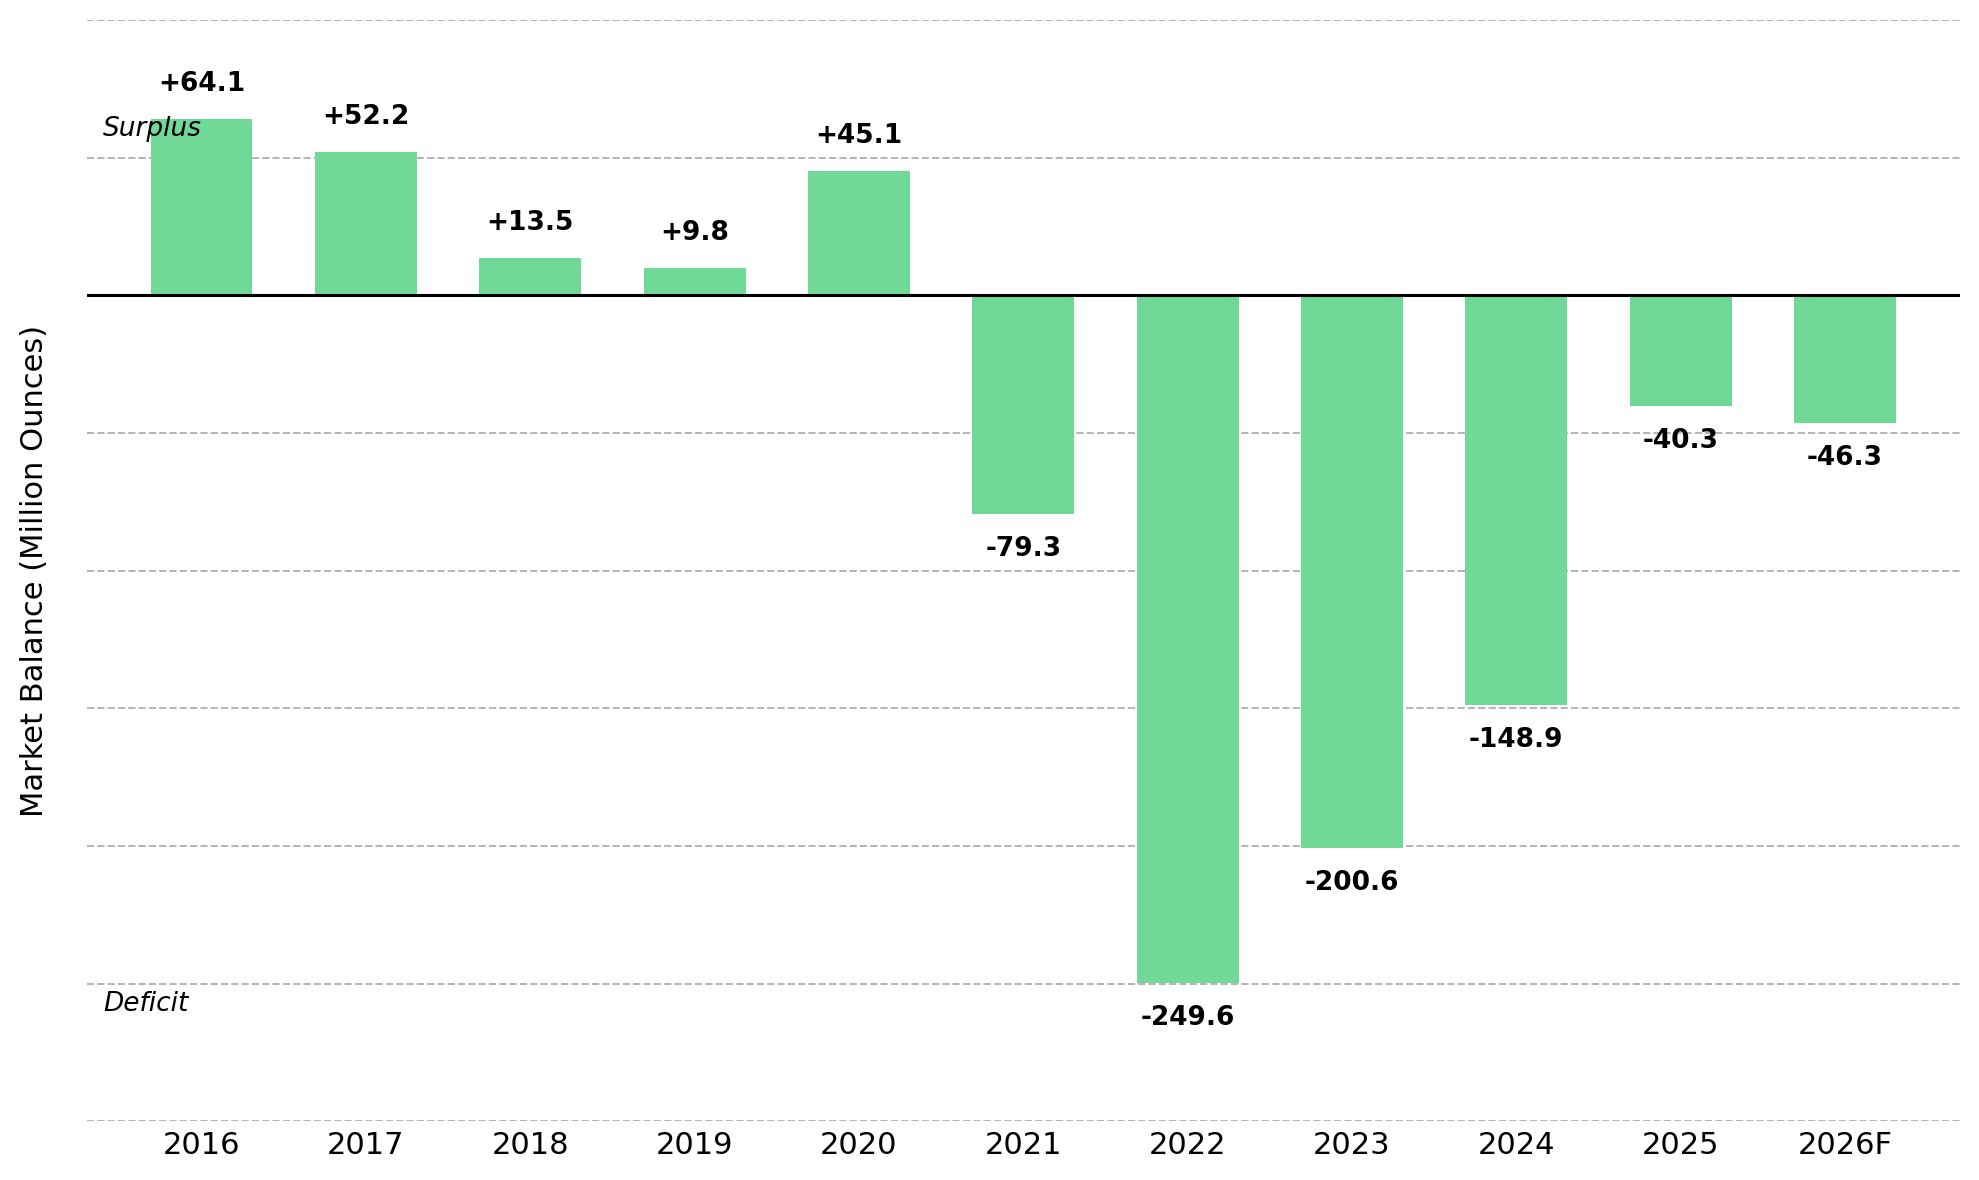
- The Silver Institute’s April 15 World Silver Survey 2026 still forecasts a 46.3Moz market deficit in 2026, up from 40.3Moz in 2025, even with total demand down 2%.
- Reuters reported on April 15 that 762Moz had been drawn from stocks since 2021, while coin and bar demand was forecast to rise 18%, keeping the contrarian supply case intact.
- A sustained reclaim of $63.40 would weaken the breakdown signal, while $66.40 would confirm a stronger recovery. Failure keeps $61.80 in focus as the next technical test.
Silver Breaks $63.40 as Solar Demand Falls, but Deficit Caps Bear Case
Silver broke below its EMA50 and the $63.40 neckline one day after failing at $66.40, which turned a 4.5% rebound range into a bearish short-term setup. The pullback has a demand driver, but it does not prove oversupply.
Free Press Journal reported that solar-module silver use could fall 19% in 2026 and solar’s share of total demand could drop to 14% from 18%. The Silver Institute still forecasts 1.11B ounces of demand and a 46.3Moz deficit, so weaker photovoltaic demand cuts consumption without closing the supply gap.
High Silver Prices Cut Solar Use 19% as Flat Mine Supply Sustains Deficit
Solar manufacturers have a clear reason to cut silver loadings because silver accounts for more than 17% of module production costs. Free Press Journal said silver remained about 65% above its year-earlier level despite falling roughly half from its late-January peak, while silver use in silicon solar cells could fall another 17% this year.
That cost pressure pushes manufacturers to reduce paste loadings or switch to cheaper materials, which lowers photovoltaic demand even as solar installations keep growing. The Silver Institute forecasts 2026 industrial demand will fall 3%, mainly because of weaker photovoltaic offtake, while mine production stays flat as grade and operating constraints offset gains elsewhere. Lower solar use removes some demand, but a 46.3Moz deficit shows the market still lacks enough supply.
762Moz Stock Drawdown Meets 18% Bar Demand Growth, Reinforcing Silver Tightness
The contrarian case rests on inventory drawdowns, not on dismissing weaker photovoltaic demand. Reuters reported that 762Moz had been drawn from silver stocks since 2021, while Metals Focus estimated that 28% of 884Moz in London vaults at end-March was outside exchange-traded products, up from 17% in September.
The base case widens the deficit to 46.3Moz in 2026 from 40.3Moz in 2025 even though total demand falls 2%, while coin and bar demand rises 18%. Philip Newman, Managing Director at Metals Focus, said London lease rates have largely normalized, but another liquidity squeeze this year remains possible.
Byproduct Supply Limits New Silver Output, Supporting Producers if Prices Recover
Silver above year-earlier levels keeps input-cost pressure on solar manufacturers, while silver-linked producers still benefit from elevated realized prices. A sustained break below $63.40 would narrow that revenue advantage, but supply composition still limits how fast new metal can reach the market. The Silver Institute reported that lead and zinc mines remained the largest silver source in 2025, while output from gold and copper operations rose 5% and 6%.
That mix ties silver supply to host-metal economics and mine plans, which slows the response to silver price moves. Three variables still need monitoring: when photovoltaic thrifting stabilizes, whether London inventories tighten again, and whether silver reclaims $63.40. The contrarian case works best with price confirmation and evidence that the 46.3Moz deficit is not closing faster than forecast.
Silver Reclaims $63.40, Putting Upside in Focus
Silver broke below the EMA50 and $63.40 while relative-strength signals weakened, so the short-term setup stays bearish until that level is recovered. If the breakdown holds, downside risk extends toward the chart’s $61.80 support. A daily close back above $63.40 would remove the immediate neckline break, while a move through $66.40 would restore the earlier recovery setup.
The second trigger requires a 4.7% rise from $63.40, so it offers stronger confirmation than a simple bounce. The LBMA Silver Price, set each business day at 12:00 London time, provides an independent benchmark to check direction alongside the XAGUSD feed. A sustained reclaim above $63.40 is the first signal to reassess the breakdown, while failure to hold that level keeps the contrarian case dependent on tight supply rather than price strength.