
Ru-O π ligand strengthening strategy
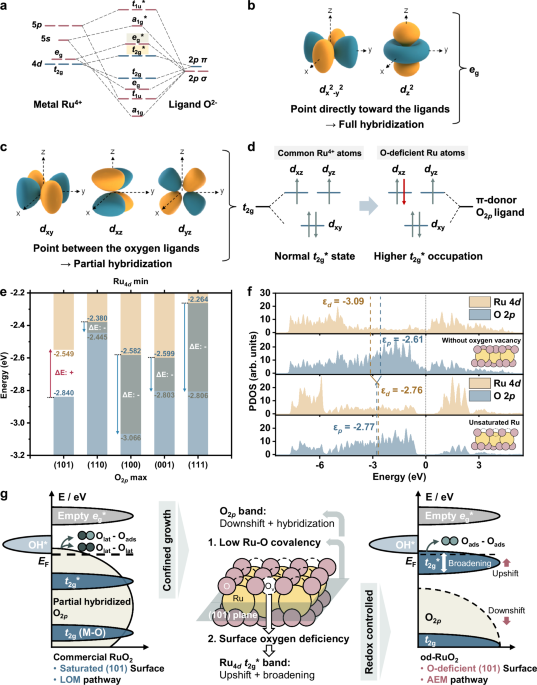
To determine the feasibility of Ru-based catalysts being rationally engineered to achieve both high stability and high activity for the OER, we first investigated their intrinsic electronic properties through theoretical analysis. According to the fundamental principles of the AEM, the low covalency of the metal–oxygen (M–O) bond, to ensure removal of electrons from Ru 4d orbitals rather than O 2p orbitals, is an essential condition for AEM realization26. However, conventional RuO2 represents a typical high-covalency case, characterized by a small energy gap between the Ru 4d and O 2p states (a small charge transfer energy Δ, as shown in Fig. 1a). As a result, the t2g* band retains substantial O 2p character near the Fermi level (EF)27,28, which is unfavorable for the AEM because it increases lattice oxygen participation in redox processes. In addition, compared to the σ-type overlap with the Ru eg orbitals (\(d_{z^2}\) and \(d_{x^2-y^2}\), which point directly towards the ligands along the bond axes, as shown in Fig. 1b), the π-type overlap with the t2g orbitals corresponds to a smaller splitting and is weaker (dxy, dxz, and dyz, which are oriented between the oxygen ligands and thus overlap with the O 2p π orbitals sideways relative to the Ru–O bond axes, as shown in Fig. 1c). Consequently, the hybridization of the t2g and O2p orbitals is incomplete. These two factors make the lattice oxygen more redox-active, enabling direct participation in the O–O bond formation step (as the LOM). Therefore, to suppress this undesirable pathway and promote the AEM pathway, a strategy to strengthen the hybridization between Ru t2g orbitals and π-donor oxygen ligands by designing intrinsic structurally engineered RuO2 catalysts is proposed.

a Molecular orbital diagram of RuO2. b, c Shape and directionality with respect to the σ and π ligands of the Ru eg and t2g orbitals for RuO2. d Electron configuration of 4d electrons in od-RuO2, with higher t2g* occupation via coordinatively unsaturated Ru atoms. e Comparison of the PDOS projected on the p orbitals of O atoms and the d orbitals of Ru atoms for common RuO2 oxygen-deficient planes. f PDOS projected on the p orbitals of O atoms and the d orbitals of Ru atoms for the RuO2 saturated (101) plane (top) and oxygen-deficient (101) plane (bottom). g Diagram of the band modulation strategy for switching from the LOM to the AEM pathway. The LOM pathway involves the combination of two lattice oxygen atoms (Olat), or an Olat with an adsorbed oxygen atom (Oads), while the AEM pathway only conducts the combination of two Oads.
Theoretically, π-donor oxygen ligands can be strengthened by introducing coordinatively unsaturated Ru atoms29,30, which promote stronger Ru–O π interactions and facilitate charge redistribution near the Fermi level (a relatively lower Ru valance and higher t2g* occupation, as shown in Fig. 1d). In addition, when oxygen vacancies, which are ubiquitous in metal oxides31, become sufficiently abundant in sufficiently small (nanoscale) particles, the exposed surfaces naturally feature abundant surface oxygen vacancies. These surface oxygen vacancies, corresponding to surface oxygen-deficient Ru atoms, are precisely the targeted active sites, which can provide stronger adsorbate binding than normal oxide sites and assist in adsorbate dissociation at the surface32. This stronger adsorbate binding stabilizes key intermediates (OH*, O*, and OOH*), while promoted adsorbate dissociation helps sustain the AEM pathway by preventing lattice oxygen from directly participating in O–O bond formation. Guided by this insight, to identify a favourable facet for surface oxygen-deficient Ru atoms, theoretical density functional theory (DFT) calculations were conducted. The DFT calculations were performed using idealized models under vacuum conditions. The results showed that the (101) plane of RuO2 possesses both high surface stability and a favorable electronic configuration for AEM. As the AEM pathway benefits from minimal occupation of O 2p orbitals near the Fermi level33, projected density of states (PDOS) calculations across all the planes reveal that the (101) surface displays a positive energy band separation (ΔE = +0.29 eV, as the energy difference between the lowest Ru 4d state and the highest O 2p state near the Fermi level), significantly distinct from the negative ΔE of other low-index planes (Fig. 1e and Supplementary Fig. 1). This pronounced band separation effectively reduces Ru–O covalency and suppresses O 2p participation, thereby promoting electron transfer from Ru 4d orbitals rather than lattice oxygen. Such an electronic configuration provides a clear basis for the AEM preference on the (101) plane, accounting for its stability under acidic OER conditions. Moreover, comparative analysis of saturated and unsaturated (101) surfaces indicates that the introduction of surface oxygen vacancies on (101) plane can markedly increase the Ru t2g and O π hybridization by broadening and upshifting the Ru 4d t2g band occupation (band center εd from –3.09 eV to –2.76 eV) and reducing the electron density of O 2p orbitals (band center εp from –2.61 eV to –2.77 eV) near the Fermi level, thereby promoting preferential adsorption of OH⁻ at Ru active sites (Fig. 1f). Overall, oxygen-vacancy formation lowers the Ru valence and increases the Ru-centered 4d electron density, while the designed oxygen-deficient (101) facet induces an upshifted and broadened Ru 4d distribution, increasing the Ru 4d contribution in the frontier-energy region near the Fermi level. Together with the downward shift of O 2p states, this electronic redistribution promotes Ru-centered adsorbate evolution and suppresses lattice oxygen redox participation. Concurrently, the pre-existing surface vacancies on the (101) surface not only enable the OER to efficiently proceed at surface sites but also impart strong resistance to new internal lattice oxygen loss and minimize structural degradation, as evidenced by its highest calculated oxygen vacancy formation energy (EOvac = 5.91 eV) among the commonly observed low-index RuO2 surfaces (Supplementary Fig. 2 and 3).
In general, the orbital hybridization calculations and oxygen vacancy formation energy calculations complement each other and establish the intrinsic electronic and structural basis for AEM-favorable od-RuO2. Therefore, unlike previous approaches that relied solely on dopant modification or external strain to adjust electronic structures, this method achieves intrinsic modulation of Ru–O orbital interactions by rational structural design. The overall strategy for redox center modulation—combining π-donor ligand strengthening through oxygen vacancy engineering with facet-selective (101) exposure—is schematically illustrated in Fig. 1g.
Defect-inheritance synthesis strategy
To realize the above described surface oxygen-deficient configuration, perovskites are preferentially considered precursors. Typically, in SrCoO3-δ, the cobalt atoms inherently exhibit highly unsaturated coordination (3-δ ≈ 2.52)34, making SrCoO3−δ a particularly suitable host for incorporating Ru atoms and initiating controlled lattice reconstruction. Therefore, a tailored defect-inheritance synthesis route involving a straightforward and scalable sol-gel method with SrCoO3-δ as a precursor, followed by a hydrothermal process, was employed. First, metal nitrates were gelled to form a liquogel, which was air annealed to transform it into a Ru-doped perovskite precursor, SrCo1-xRuxO3-δ (Fig. 2a and Supplementary Fig. 4). Within this perovskite lattice, Ru and Co atoms are strongly bonded within oxygen octahedra, whereas Sr atoms occupy weakly bonded cuboctahedral sites and readily leach under acidic hydrothermal conditions (Fig. 2b). This selective Sr dissolution triggers complete structural reconstruction, during which the confinement effect of the cobalt spinel oxide promotes nanoscale growth of RuO2. Most residual cobalt oxide species, which exist as independent phases, can be removed during the subsequent rinsing process, as confirmed with inductively coupled plasma mass spectrometry (ICP–MS) results (Supplementary Fig. 5). As a result, the reconstructed RuO2 inherits the oxygen-deficient environment of the perovskite, yielding the final od-RuO2 catalyst (Fig. 2c). The aforementioned (101) lattice plane is particularly suited for stabilizing surface oxygen vacancies, as the (101) plane has the lowest surface energy (Esurf) among the commonly observed low-index RuO2 surfaces when vacancies are primarily distributed at the surface (Supplementary Fig. 6), indicating its thermodynamic stability that favors its preferential formation, verifying the thermodynamic feasibility of forming the oxygen-deficient (101) surface during synthesis reconstruction. By leveraging a rational perovskite-to-oxide transformation, this defect-inheritance synthesis strategy enables precise control over the spatial distribution of surface defects and electronic structure, which ensures the synthesis of od-RuO2 nanoclusters with a high density of AEM-favorable active sites, integrating structural stability, electronic optimization, and synthetic feasibility into a single high-performance OER catalyst.

Design scheme of od-RuO2, including a perovskite SrCo1-xRuxO3-δ, b hydrothermal process, and c RuO2 nanoclusters with oxygen-deficient Ru sites on the (101) surface. d HR-TEM image of the od-RuO2 catalyst as nanoclusters. e HAADF-STEM image of the od-RuO2 catalyst with a predominant (101) lattice plane. The upper left image is the partial enlargement of the right STEM image. The lower left image is the FFT diffraction pattern of this region. f EELS mapping images of the od-RuO2 catalyst. The majority of RuO2 covered over the residual cobalt oxide.
To determine if the developed design strategy could provide an od-RuO2 nanocatalyst with high stability and high activity for the OER, the nanocatalyst was synthesized, and its structural properties were examined by morphological characteristics. X-ray diffraction (XRD) confirms the precursor with a crystalline phase corresponding to the perovskite SrCoO2.52 (Supplementary Fig. 7). Whereas, no distinct RuO2 diffraction peaks were observed in the XRD patterns of od-RuO2 (only the baseline could be detected, shown as shown in Supplementary Fig. 8), indicating that this special RuO2 consists of ultrasmall nanoclusters. Previous studies have confirmed that particles having crystalline domain sizes below 5 nm become difficult to analyze, due to both broad peaks and low signal-to-noise ratios35. Next, to further determine the composition of the catalyst, energy-dispersive X-ray spectroscopy (EDS, Supplementary Fig. 9) and electron energy loss spectroscopy (EELS, Fig. 2f) were performed. Although both Ru and Co signals were present, the cobalt oxide only served as original sites for the defect-inheritance of Ru, and most of cobalt also dissolved during the acidic hydrothermal process, as only some residual signals remained that were not completely washed away. The EELS analysis of randomly selected regions revealed that Ru predominantly covered the cobalt oxide, thereby suggesting that the residual cobalt oxide just serves as a constraint or a support for od-RuO2 recombination and growth, rather than serving as the exposed active sites. The O signal is reduced in regions with the highest Ru intensity, indicating the possible presence of substantial surface oxygen vacancies.
To ensure high exposure of a specific lattice plane, the particle size of od-RuO2 should be in the nanoscale range. High-resolution transmission electron microscopy (HR-TEM) images confirmed the morphology of od-RuO2 as dispersed nanoparticles with uniform sizes, averaging 2 – 4 nm in diameter (Fig. 2d and Supplementary Fig. 10). High-angle annular dark-field scanning TEM (HAADF-STEM) images (Fig. 2e) revealed Ru as brighter atomic columns, corroborating the presence of nanoscale RuO2 clusters, while only negligible Co3O4 was observed. The statistical result of fast Fourier transform (FFT) diffraction pattern analysis of identifiable regions across all STEM images (Supplementary Figs. 11 and 12) shows that the majority of these nanoparticles displayed well-defined lattice fringes corresponding to the (101) plane of rutile RuO2, with a lattice spacing of 0.25–0.26 nm. Notably, this orientation significantly dominated over the common (110) plane typically observed in commercial RuO2. As designed by theoretical calculations, this preferential exposure of the (101) facet is significant because the (101) surface possesses distinct orbital hybridization characteristics and higher oxygen vacancy formation energy that stabilize surface-deficient configurations and favor the AEM over the LOM. Therefore, given the ultrasmall nanocluster size (possessing a high surface-to-volume ratio) and the statistically and theoretically predominant exposure of the (101) facet, a substantial fraction of oxygen-deficient Ru sites is expected to be enriched at or near the (101) surface. These results suggest that the hydrothermal process not only confines RuO2 growth to nanoclusters, avoiding overgrowth into larger crystallites, but also favors specific lattice plane exposure, potentially endowing the material with observed catalytic properties. These morphological results preliminarily indicate that a targeted nanocatalyst with the desired surface oxygen-deficient configuration has been synthesized.
Characterization of od-RuO2
To experimentally identify the oxygen-deficient configuration of od-RuO2 in depth, its microstructure and electronic properties were further investigated. Electron paramagnetic resonance (EPR) was utilized for preliminary detection of the overall oxygen vacancy state of the catalyst. EPR signals around g ≈ 2 are commonly associated with unpaired electrons trapped at oxygen-vacancy-related defect sites in metal oxides36,37,38. More notable peaks were observed for both the perovskite precursor and od-RuO2 than for commercial RuO2 (Fig. 3a), indicating that significant oxygen vacancies were introduced into od-RuO2 from the perovskite, consistent with the design strategy.

a EPR spectra of od-RuO2, the perovskite precursor, and commercial RuO2. The typical peaks for oxygen vacancies are at a g-factor of ~2. b Ru K-edge XANES spectra of od-RuO2, Ru foil, commercial RuO2, and commercial RuCl3. The inset image is the partial enlargement at half-peak intensity region, indicating the valence states. c Ru K-edge FT-EXAFS spectra of od-RuO2 and commercial RuO2, where R denotes the radial distance. No phase shift correction was applied. The first shell feature is assigned to the Ru–O coordination shell on the basis of the subsequent EXAFS fitting. The higher shell features occur at apparent radial positions comparable to those observed for typical RuO239,40,41. The Ru K-edge WT-EXAFS of d od-RuO2, e commercial RuO2, and f Ru foil, where k represents the wavenumber of the emitted photoelectron. g FT-EXAFS fitting of od-RuO2, with a fitted coordination number of ~5.5. The window shows the fitting range of the first shell. h O K-edge XANES spectra of od-RuO2 and commercial RuO2. i Ru L2-edge XANES spectra of od-RuO2 and commercial RuO2.
X-ray absorption fine structure (XAFS) analysis was further employed to elucidate the local chemical environment and oxidation state of Ru in od-RuO2. The Ru K-edge X-ray absorption near-edge structure (XANES) spectra (Fig. 3b) were compared with those of references, including Ru foil, commercial RuCl3, and commercial RuO2, which correspond to typical oxidation states. The white-line intensity confirmed that the predominant substance was RuO2, whose spectrum was clearly distinct from that of RuCl3. The half-peak K-edge energy revealed that the oxidation state of Ru in od-RuO2 lay between those in commercial RuO2 and commercial RuCl3, indicating an intermediate valence between +3 and +4. The first derivative of the Ru K-edge XANES spectra, the Ru L3-edge X-ray absorption spectra, and also the X-ray photoelectron spectroscopy (XPS) further corroborated this electronic structure (Supplementary Figs. 13, 14, and 15). Notably, as shown in the L2-edge spectra (Fig. 3i), the t2g peak, which was prominent in commercial RuO2, was absent in od-RuO2, indicating substantial filling of the t2g orbitals and thereby a lower Ru valence state in od-RuO2 than in commercial RuO2, corroborating the K-edge XAS results. This reduced oxidation state of Ru is significant, as it serves as supplementary evidence for the abundant pre-existing oxygen vacancies and an upshift in the Ru 4d band. This reduced Ru oxidation state in od-RuO2 indicates a markedly higher t2g* occupation near the Fermi level, thereby facilitating the targeted stronger Ru–O π interactions and contributing to it following the AEM pathway.
To gain insights into the coordination environment and verify the presence of unsaturated Ru sites implied by the morphological analysis, the Fourier transform extended X-ray absorption fine-structure (FT-EXAFS) spectrum (Fig. 3c) of od-RuO2 in R space (the radial distance from a central absorbing atom to its neighboring atoms) exhibited a prominent peak at approximately 1.50 Å, corresponding to the Ru–O coordination shell. Additional peaks at ~2.70 Å, ~3.2 Å, and ~4.1 Å were attributed to different Ru–Ru coordination shells39,40,41. These Ru–Ru peaks had reduced intensities compared with the commercial RuO2, consistent with short-range ordering in nanoclusters and limited long-range crystallinity. The wavelet transform of EXAFS (WT-EXAFS) analysis more intuitively substantiates this conclusion (Fig. 3d–f). In contrast to the commercial RuO2, od-RuO2 exhibited substantially weaker Ru-Ru scattering signals in Ru K-edge WT-EXAFS, indicating the formation of these nanoscale clusters rather than extended crystalline domains. The resulting high degree of dispersion leads to increased exposed surface area. Therefore, the observed unsaturated coordination Ru atoms could have a greater tendency to emerge on the surface. In addition, for more in-depth illustrating the bonding state, the WT-EXAFS plots of both Ru K-edge and Co K-edge for od-RuO2, standard RuO2, and standard Co3O4 are demonstrated (Supplementary Fig. 16). As reported previously42, the bonding of Ru and Co will induce a significant and characteristic shift of local maximum to a lower k region for Ru K-edge plots or a higher k region for Co K-edge plots relative to the corresponding Ru–Ru and Co–Co scattering features. Notably, the local maximum of od-RuO2 at the Ru K-edge (even though the Ru-Ru bonding is weak) remains consistent with that of standard RuO2. Accordingly, no local maximum of the residual Co species in od-RuO2 emerges at the higher k region than the standard Co-Co region in the Co K-edge spectra. These results collectively indicate that no Ru-Co bonding is observed in od-RuO2.
Quantitative analysis through FT-EXAFS fitting (Fig. 3g) further confirmed unsaturated coordination of the Ru atoms in od-RuO2. The coordination number for Ru in od-RuO2 was determined to be approximately 5.5, with an average Ru–O apparent radial position in the first shell of 1.5 Å. This coordination number was notably lower than the ideal coordination number of 627 (Supplementary Fig. 17), providing further evidence for the effectiveness of the defect-inheritance strategy, whereby the oxygen-deficient environment of ruthenium and cobalt in the Ru-doped perovskite is successfully transferred to the reconstructed RuO2 (Supplementary Fig. 18). As the reduced coordination environments in Ru-based catalysts are associated to enhanced adsorption dynamics43, these surface oxygen-deficient Ru sites serve as nucleophilic centers for OH⁻ adsorption, which plays a crucial role in increasing the OER activity. However, unlike other reports that rely on dopant elements, the od-RuO2 accesses both high reactivity and improved stability by intrinsic structure design with specified tuned local coordination on target surfaces—not merely creating more vacancies.
Moreover, the O K-edge spectra (Fig. 3h) were investigated to confirm the presence of oxygen vacancies and the preference for the AEM pathway. Compared with commercial RuO2, the od-RuO2 spectrum exhibited a clear inversion in the relative intensities of the t2g (530.7 eV) and eg (533.7 eV) peaks, with the t2g peak becoming weaker than the eg peak, in contrast to the trend observed in the commercial RuO2. This inversion indicates the increased electron occupation of the od-RuO2 t2g band (consistent with the Ru L2-edge results, Fig. 3i), supporting a reduction in the Ru valence. In addition, the intensities of both the t2g and eg peaks were considerably decreased in the od-RuO2 spectrum, suggesting a markedly weakened Ru–O covalency and providing additional evidence for AEM pathway promotion. Furthermore, the narrowed energy gap between the t2g and eg peaks also implied an upshift of the t2g band, which would facilitate more rapid electron transfer.
These findings provide compelling evidence that the hydrothermal reconstruction process effectively transforms the perovskite precursor into surface-distributed RuO2 nanoclusters. In this synthesis strategy, the reconstruction process spatially confines the growth of od-RuO2 from the cobalt spinel oxide, thereby preventing overgrowth into larger crystalline domains. The resulting od-RuO2 (compared with commercial RuO2) exhibits a relatively low Ru valence state, a weakened Ru–O covalency, and surface unsaturated coordination of Ru. Collectively, these features endow od-RuO2 with an optimized electronic structure favorable for the AEM-dominated OER pathway, bridging the long-standing trade-off between activity and stability in acidic environments. This design concept not only advances the understanding of structure–activity relationships in Ru-based catalysts but also offers a generalizable strategy for developing next-generation acid-stable electrocatalysts for scalable hydrogen production and related electrochemical energy technologies.
Electrocatalytic performance
Having determined the structural and electronic properties of od-RuO2, its electrocatalytic performance for the OER was next evaluated to verify the capability advantages imparted by the designed surface structure. The OER performance of the catalysts was systematically assessed in a 0.5 M H2SO4 electrolyte at 25°C using linear sweep voltammetry (LSV), with commercial RuO2 and pure Co3O4 (to exclude any contribution from the activity of Co3O4) serving as references. An iR compensation of 90% was applied to all polarization curves unless stated otherwise (the non-iR corrected results are presented in Supplementary Fig. 19). The optimized sample of od-RuO2 catalyst exhibited an overpotential to reach 10 mA cm-2 (η10) of 161 mV, significantly outperforming commercial RuO2 (η10 = 352 mV) and Co3O4 (η10 = 543 mV, with limited OER activity when Co acted as the active site) (Fig. 4a). Correspondingly, the Tafel slope (a kinetic parameter describing the required amount of overpotential increase for every tenfold rise in current density) of od-RuO2 was determined to be 62.4 mV dec-1 (Fig. 4b), indicating more favorable OER kinetics compared with those of commercial RuO2 (97.4 mV dec-1) and Co3O4 (231.5 mV dec-1). The electrochemical surface area (ECSA), which reflects truly active catalyst surface area, was evaluated to further understand the intrinsic activity of the catalysts. According to the non-faradaic method, ECSA is proportional to the electrochemical double-layer capacitance (Cdl), which can be obtained from cyclic voltammetry (CV) in a non-faradaic potential region. The od-RuO2 exhibited a Cdl value of 89.22 mF, markedly higher than those of commercial RuO2 (27.80 mF) and Co3O4 (3.45 mF) (Fig. 4c). The LSV curves normalized to the ECSA (Fig. 4d) indicated that od-RuO2 demonstrated not only a substantially larger number of electrochemically active sites but also higher intrinsic activity per unit area, which indicates that od-RuO2 possesses improved intrinsic catalytic activity, not merely a larger surface area, thus demonstrating the effectiveness of the rational surface engineering strategy. In addition, to further clarify that the role of Co3O4 in this work is structural rather than catalytic, the OER performance of parallel samples with varying rinsing cycles was evaluated (Supplementary Fig. 20). The samples with lower Co content after different rinsing times not only do not show performance loss, but even show a certain degree of improvement. Overall, the samples with varying rinsing times exhibited essentially consistent high performance, as Ru species themselves are the real active sites.

a OER polarization curves of od-RuO2, with commercial RuO2 and standard Co3O4 as reference samples. b Tafel slope curves of od-RuO2, with commercial RuO2 and standard Co3O4 as reference samples. c Cdl plots and d ECSA-normalized polarization curves of od-RuO2, commercial RuO2, and standard Co3O4. e Chronopotentiometric (CP) response of od-RuO2 and commercial RuO2 at 10 mA cm−2. The inset image is the partial enlargement of the initial stage of stability performance. f AST polarization curves and overpotential at 10 mA cm-2 of od-RuO2 after 0 to 65,000 cycles. Unless otherwise specified, all referred tests were systematically conducted in a 0.5 M H2SO4 electrolyte at 25 °C. An iR compensation of 90% was applied to all polarization curves unless stated otherwise.
To optimize the synthesis process for achieving the highest catalytic activity, a series of od-RuO2 samples were prepared with the same method by varying the Ru:Co molar ratio and the hydrothermal pH, temperature, and reaction time. Among these samples, the sample derived from the perovskite with an initial composition of SrCo0.8Ru0.2O3 (20% Ru) exhibited the highest catalytic activity (Supplementary Fig. 21). Consequently, a Ru:Co molar ratio of 20% was identified as optimal and selected as the standard for further characterization. The hydrothermal pH, which is a critical parameter modulating the extent of the reconstruction process, was also investigated. The pH was systematically controlled by varying the amount of acid added, with the tested pH values ranging from 0.1 to 1.6. Both excessive and insufficient acid negatively affected the performance (Supplementary Fig. 22). Insufficient acid likely impeded extraction of Co and Ru from the perovskite, resulting in incomplete recombination. Conversely, excessive acid could have caused overdissolution of Co, leading to insufficient confinement of Ru growth and a subsequent reduction in nanocluster formation. Additionally, highly acidic conditions with strong oxidizing HNO3 were considered to be associated with overoxidation and loss of Ru (as Ru oxidation state over +4, e.g., RuO4, will be soluble19,44), thereby impairing nanocluster formation and further decreasing the catalytic activity. Other synthesis parameters, including the hydrothermal temperature and reaction time, were similarly optimized (Supplementary Fig. 23). While a too low temperature or a too short reaction time resulted in incomplete transformation of the perovskite precursor to the final catalyst and thus reduced activity, extending the reaction time or increasing the temperature to beyond a certain threshold did not result in further performance enhancements. Under optimal conditions (150 °C for 12 h), the reconstruction process was complete, and the resulting od-RuO2 samples displayed consistent activity (used for all aforementioned characterization). In addition, unless otherwise specified, a standard catalyst loading of 5 mg cm-2 (with Ru atom content of ~50%, Supplementary Fig. 5) was appropriately set for all electrochemical measurements (Supplementary Fig. 24).
Durability tests in acidic media, which are a key benchmark for practical applications, were performed to determine the long-term stability of od-RuO2. The chronopotentiometric (CP) response, an electrochemical test that measures the potential change of a catalyst under a constant applied current density, indicates that the catalyst maintains its activity over time, thus serving as a direct measure of durability. Under a constant OER current density of 10 mA cm-2 in a standard three-electrode water electrolysis cell, od-RuO2 maintained a nearly constant overpotential during more than 3000 h of continuous operation, with an increase of only 4 mV observed during the first 500 h (Fig. 4e). In contrast, commercial RuO2 underwent rapid performance decay ( + 100 mV in 10 h) under the same conditions, underscoring the durability of od-RuO2. Additionally, ICP–MS was used to quantify dissolved Ru species in the filtered electrolyte after the stability tests. The measured concentrations were negligible compared with the theoretical value expected for complete catalyst dissolution ( ~ 20 ppm) as shown in Supplementary Fig. 25, indicating minimal Ru leaching during operation. To further assess structural stability during prolonged operation, post-OER HR-TEM images of the catalyst after long-term acidic OER operation were also statistically analysed (Supplementary Fig. 26 and 27). The catalyst largely retains its nanocluster morphology after extended electrolysis, without obvious degradation or agglomeration. Importantly, the post-OER images also confirmed that the catalyst continues to exhibit a predominantly RuO2 (101)-oriented structure, consistent with the designed facet-selective structure of original od-RuO2. The prolonged acidic OER stability of od-RuO2 was also verified by accelerated stress tests (AST) via fast-scan CV, which revealed only a 5 mV overpotential increase in 0.5 M H2SO4 after 200,000 cycles over a voltage range of 1.2 to 1.4 V vs. reversible hydrogen electrode (RHE) (Supplementary Fig. 28), and only an 18 mV increase after 65,000 cycles over a wider potential window of 1.2 to 1.7 V vs. RHE (Fig. 4f and Supplementary Fig. 29). In addition, supplementary electrochemical measurements were also performed on a glassy carbon (GC) electrode to further validate the catalytic performance of od-RuO2 (Supplementary Fig. 30). As presented in Supplementary Table 1, od-RuO2 demonstrates competitive catalytic activity and stability compared with state-of-the-art Ru-based catalysts for the acidic OER.
Insights into the OER process
To elucidate the OER mechanism of the od-RuO2 catalyst, differential electrochemical mass spectrometry (DEMS) with isotope labeling was employed to identify the source of oxygen evolved during the OER process. The theoretical OER pathways and corresponding expected signals are illustrated in Fig. 5a, b. The typical oxygen products expected for both the AEM and LOM are summarized in Supplementary Table 2.

Schematic illustration of the DEMS process on the RuO2 (101) plane and typical products following the a LOM pathway and b AEM pathway. c Operando DEMS signals of O2 products for od-RuO2 in the electrolyte with H218O. d Operando DEMS signals of O2 products for od-RuO2 in the electrolyte with H216O. e Partial enlargement of the 36O2 and 34O2 signals in d. Gibbs free-energy diagrams of od-RuO2 for the OER under an applied potential of 0 V following f the AEM pathway, g the LOM pathway with Olat–Olat coupling, and h the LOM pathway with Olat–Oads coupling. The symbols and corresponding inset figures of the successive reaction steps in f: *+H2O, the initial state comprising a vacant active site and an interfacial H2O molecule; *OH, the adsorption of OH–; *O, the surface oxygen intermediate formed by deprotonation; *OOH, the O-O coupling by a second adsorption of OH–; *+O2, the regeneration of the vacant active site following further deprotonation and O2 evolution. The symbols and corresponding inset figures of the successive reaction steps in g: O*O, the initial state with two adjacent lattice oxygen atoms; (\({{{\rm{O}}}}_{-}^{*}{{\rm{O}}}\)), the O-O coupling between two lattice oxygen atoms; *+O2, the generation of the vacant active site following O2 evolution; *OH, the adsorption of OH–; HO*OH, a second adsorption of OH–; O*OH, the deprotonation; O*O, regeneration of the initial state following a second deprotonation. The symbols and corresponding inset figures of the successive reaction steps in h: O*O, the initial state with one lattice oxygen atom and one adsorbed oxygen atom; (\({{{\rm{O}}}}_{-}^{*}{{\rm{O}}}\)), the O-O coupling between the lattice oxygen atom and the adsorbed oxygen atom; *+O2, the generation of the vacant active site following O2 evolution; *OH, the adsorption of OH–; HO*OH, a second adsorption of OH–; O*OH, the deprotonation; O*O, regeneration of the initial state following a second deprotonation.
Preliminary ex-situ DEMS results revealed that od-RuO2 likely followed the AEM pathway, as evidenced by the significantly lower 34O2 signal than that for commercial RuO2, as shown in Supplementary Fig. 31. However, ex-situ DEMS still requires supplementation from operando DEMS to definitively confirm the AEM pathway. The key evidence for distinguishing the AEM pathway from the LOM pathway lies in detecting 36O2 formation.
To further substantiate the AEM pathway, operando DEMS was performed using the setup illustrated in Supplementary Fig. 32a. In this integrated system, gaseous products generated at the electrode surface are instantaneously extracted by the vacuum chamber and directly introduced into the mass spectrometer, enabling real-time detection with high sensitivity and accuracy. The experiments were conducted in two stages (Supplementary Fig. 32b), in which H218O and H216O were utilized as the electrolyte in 0.5 M H2SO4. The catalyst was deposited on a porous gas-permeable Au working electrode and subjected to CV between 1.165 V and 2.015 V vs. RHE.
In the first stage, the catalyst underwent 12 CV cycles in the H218O electrolyte. For the AEM pathway, at least one 18O atom derived from the electrolyte is involved in the O2 products. As shown in Fig. 5c, mass spectrometry revealed a minor amount of 34O2 (16O + 18O) initially, arising from the original residual surface 16O coupling with 18OH. The predominant product was 36O2 (18O + 18O), originating entirely from adsorbed 18O. Notably, no 32O2 (16O + 16O) was detected, confirming the minimal involvement of lattice oxygen and supporting the AEM pathway. The catalyst subsequently underwent several additional CV cycles to fully label the surface with 18O.
In the second stage, the catalyst was washed with deionized (DI) water, dried at 25 °C, and then subjected to CV cycling in the H216O electrolyte. If the AEM mechanism is active, only the remaining residual surface adsorbates (containing 18O) would combine with 16OH from the electrolyte, yielding 34O2 as the product initially. With continued cycling, the predominant product should be 32O2 (16O + 16O), originating entirely from adsorbed 16O, while no ³⁶O₂ should be observed. The experimental data confirmed this prediction: ³⁴O₂ signals were detected because of partial 18O exchange, whereas the ³⁶O₂ signal, which would indicate lattice oxygen coupling, was absent (Fig. 5d, e). The combined evidence from operando and ex-situ DEMS measurements unequivocally demonstrates that the OER proceeds predominantly via the AEM mechanism in od-RuO2.
To theoretically investigate the OER mechanism and origins of od-RuO2, the Gibbs free-energy for the AEM and LOM were calculated. The calculations consider adsorption on surface models under vacuum within the computational hydrogen electrode (CHE) framework developed by Nørskov and co-workers45. Although this approach does not fully reproduce the realistic electrochemical environment at the catalyst surface under an applied potential, it can still provide a useful basis for comparing the relative energetic trends of the related reaction pathways. The Gibbs free-energy profiles can directly indicate the lowest-energy OER pathway. On the basis of the aforementioned design strategy, a RuO2 model was constructed with oxygen vacancies on the predominant RuO2 (101) surface. The effect of surface unsaturated coordination Ru atoms on the OER kinetics was investigated. The Gibbs free energies for both the AEM and LOM pathways were calculated to identify the more energetically preferred OER mechanism. For the AEM pathway, the rate-determining step (RDS) was deprotonation of *OH to form *O, with a calculated free-energy change of 1.76 eV, as shown in Fig. 5f. For the LOM pathway, as at least one lattice oxygen is involved in oxygen coupling, two conditions were considered: 1) O–O coupling between two lattice oxygen atoms (Olat) and 2) O–O coupling between a lattice oxygen atom and an adsorbed oxygen atom (Oads). Under the two LOM pathway conditions, the RDS was the formation of O2 from O*O, with substantially higher free-energy changes of 6.07 eV and 2.23 eV, respectively, as shown in Fig. 5g, h. These results confirmed that the AEM pathway is energetically more favorable than the LOM pathway for the oxygen-deficient (101) surface. Additionally, these calculations confirmed that surface oxygen vacancies facilitate adsorption of oxygenated intermediates, effectively reducing the energy barrier for the OER. These mechanistic insights explain the increased OER stability and activity of the designed (101) plane.
In conclusion, the DEMS and DFT results collectively and mechanistically demonstrate that this od-RuO2 catalyst, driven by the design strategy of oxygen-deficient Ru sites, predominantly follows the AEM pathway. This mechanistic insight not only elucidates the origin of the catalyst’s activity and durability but also validates the effectiveness of the oxygen-vacancy–engineered surface design strategy.
PEMWE performance
To assess the practicality of od-RuO2 for water electrolysis under industrial conditions, a PEMWE device was assembled by employing od-RuO2 and commercial RuO2 successively as the anode catalysts, commercial Pt/C as the cathode catalyst, Nafion 115 as the proton-exchange membrane (PEM), porous transport layer (PTL), and gas diffusion layer (GDL), as shown in Fig. 6a. The synthesis of the nanoparticulate od-RuO2 via a scalable modified sol–gel method that is amenable to mass production. To evaluate the electrochemical performance of this PEMWE, the current–voltage (I–V) polarization curves were recorded to determine cell efficiency under different operating current densities, while stability tests were performed to assess long-term durability under constant current operation. The I–V polarization curves demonstrated that the PEMWE device equipped with od-RuO2 achieved a current density of 1.0 A cm–2 at a voltage of only 1.5126 V, compared with 2.1483 V for the device using commercial RuO2 (Fig. 6b), indicating its efficiency. Notably, this od-RuO2 employed PEMWE device even exhibited a voltage of 1.8535 V for a high current density of 3.0 A cm-2, which approached the 2026 PEMWE technical targets (Supplementary Fig. 33) proposed by the U.S. Department of Energy (DOE). Furthermore, continuous operation at 1.0 A cm-2 and 80 °C (conditions representative of typical industrial proton exchange membrane electrolyser operating environments) proceeded for more than 1200 h without observable performance degradation (Fig. 6c). In addition, after a temporary interruption caused by equipment relocation, the original membrane electrode assembly (MEA) was reactivated and subjected to extended durability testing, maintaining stable operation for more than 3000 h (Supplementary Fig. 34). In contrast, the commercial RuO2-based PEMWE exhibited rapid voltage escalation and deactivation under the same conditions, emphasizing the competitive stability and practical applicability of od-RuO2 for long-term acidic water electrolysis and hydrogen production. As presented in Supplementary Table 3, od-RuO2 demonstrates competitive PEMWE performance compared with state-of-the-art Ru-based catalysts.

a Illustration of a single-cell PEMWE device with commercial PEM, PTL, and GDL. b I–V polarization curves with an active area of 25 cm2 under 80 °C. c Voltage‒time curves of the PEMWE device with od-RuO2 and commercial RuO2 at 1.0 A cm–2 and 80 °C. The inset image is the partial enlargement of the initial stage of PEMWE durability performance. d SEM image of the MEA cross-section before PEMWE testing. e, f EDS mapping of the MEA cross-section before PEMWE testing. g SEM image of the MEA cross-section after PEMWE testing. h, i EDS mapping of the MEA cross-section after PEMWE testing.
To further evaluate the structural robustness and degradation behavior of the developed catalyst under realistic operation, post-operation analyses were conducted on the MEA following prolonged PEMWE testing. The cross-sectional scanning electron microscopy (SEM) and EDS analyses of the MEA before and after operation (Fig. 6d–i) confirmed a stable ruthenium distribution at the anode. Although the catalyst layer becomes less morphologically uniform compared with its pristine state, a substantial amount of Ru remains firmly anchored on the membrane surface, indicating minimal catalyst degradation or loss during PEMWE operation. Although further industrial-scale evaluations are ongoing to assess the harsh condition long-term stability, Ru utilization efficiency, and performance under dynamic load conditions, these findings position od-RuO2 as a promising anode catalyst for efficient and durable PEMWE. Future efforts could extend this rational reconstruction approach to other noble or transition metal based systems, offering potential routes to design cost-effective and durable catalysts for large-scale hydrogen production.