
Catalyst synthesis and structural characterization
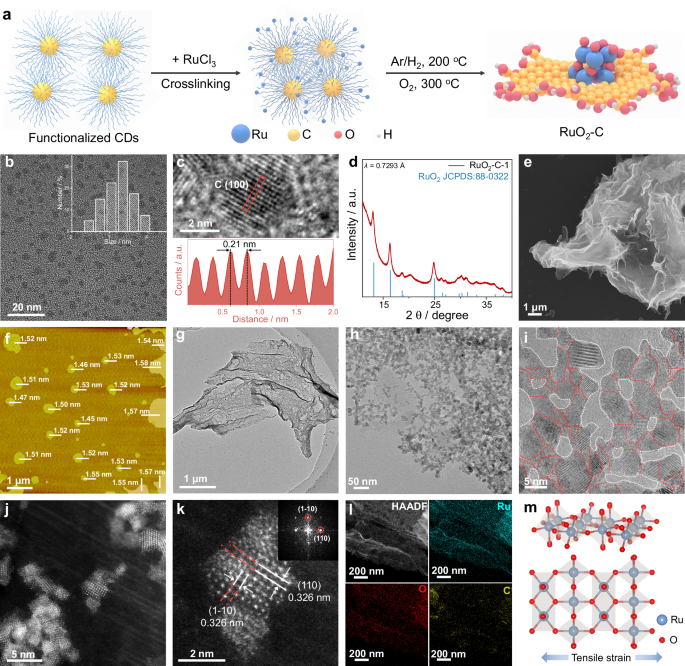
As illustrated in Fig. 1a, we developed a unique “bottom-up” strategy for the synthesis of catalysts (details in “Methods”). Our synthesis strategy begins with carbon dots (CDs) on the basis of the following motivations: (i) Their small size offers a high density of surface anchoring sites for metal atoms. (ii) In addition, the oxygen-rich surface groups (e.g., –OH, –COOH) on CDs enable strong chelation/coordination with metal cations, promoting uniform dispersion and stable anchoring of the metal cations on the CDs surface13. Such strong interactions promote interconnection of the dots and drive their self-assembly into lamellar aggregates during freeze-drying of the Ru3+/CDs mixture13,41. Subsequent annealing reduction under Ar/H2, followed by oxidative annealing in O2, yields the final high density of the carbon-supported RuO2 (RuO2-C) catalyst.

a Schematic representation of the RuO2-C fabrication procedure. b TEM image of the CDs and their size distribution (inset). c High-magnification HRTEM image of the CDs, with the insets below displaying the corresponding intensity profiles (marked by red dashed boxes). d The synchrotron XRD pattern of RuO2-C-1, λ = 0.7293 Å. e SEM image of RuO2-C-1. f AFM image of RuO2-C-1, where individual bars represent the thickness of each nanosheet; the scale bar is provided in the lower left corner. g, h TEM images of RuO2-C-1 at different magnifications. i HRTEM image of RuO2-C-1. The red dashed lines denote the boundaries between adjacent RuO2 domains, whereas the white dashed lines indicate the interfaces between the RuO2 domains and the carbon matrix. j, k Magnified aberration-corrected HAADF-STEM images of RuO2-C-1 and the corresponding fast Fourier transform (FFT) image of (k). l STEM-EDS mapping images of RuO2-C-1. m Simulated metal atomic structure of the RuO2-C-1, where Ru and O are represented by blue and red spheres, respectively.
Specifically, CDs were first prepared via a standard electrochemical etching method42,43. Transmission electron microscopy (TEM) revealed uniformly dispersed particles with an average diameter of 3.24 nm, no obvious aggregation and without observable large graphene-like sheets (Fig. 1b). High-resolution TEM (HRTEM) and the corresponding intensity profile (Fig. 1c) resolve lattice fringes with a spacing of 0.21 nm, which is consistent with the (100) plane of graphite. The Fourier transform infrared (FTIR) spectrum of the CDs shows characteristic bands at 3442 and 1720 cm−1, corresponding to v (O–H) and v (C = O) stretching vibrations43, respectively, indicating abundant hydroxyl and carboxyl groups on the CDs surface (Supplementary Fig. 1).
Next, the as-prepared CDs were used to synthesize RuO2-C catalysts with varying Ru loadings. Specifically, equal volumes of RuCl3 solution were added to different volumes of the CDs dispersion to obtain a series denoted as RuO2-C-x, where x represents the number of different contents of Ru. As shown in Supplementary Fig. 1, upon introducing RuCl3—which itself has no characteristic infrared peaks—into the CDs solution, the FTIR spectra of the resulting RuCl3 + CDs composite retained the v (O–H) and v (C = C) stretching vibration peaks, whereas the stretching vibration peak of the C = O bond significantly weakened or even disappeared. These suggest that Ru3+ may coordinate with the C = O groups on the CDs, leading to partial disruption of bonds and confirming the strong anchoring interaction between the metal ions and the CD surface.
The mixture was then freeze-dried and subjected to a two-step thermal protocol—Ar/H2 atmosphere pre-annealing to consolidate/carbonize the CDs-derived framework, followed by a mild oxidative anneal in O2 to form rutile RuO2 and consolidate interfacial coupling. The O2-annealing parameters were systematically optimized by screening temperature, duration, and oxygen partial pressure (Supplementary Figs. 2–7), revealing that the oxidative annealing process markedly enhanced acidic OER performance. Moreover, the carbon framework—formed by self-assembly of CDs after anchoring metal ions—plays a key role in regulating the spatial distribution of metal species, suppressing particle aggregation, and ultimately tuning catalytic performance9,12,13. As summarized in Supplementary Figs. 8–15, systematic optimization of the synthesis parameters (Ru/C ratio) identified RuO2-C-1 as the optimal sample; it exhibits distinct powder and aqueous appearances from the C-free RuO2 reference (Supplementary Fig. 15a, b) and a Ru mass fraction of 9.1 wt% as determined by ICP-AES (Supplementary Fig. 16 and Supplementary Table 1).
The crystal structure of RuO2-C-1 was confirmed by X-ray diffraction (XRD, Supplementary Fig. 17). The broadened diffraction peaks can be indexed to rutile RuO2 (JCPDS 88-0322), consistent with nanosized RuO2. Due to the low Ru content and quartz-substrate background, the (110)/(101) reflections are weak in laboratory XRD; therefore, synchrotron XRD was further performed to improve the signal-to-noise ratio and more clearly resolve the rutile features (Fig. 1d), with the (110) reflection at 2θ = 13.01° corresponding to an average tensile lattice expansion of ~1.31%. Scanning electron microscopy (SEM, Fig. 1e and Supplementary Fig. 15c) revealed the flexible, laminar morphology of RuO2-C-1, which originates from the CDs-derived assembled carbon framework formed during freeze-drying/annealing. Atomic force microscopy (AFM, Fig. 1f, Supplementary Figs. 15d, e and 18) further confirms the formation of two-dimensional RuO2-C-1 nanosheets with an average thickness of 1.52 ± 0.04 nm. These thin sheets expose more inner-layer Ru atoms, affording a higher density of catalytically active sites.
The TEM and HRTEM images revealed that rutile RuO2 nanocrystallites are uniformly distributed throughout the CDs-derived carbon matrix and are interconnected without excessive aggregation. Pronounced lattice strain and dense grain boundaries are ubiquitous at interparticle junctions (Fig. 1g–i, Supplementary Figs. 15f and 19). To better visualize the existence of the RuO2-carbon interface, we further acquired HRTEM focusing on the interfacial region (Supplementary Fig. 15g), where a strained RuO2 nanocrystal is in direct contact with the surrounding carbon matrix. As shown in Fig. 1i and Supplementary Fig. 19, the lattice spacing is measured to be 0.3257 ± 0.0017 nm and indexed to the RuO2 (110) plane, which is expanded relative to the C-free RuO2 reference (0.318 nm) (Supplementary Fig. 14), supporting tensile strain in RuO2-C-1.
Aberration-corrected high-angle annular dark-field scanning transmission electron microscopy (HAADF-STEM) images further confirmed the pronounced lattice strain in RuO2-C-1 (Fig. 1j, k and Supplementary Fig. 20). Since the atomic number of O and C is much smaller than that of Ru, the oxygen and carbon atoms are too weak to be seen44; thus, these aberration-corrected HAADF-STEM images are primarily used to resolve the RuO2 lattice and evaluate its strain, rather than to directly visualize the carbon atomic structure. Consistently, the exposed RuO2 (110) plane exhibits an enlarged interplanar spacing of 0.3259 ± 0.0019 nm compared with the reference value of 0.318 nm, corresponding to ~2.5% tensile strain and local distortion (Fig. 1j, k and Supplementary Fig. 20). The Ru content measured by TEM-energy dispersive X-ray spectroscopy (TEM-EDX) is consistent with the ICP results (Supplementary Fig. 15h), and the STEM-EDX elemental mapping analysis confirms a uniform distribution of Ru, O and C signals across the entire structure (Fig. 1l and Supplementary Fig. 15i). On the basis of these observations, a model crystal structure for RuO2-C-1 is proposed, which primarily refers to the rutile lattice with an ~2.5% tensile strain (Fig. 1m). These observations indicate that the tensile strain observed in RuO2-C-1 is likely a result of interfacial interactions between the carbon support and RuO2, as well as from the grain boundaries. Recent studies have shown that these types of stress‒strain can increase the catalytic activity of metals11,21,29.
Probing the electronic structure and local structure of the catalysts
To elucidate the effects of interfacial coupling and tensile strain on the surface electronic structure and chemical state, X-ray photoelectron spectroscopy (XPS) measurements were carried out for RuO2-C-1 and all the reference catalysts, and the Ru 3d, C 1s and O 1s spectra were obtained. For pure RuO2, the high-resolution Ru 3d XPS spectrum is deconvoluted into the Ru(Ⅳ) doublets at 281.11 eV (3d5/2) and 285.28 eV (3d3/2), accompanied by shake-up satellites12 (filled in cyan) (Fig. 2a and Supplementary Table 2). Upon the introduction of CDs, the binding energies of Ru 3d5/2 (280.88) and 3d3/2 (285.05) for RuO2-C-1 were negatively shifted (~0.23 eV) compared with that of RuO2 and an additional −0.10/−0.15/−0.20 eV shifted versus RuO2-C-2/-3/-4, respectively (Supplementary Figs. 21–23). This negative shift possibly suggests that Ru in the RuO2-C-1 catalyst presented a lower average Ru valence state and higher electron density than did those in RuO2 and indicates the strong electronic interaction between Ru and the oxygen-functionalized carbon matrix in RuO2-C-1. Moreover, as depicted in Supplementary Fig. 24, RuO2-C-1 exhibits negatively shifted Ru 3p3/2 and Ru 3p1/2 peaks compared with RuO2, consistent with the Ru 3d analysis.

a Ru 3d, C 1s and b, O 1 s XPS spectra of the RuO2-C-1 and RuO2 catalysts. c Acquired C K-edge NEXAFS spectra of the RuO2-C-1 and C catalysts. d The acquired O K-edge NEXAFS spectrum of the RuO2-C-1 catalyst. e Normalized Ru K-edge XANES spectra of RuO2-C-1, Ru foil and RuO2. Inset in (e): enlarged view of the region marked by the black dashed box. f Fourier transformed EXAFS spectra and fitting curves of the Ru K-edge for RuO2-C-1, Ru foil and RuO2. Ru K-edge WT-EXAFS spectra of RuO2-C-1 (g), Ru foil (h) and RuO2 (i). R + ΔR denotes the radial distance including the phase-shift correction term.
Figure 2a shows the C 1s spectrum of the RuO2-C-1, which can be deconvoluted into three components corresponding to the C–C/C = C, C–O, and C = O bonds located at 284.5, 285.9, and 288.4 eV, respectively42,43,45. The O 1s spectra were deconvoluted into lattice oxygen, vacancy-associated oxygen, and a high-binding-energy component attributed to adsorbed oxygen species and, for RuO2-C-1, additional contributions from oxygenated carbon groups (C–O/C = O), consistent with the C 1s results12,21(Fig. 2b). These results confirm that oxygen-containing functional groups on the CDs serve as anchoring and coordination sites for Ru, establishing a strongly coupled interface and introducing tensile strain that underpins the structural stability and electronic modulation of the composite.
To further substantiate the interfacial interaction between RuO2 and the carbon matrix, we conducted near-edge X-ray absorption fine structure (NEXAFS) spectroscopy analysis. As shown in Fig. 2c, the C K edge spectrum of RuO2-C-1 presents three characteristic peaks at ~285.3, 288.4, and 292.2 eV, which are assigned to π* (C = C), π* (C = O), and σ* (C–C), respectively46,47,48. Compared with that of the carbon (C), the π* (C = C) characteristic peak of RuO2-C-1 displays a reduced intensity accompanied by a slight negative shift, and both the σ* (C–C) peaks also shift to low energies. Notably, the π*(C = O) resonance displays an enhanced intensity, indicating increased polarization and electronic rehybridization of carbonyl groups upon coordination with Ru species. The concurrent attenuation of π*(C = C), enhancement of π*(C = O), and low-energy shifts collectively evidence charge redistribution and bond hybridization at the carbon-RuO2 interface, providing direct proof of strong interfacial electronic coupling and local electronic restructuring46,47. The O K-edge XANES spectrum of RuO2-C-1 exhibits two prominent characteristic peaks at ~531.8 and ~534.6 eV, which are assigned to transitions into O 2p states hybridized with unoccupied Ru 4d t2g and Ru 4d eg manifolds, respectively (Fig. 2d)35. Together, these spectroscopic signatures support an oxygen-mediated interfacial coupling (Ru-O-C) through oxygen-containing functionalities, rather than direct Ru-C bond formation49,50,51.
To elucidate the local coordination and bonding configuration of Ru in RuO2-C-1, we performed Ru K-edge X-ray absorption spectroscopy (XAS), including X-ray absorption near-edge structure (XANES) and Fourier-transformed extended X-ray absorption fine structure (FT-EXAFS), with Ru foil and RuO2 as references (Fig. 2e, f). As shown in Fig. 2e (inset), the absorption edge of RuO2-C-1 is located between that of metallic Ru and RuO2, indicating an average Ru valence intermediate between Ru (0) and Ru (IV), which is in agreement with the XPS analysis. The FT-EXAFS spectra in Fig. 2f and Supplementary Fig. 25 reveal that the Ru–O bond length in the first coordination shell of RuO2-C-1 is slightly longer than that of standard RuO2. The peak at 3.19 Å in RuO2-C-1 corresponds to the backscattering of Ru-Ru in the second coordination shell, resulting in a lower vibrational amplitude than that of RuO2, which is attributed to the smaller size of the nanoparticles18,25. Moreover, the Ru-O peak intensity of RuO2-C-1 is slightly weaker than that of standard RuO2, likely due to the introduction of oxygen vacancies at the interface caused by tensile strain, which reduces the coordination number of Ru21. The EXAFS fitting results (Supplementary Table 3) confirm that the coordination number for Ru-O in RuO2-C-1 is 5.8, which is lower than that in RuO2, providing further evidence of the structural modifications.
To strengthen the shell assignment and reduce ambiguity from overlapping contributions in conventional FT-EXAFS, we further performed wavelet-transform EXAFS (WT-EXAFS) analysis (Fig. 2g–i), which maps the EXAFS intensity simultaneously in R and k space and enables separation of light-atom (Ru-O) and heavy-atom (Ru-Ru) scattering contributions52. In the WT-EXAFS, Ru foil is dominated by a high-k Ru–Ru feature, whereas rutile RuO2 exhibits a distinct Ru-O contribution at lower k together with a higher-k Ru-Ru component. RuO2-C-1 preserves these RuO2-like Ru-O/Ru-Ru signatures but shows a more diffuse/attenuated Ru–Ru intensity and a slightly broadened Ru-O feature, consistent with weakened higher-shell order and increased local disorder/strain in the composite53. These WT-EXAFS results corroborate the FT-EXAFS fitting, supporting an oxide-like Ru coordination environment in RuO2-C−1 while highlighting strain/interface-induced local distortion relative to standard RuO2. XAS provides compelling evidence that interfacial coupling between the carbon support and RuO2, together with grain-boundary effects, induces tensile strain in RuO2-C-1. This strain generates an unsaturated coordination environment and effectively tunes the local electronic state of Ru11,21,25.
Electrochemical OER performance
To demonstrate the catalytic advantages arising from interfacial coupling and tensile strain, we assessed the OER performance of RuO2-C-1 in a conventional three-electrode setup using O2-saturated 0.5 M H2SO4. and compared with those of the homemade RuO2 (RuO2; Supplementary Fig. 14), commercial RuO2 (C-RuO2; Supplementary Fig. 26), and commercial IrO2 (C-IrO2; Supplementary Fig. 27). The saturated calomel electrode (SCE) and carbon rod were served as the reference and counter electrodes, respectively. The SCE was first calibrated against the reversible hydrogen electrode (RHE) before the test (Supplementary Fig. 28). The RuO2-C-x series was screened under identical conditions to identify the optimal Ru/C ratio (Supplementary Fig. 29), establishing RuO2-C-1 as the best-performing composition. As shown by the linear sweep voltammetry (LSV) curves presented in Fig. 3a and Supplementary Fig. 30, RuO2-C-1 delivers the most active polarization response, requiring a low overpotential of 140 mV to reach 10 mA cm−2, substantially lower than that of the as-prepared RuO2 (η10 = 215 mV), C-RuO2 (η10 = 270 mV), and C-IrO2 (η10 = 300 mV) (Fig. 3c). Moreover, the improved activity of RuO2-C-1 is highly reproducible (η10 = 140 ± 5 mV) (Supplementary Fig. 31).

a The OER polarization curves with iR-correction of RuO2-C-1, RuO2, C-RuO2 and C-IrO2 in a O2-saturated 0.5 M H2SO4 electrolyte with a scan rate of 5 mV s−1 and a catalyst loading of 283 μg cm−2 at room temperature. The corresponding non-iR-corrected polarization curves are provided in Supplementary Fig. 30. b Corresponding Tafel plots derived from (a). c Comparisons of the overpotentials at 10 mA cm−2, Tafel slopes and current densities at 1.45 V vs. RHE of RuO2-C-1, RuO2, C-RuO2 and C-IrO2. d Mass activities of RuO2-C-1, RuO2, C-RuO2 and C-IrO2. e ECSA-normalized LSVs and TOFs of RuO2-C-1, RuO2, C-RuO2 and C-IrO2. f Chronopotentiometry measurements of RuO2-C-1, RuO2, C-RuO2 and C-IrO2 at the same current density of 10 mA cm-2 in 0.5 M H2SO4. g Chronopotentiometry measurements of RuO2-C-1, RuO2, C-RuO2 and C-IrO2 at the same current density of 100 mA cm-2 in 0.5 M H2SO4. h Summary of the key OER advantages of RuO2-C-1, RuO2, C-RuO2 and C-IrO2, including the ECSA and jECSA at 1.40 V vs. RHE, TOFs at 1.40 V vs. RHE, mass load and stability at 100 mA cm−2. i Schematic diagram of the PEMWE. j polarization curve of a PEMWE using RuO2-C-1 as an anode catalyst without iR-correction. Preheated Milli-Q water at 80 °C was fed into the anode. k Chronoamperometry curve of RuO2-C-1-based PEMWE operated at 1.43 V under the same water-feeding conditions.
Next, the Tafel slope analysis was used to assess the OER kinetics. As shown in Fig. 3b, c, RuO2-C-1 has the lowest slope of 36.4 mV dec−1, which is distinctly smaller than those of RuO2 (80.8 mV dec−1), C-RuO2 (100.4 mV dec−1) and C-IrO2 (126.6 mV dec−1), indicating markedly faster interfacial charge transfer and more favorable OER kinetics for RuO2-C-1. We also summarize the different current densities of the catalysts at 1.45 V vs. RHE. Compared with the control samples, RuO2-C-1 exhibited the highest current density of 176.1 mA cm−2 (Fig. 3c). RuO2-C-1 was further evaluated in 0.05 M H2SO4 using a H2 reference electrode. As shown in (Supplementary Fig. 32), the catalyst delivered a highly reproducible overpotential of 148 ± 1 mV at 10 mA cm−2 (three independent measurements), confirming that the low activity is intrinsic and not an artifact of electrolyte concentration or reference-electrode conversion. Moreover, RuO2-C-1 delivers an overpotential of 140 mV at 10 mA cm−2 with a Ru loading of only 25.8 μgRu cm−2, showing competitive acidic OER performance among reported Ru/Ir-based catalysts (Supplementary Table 4).
To better elucidate the origin of the high OER performance of RuO2-C-1, we first calculated the mass activity of various catalysts on the basis of the Ru metal loading for. In particular, at 1.45 V vs. RHE, the mass activity of the RuO2-C-1 reaches 6814.1 A gRu−1, which is 124.1, 524.2, and 920.8 times greater than that of RuO2 (54.9 A gRu−1), C-RuO2 (13.0 A gRu−1), and C-IrO2 (7.4 A gRu−1), respectively (Fig. 3d). We then quantified the electrochemically active surface area (ECSA) from the double-layer capacitance (Cdl). RuO2-C-1 has the largest Cdl and ECSA among all the samples (vs. RuO2, C-RuO2, and C-IrO2; Supplementary Fig. 33 and Supplementary Table 5), indicating a greater density of exposed active sites that underpins its superior OER activity. As depicted in Fig. 3e, considering the ECSA-normalized OER activity, RuO2-C-1 delivers the highest specific activity, followed by RuO2, C-RuO2, and C-IrO2. The ECSA-based TOF consistently mirrors this order (Fig. 3e), suggesting intrinsically improved OER activity on the RuO2-C-1 catalyst because of the incorporation of carbon. In addition, we further measured the Faradaic efficiency (FE) of the acidic OER using the rotating ring disc electrode (RRDE). As shown in Supplementary Fig. 34, the RuO2-C-1 reaches an FE of ~99.8%, verifying its efficient OER performance14.
As depicted in Supplementary Fig. 29, the overpotential first decreases and then increases as the carbon content is decreased, whereas the carbon matrix alone shows negligible OER activity. In addition, the pure CDs precursor at the same catalyst loading likewise exhibits no discernible OER activity in acidic electrolyte (Supplementary Fig. 35). To benchmark against a conventional carbon support, we also prepared a reference catalyst using Kochen Black under a similarly preparation protocol and Ru loading (RuO2-KB). RuO2-KB catalyst shows lower OER activity and delivers consistently lower ECSA-normalized specific activity and TOF than RuO2-C-1 (Supplementary Figs. 36–38), supporting that the performance enhancement is closely linked to the CDs-enabled interfacial coupling and tensile-strain effects. This trend indicates that RuO2 centers are the true active sites and that strong interfacial coupling with the carbon matrix synergistically further enhances the intrinsic activity of the Ru sites, enabling better catalytic performance even at low Ru metal loadings.
To assess acidic durability, we performed systematic chronopotentiometry (CP) tests (Fig. 3f, g). Under identical conditions, C-RuO2 and C-IrO2 exhibited rapid performance loss, particularly at higher current densities. C-RuO2 showed the poorest tolerance, sustaining 10 mA cm−2 for only 23 h and displaying a sharp voltage rise within 2 h at 100 mA cm−2. C-IrO2 maintained a comparatively stable CP trace for 46 h at 10 mA cm−2, but similarly degraded after ~4 h at 100 mA cm−2 despite IrO2 being prone to acid resistance. The homemade RuO2 sustained a stable CP trace for 718 h at 10 mA cm−2, and for ~185 h at 100 mA cm−2. In contrast, RuO2-C-1 exhibited markedly enhanced durability, sustaining stable operation for over 1900 h at 10 mA cm−2 and ~1000 h at 100 mA cm−2. Figure 3h summarizes the key OER metrics for all the catalysts, highlighting the superior intrinsic activity, low Ru loading, and good acid durability of RuO2-C-1. We also compared the stability of RuO2-C-1 with that of state‒of‒the‒art OER catalysts and confirmed the competitive performance of RuO2-C-1 (Supplementary Table 4).
We further carried out post-stability characterization to examine the morphology and structural evolution of RuO2-C-1 after long-term operation at 10 mA cm−2. As shown in Supplementary Fig. 39a, the Bragg diffraction peaks of rutile RuO2 become more pronounced, which can be attributed to partial loss of the carbon support during durability testing. Nevertheless, SEM (Supplementary Fig. 39b) and TEM (Supplementary Fig. 39c) images reveal that the characteristic two-dimensional nanosheet morphology of RuO2-C-1 is largely preserved after prolonged operation under harsh acidic conditions. The HRTEM image (Supplementary Fig. 39d) further confirmed that the crystalline structure of RuO2-C-1 underwent a negligible change, and statistical analysis of the RuO2 (110) of RuO2-C-1 lattice space shows that the interplanar spacing remains essentially unchanged after stability testing (Supplementary Fig. 40). Furthermore, STEM-EDX elemental mapping (Supplementary Fig. 39e) confirmed that Ru, O, and C remained uniformly distributed across the nanosheets after durability testing. TEM-EDX analysis (Supplementary Fig. 39f) revealed a slight decrease in the carbon content of RuO2-C-1, indicating the partial dissolution of the carbon scaffold into the acidic electrolyte during long-term operation. To further evaluate possible changes in the CDs-derived carbon during acidic OER. We performed post-stability C K-edge NEXAFS. The post-stability C K-edge NEXAFS shows that RuO2-C-1 retains the main carbon resonances (π*(C = C), π*(C = O), and σ*(C–C)) with only minor lineshape changes, indicating that the CDs-derived carbon framework is largely preserved after acidic OER (Supplementary Fig. 41). While XPS analysis further verified that the oxidation states and surface electronic configuration remained unchanged (Supplementary Fig. 42).
Furthermore, to quantitatively assess possible carbon corrosion of RuO2-C-1 under acidic OER conditions, we conducted in-situ differential electrochemical mass spectrometry (DEMS) and total organic carbon (TOC) analyses experiments. In-situ DEMS was performed to assess possible gaseous carbon corrosion of RuO2-C-1 at 1.55 V vs. RHE in 0.5 M H2SO4. As shown in Supplementary Fig. 43), a pronounced O2 signal (m/z = 32) was detected while CO2 (m/z = 44) remained negligible, indicating minimal gaseous carbon-corrosion products under high anodic potential. Separately, TOC analysis was conducted on electrolytes collected from chronoamperometric stability tests at 1.55 V vs. RHE, revealing only a small amount of dissolved carbon corresponding to a cumulative carbon loss of ~1.04% (5 h) and ~1.61–1.65% (10–50 h) relative to the total carbon in the catalyst, with the dissolved-carbon fraction approaching a plateau after ~10 h (Supplementary Fig. 44). Together, these results suggest that carbon loss is limited and mainly occurs at the early stage, after which the carbon scaffold remains sufficiently stable to support durable operation. Although carbon is thermodynamically unstable under acidic OER potentials22,23,25, the improved durability of RuO2-C-1 is not attributed to “intrinsically oxidation-proof” CDs. Instead, it is proposed to arise from the CDs-derived assembled carbon framework and the strongly coupled RuO2-carbon interface: the condensed carbon framework can reduce highly exposed reactive sites, while interface coupling redistributes interfacial charge to suppress Ru overoxidation/dissolution and mitigate locally aggressive oxidative conditions32,54,55.
PEMWE performance
The ultimate benchmark for an acidic OER catalyst is its performance in a practical proton exchange membrane water electrolyzer (PEMWE). Motivated by the excellent three-electrode OER activity of RuO2-C-1, we assembled a PEMWE device for operation with Milli-Q water at 80 °C (Fig. 3i and Supplementary Fig. 45). The cell employed a Nafion 212 membrane, with RuO2-C-1 as the anode catalyst and commercial Pt/C as the cathode catalyst, giving a total platinum group metal (PGM) loading as low as 0.35 mg cm−2 (Supplementary Table 6). Specifically, the current‒voltage (I‒V) polarization curve shows that the RuO2-C-1-based PEMWE delivers current densities of 1 and 3 A cm−2 at cell voltages of 1.543 and 1.833 V, respectively, showing competitive performance among recently reported acidic oxygen evolution electrocatalysts (Fig. 3j and Supplementary Table 6). More impressively, the RuO2-C-1-based PEMWE operates stably at 1.43 V (about 0.35 A cm−2) for over 800 h (Fig. 3k), the postoperative morphology, structural, and Ru valance analyses further confirmed that the morphology, crystal structure, composition and surface electronic properties of RuO2-C-1 are well preserved (Supplementary Figs. 46 and 47).
Moreover, RuO2-C-1-based PEMWE also sustains stable operation at 1.55 V (about 1.0 A cm−2) for over 690 h (Supplementary Fig. 48), underscoring its robust durability under practically relevant conditions and highlighting its promise for deployment. The corresponding Ru dissolution during operation was quantified by ICP-AES (Supplementary Fig. 49). The cumulative Ru loss increased mainly during the initial stage (within the first 50 h) and then entered a slow-growth regime during prolonged operation. Consistently, the Ru dissolution rate decreased rapidly after the initial stage and remained at a low but finite level. Notably, as shown in Fig. 3j, the PEMWE performance of RuO2-C-1 reaches the US DOE 2025 target (3.0 A cm−2 at 1.9 V with a total PGM loading of 0.5 mg cm−2)56 and closely approaches the more stringent US DOE 2026 target (3.0 A cm−2 at 1.8 V; PGM loading of 0.5 mg cm−2)6. The RuO2-C-1-based PEMWE device exhibits exceptional structural robustness and catalytic activity, effectively overcoming the inherent durability and activity limitations of pure RuO2 in PEMWE. This achievement underscores the promising prospects of RuO2-C-1 for industrial-scale, sustainable hydrogen generation.
Mechanistic and theoretical understanding of the activity and stability of RuO2-C-1
The catalyst interfacial charge distribution plays a pivotal role in governing OER performance4,34. To further probe the charge transfer behavior at the carbon/RuO2 interface in RuO2-C-1, we employed the transient photoinduced voltage (TPV) measurements (Supplementary Fig. 50). The time-resolved TPV profiles upon laser excitation are shown in Supplementary Fig. 51. The raw TPV signals for RuO2-C-1 and RuO2 are presented in Supplementary Fig. 51a, c, respectively. Exponential fitting of the TPV decay curves (Supplementary Fig. 51b, d) reveals distinct charge-relaxation behaviors. RuO2-C-1 exhibited a two-step decay process. The first decay component (τ1 = 2.58 × 10⁻⁴ s) is comparable to that of pristine RuO2 (τ = 2.03 × 10⁻⁴ s), indicating that the fast relaxation pathway is dominated by the intrinsic charge-transport characteristics of RuO2. In contrast, the second decay component of RuO2-C-1 (τ2 = 1.10 × 10⁻² s) is significantly slower, suggesting a redistribution of interfacial charges and delayed recombination. The prolonged τ2 demonstrates that strong interactions between carbon and RuO2 facilitate charge storage and retard charge decay at the interface42. Although TPV probes photo-induced charge dynamics, the prolonged decay component observed for RuO2-C-1 reflects a slower interfacial charge relaxation process, which is interpreted as enhanced interfacial charge buffering/delocalization enabled by the strongly coupled RuO2-carbon interface. Under anodic polarization during OER, such interfacial charge buffering can facilitate more stable electron withdrawal from Ru centers and suppress uncontrolled charge accumulation that promotes Ru overoxidation/dissolution, thereby stabilizing the RuO2 lattice and contributing to the markedly enhanced OER durability of RuO2-C-14.
In-situ Ru K-edge XAS was employed to monitor the evolution of the oxidation state of Ru under operating OER conditions, aiming to further elucidate the mechanistic origin of the enhanced stability of RuO2-C-1. The Ru K-edge XANES spectra exhibit a gradual positive shift in the absorption edge energy as the applied potential increases from the open-circuit potential (OCP) to 1.40 V vs. RHE, indicating a progressive increase in the Ru oxidation state (Fig. 4a). This evolution reflects potential-driven electron withdrawal from Ru sites toward adjacent atoms or adsorbed oxygen-containing intermediates57. When the potential is further increased to 1.50 V vs. RHE—which is widely regarded as the upper stability limit for RuO2-based catalysts in acidic media58—the rate of the absorption edge shift with potential (dE0/dV) decreases markedly (inset of Fig. 4a and Supplementary Fig. 52). This behavior suggests that the Ru oxidation state tends to level off (within experimental uncertainty) at high anodic potentials35, which is consistent with the TPV results. The in-situ Ru K-edge EXAFS fitting was performed to further examine the potential-dependent Ru coordination environment (Supplementary Fig. 53 and Supplementary Table 7). The Ru-O coordination number remains nearly unchanged from OCP to 1.5 V vs. RHE, indicating that the primary Ru-O coordination structure is largely preserved under acidic OER conditions. This stabilization of Ru species under high anodic potentials is expected to inhibit overoxidation and suppress Ru dissolution, thereby contributing to the excellent catalytic durability57,59.

a Normalized in-situ Ru K-edge XANES spectra of RuO2-C-1 from the OCP to 1.5 V vs. RHE for the acidic OER. Inset in (a): enlarged view of the Ru K-edge absorption-edge region. In-situ Raman spectra of RuO2-C-1 (b) and RuO2 (c) for the acidic OER under different applied potentials. In-situ ATR-SEIRAS spectra of RuO2-C-1 (d) and RuO2 (e) for the acidic OER under different applied potentials. f Schematic illustration of the in-situ DEMS. g in-situ DEMS signals of 32O2, 34O2 and 36O2 evolved from RuO2-C-1 catalyst in H218O aqueous H2SO4 (H218O/0.5 M H2SO4) electroyte during three consecutive LSV cycles. h in-situ DEMS signals of 32O2, 34O2 and 36O2 evolved from the 18O-labeled RuO2-C-1 catalyst in H216O aqueous H2SO4 (H216O/0.5 M H2SO4) electrolyte during three consecutive LSV cycles. Side views of the exposed (110) surface of the RuO2-C-1 catalyst with 2.5% tensile strain (i) and the pure rutile RuO2 catalyst without strain (j) (blue, Ru atoms; red, O atoms; brownish-yellow, C atoms). k Schematic illustration of the OER pathway on the RuO2-C-1 (110) surface (blue, Ru atoms; red, O atoms; white, H). The Gibbs free energy diagrams for the preferred four-electron OER pathway on the Ru sites of pristine RuO2 (110) (l) and 2.5% tensile‒strained RuO2-C-1 (110) surfaces (m) at U = 0 V and 1.23 V vs. RHE.
We further carried out in-situ Raman spectroscopy to probe the structural stability of the RuO2-C-1 and RuO2 catalysts during continuous potential changes from the open-circuit potential to 1.5 V vs. RHE (Fig. 4b, c and Supplementary Fig. 54). The in-situ Raman spectra reveal the nanocrystalline characteristics of both RuO2-C-1 and RuO2, showing two prominent vibrational peaks at approximately 436 and 596 cm-1, which are assigned to Ru4+–O and Ru3+–O bonding, respectively17; the relatively broadened features are consistent with a nanocrystalline/strain-disordered RuO2 lattice19,60. The Raman-derived atomic ratio of Ru3+/Ru4+ is highly correlated with the structural integrity of Ru-based catalysts, since excessive formation or leaching of high-valence Ru species often triggers lattice destabilization and performance decay. As shown in Supplementary Fig. 55, RuO2-C-1 has a markedly higher (IRu3+/IRu4+) intensity ratio than RuO2 does, indicating a Ru3+-rich surface environment. The presence of additional Ru3+ species weakens the Ru–O lattice bond strength and helps prevent overoxidation of lattice oxygen, thereby improving structural resilience in acidic OER operation61.
Moreover, as the potential increases from the OCP to 1.5 V vs RHE, the Raman signal of RuO2 gradually weakens and eventually disappears, a phenomenon that has also been reported previously20,21. Although the attenuation may be partially influenced by optical scattering from O2 bubble evolution, the Raman intensity of RuO2-C-1 remains almost unchanged. RuO2-C-1 also maintains an almost constant Raman peak position, providing strong evidence that its crystal structure remains highly stable under anodic potentials. Taken together, these findings indicate that the interfacial coupling between the carbon support and RuO2, along with the tensile strain it induces, effectively stabilizes the catalytically active Ru species. This stabilization markedly enhances both the acidic OER durability and the structural robustness of the RuO2-C-1 catalyst11,21,25.
To elucidate the nature of the oxygen-containing intermediates and gain a more comprehensive mechanistic understanding, we employed in-situ attenuated total reflectance surface-enhanced infrared absorption spectroscopy (ATR-SEIRAS). Owing to its high sensitivity to surface-bound species and ability to monitor potential-dependent intermediates, this technique enables direct probing of the binding characteristics of oxygenated species on the surfaces of the RuO2-C-1 and RuO2 catalysts62. The in-situ ATR-SEIRAS spectra of RuO2-C-1 at various applied potentials (Fig. 4d and Supplementary Fig. 56) display a pronounced absorption band at 1213 cm−1, corresponding to the O–O stretching vibration of surface-adsorbed *OOH species. The appearance and gradual growth of this band with increasing potential (1.4–1.8 V vs. RHE) indicate that the adsorbate evolution mechanism (AEM) governs O2 formation on RuO2-C-119. In contrast, for pure RuO2, the *OOH-related O–O stretching vibration emerges only at ~1.5 V and exhibits a blueshift to 1224 cm−1, signifying a weakened interaction between the *OOH intermediate and the RuO2 surface63 (Fig. 4e). The lower-frequency feature on RuO2-C-1 therefore reflects the stronger binding of *OOH relative to RuO2, suggesting a more favorable adsorption configuration induced by the carbon-mediated tensile strain. Moreover, broad absorption features in the 3150–3850 cm−1 range are assigned to O–H stretching of surface hydroxyl species, whose intensities increase monotonically with potential, reflecting the accumulation of proton-coupled oxygen intermediates during the OER64.
To further confirm that RuO2-C-1 follows an AEM pathway, we performed in-situ 18O isotope–assisted DEMS measurements (Fig. 4f and Supplementary Fig. 57). This technique enables direct discrimination between AEM and lattice oxygen-mediated (LOM) pathways by monitoring oxygen molecules with different isotopic compositions during the OER21,22,23,25,61. In a typical experiment, the catalyst was first labeled with 18O by operating in 0.5 M H2SO4 prepared with H218O, followed by thorough rinsing with H216O to remove physisorbed 18O species. The labeled catalyst was subsequently transferred into 0.5 M H2SO4 of H216O electrolyte for the OER, during which the evolved oxygen was monitored in real time via in-situ DEMS25.
Figure 4g displays the dominant mass signal of 36O2, accompanied by minor 34O2 and 32O2 signals, during three consecutive LSV scans of RuO2-C-1 in H218O-containing H2SO4 electrolyte. The trace 34O2 signal arises from background 18O contamination and instrumental residuals rather than from the participation of lattice oxygen21,25. The clear predominance of 36O2 demonstrates that the evolved O2 originates exclusively from the electrolyte-derived oxygen atoms, thereby excluding the LOM. When the 18O-labeled catalyst was subsequently tested in H216O electrolyte, only 32O2 was detected, and no 36O2 signal appeared (Fig. 4h), confirming the absence of lattice oxygen involvement in the OER22,23,25. Together with the in-situ ATR-SEIRAS results, these in-situ DEMS measurements unambiguously establish that O2 formation on RuO2-C-1 proceeds predominantly via the AEM pathway.
Density functional theory (DFT) calculations were carried out to elucidate the underlying mechanism of the improved OER activity and stability of RuO2-C-1. We note that the DFT model is idealized and does not fully capture surface reconstruction, electrolyte effects, or potential-dependent intermediates. Therefore, the calculations are used mainly to provide qualitative mechanistic insight. A carbon-supported rutile RuO2 (110) slab model with ~2.5% tensile strain was constructed (Fig. 4i and Supplementary Data 1), given the STEM and XAS characterization and the thermodynamic stability of the (110) surface12,17. For comparison, a reference RuO2 (110) slab without strain was also modeled (Fig. 4j). Firstly, we performed DFT-based XPS core-level binding energy shift simulations to directly probe the electronic structure modulation. The computed Ru 3d binding energy shift is 0.12 eV on the RuO2-C-1 interface model relative to pristine RuO2 (110) (Supplementary Fig. 58), in good agreement with the experimentally observed shift of 0.23 eV. This consistency confirms that coupling with the carbon substrate induces interfacial charge redistribution in RuO2, consistent with the experimentally observed electronic modulation.
The DFT calculations were then carried out to investigate the full reaction pathway with Gibbs free energy profiles of the key intermediates (*OH, *O and *OOH) at the Ru active sites of RuO2-C-1 (Fig. 4k) and unstrained RuO2 (Supplementary Fig. 59). As shown in Fig. 4l, m, the formation of the *OOH is the rate-determining step (RDS) of both. Notably, the free-energy barrier for this step on RuO2 is 1.98 eV at U = 0 V, corresponding to an overpotential of 0.75 V (at U = 1.23 V) (Fig. 4l and Supplementary Fig. 59). Instead, RuO2-C-1 has a lower the free-energy barrier of 1.91 eV, corresponding to an overpotential of 0.68 V, indicating the beneficial effects of tensile strain and interfacial coupling in facilitating *OOH formation (Fig. 4m). Additional DFT calculations on RuO2 (110) show that tensile strain reduces the rate-determining *OOH formation barrier from 0.753 eV at 0% to a minimum of 0.673–0.677 eV at 2–3%, before slightly increasing to 0.681 eV at 4% (Supplementary Fig. 60), indicating an optimal strain window of ~2–3%, consistent with the experimentally observed ~2.5% lattice expansion. The further transition state calculations (Supplementary Figs. 61–63) demonstrate that the application of a 2.5% tensile strain lowers the OER kinetic barrier by reducing the free-energy penalty for the rate-determining *OOH formation step, thereby further accelerating the reaction kinetics.
Charge‒density difference analysis was further conducted to probe the structural stability of RuO2-C-1. The carbon framework assembled from CDs provides effective anchoring sites for RuO2, and the computed charge‒density redistribution at the carbon‒RuO2 interface reveals substantial charge transfer between the two components, while pure RuO2 shows only intrinsic charge polarization within the oxide framework (Supplementary Fig. 64). This pronounced electronic reorganization confirms strong interfacial interactions, which contribute to stabilizing the RuO2 structure under OER conditions. These theoretical observations are fully consistent with the experimental results, further validating the role of carbon-induced interfacial coupling in enhancing catalyst stability. Collectively, these results indicate that tensile strain primarily lowers the OER kinetic barrier (notably for the rate-determining OOH formation step), while interfacial coupling mainly regulates interfacial charge distribution to suppress Ru overoxidation/dissolution, and together they synergistically enhance both the acidic OER activity and durability of RuO2-C-1.
In summary, we construct a two-dimensional carbon–RuO2 composite (RuO2-C-1) featuring strong interfacial coupling and ~2.5% tensile strain. These structural attributes stabilize catalytically active Ru centers, enhance intrinsic OER activity with substantially reduced Ru usage. RuO2-C-1 delivers a low overpotential of 140 mV at 10 mA cm−2 and operates for >1900 h in acid. In a PEMWE, it reaches 3 A cm−2 at 1.833 V and sustains >800 h at 0.35 A cm−2, approaching U.S. DOE 2026 target. In-situ spectroscopies, together with TPV and DFT, show that interfacial charge redistribution and strain stabilization suppress Ru overoxidation and lower the OER barrier. These insights establish interfacial strain engineering as a powerful approach for unlocking the intrinsic stability of RuO2 and advancing practical, scalable, low-Ru PEMWE.