Customized self-assembly
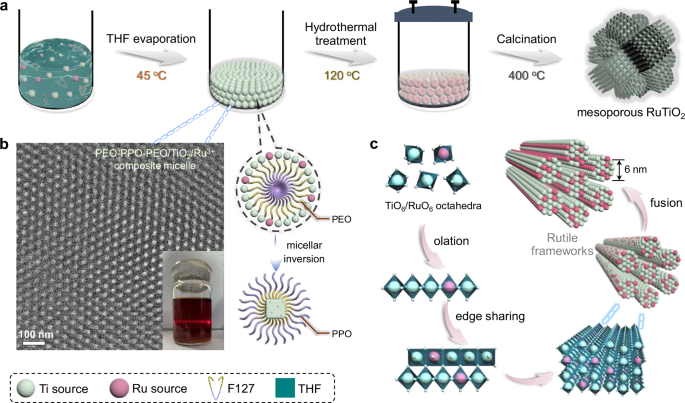
The uniform mesoporous Ru–Ti oxide solid solution nanospheres were synthesized through a customized micelle self-assembly strategy, which involves three main steps (Figs. 1a and S1a). First, a homogeneous acidic precursor solution was prepared using triblock copolymer F127 as a template, tetrabutyl titanate (TBOT) and RuCl3 as the metal sources, and acetic acid as a chelating agent to regulate hydrolysis kinetics. This step mitigates uncontrolled nucleation and phase separation between the highly reactive Ti and Ru precursors, enabling a uniform metal-ligand coordination environment43,44. Upon controlled tetrahydrofuran (THF) evaporation at 45 °C, discrete micellar hydrogels composed of block copolymer F127 and metal–oxo oligomers were formed as pre-assembled building blocks (~9.1 nm, Figs. 1b and S2a). This pre-micellization step, prior to cross-linking, allows control over spatial organization and ensures isotropic radial assembly. Notably, the low-humidity, acetic acid-assisted environment is essential for stabilizing Ti-Ru co-complexation, representing a key feature in directing cooperative metal precursor organization.

a Schematic illustration for the formation process of branched mesoporous RuxTiyO2 solid solution nanospheres. b High-magnification TEM image, optical image, and correlated structural model of the PEO-PPO-PEO/TBOT/RuCl3 composite micelle primitives. c Scheme showing the compatible nucleation and edge-sharing growth of TiO6 and RuO6 octahedra into pure rutile mesopore walls. Source data are provided as a Source Data file.
Subsequently, a hydrothermal treatment in an autoclave induces in situ polycondensation and crystallization of the metal-oxo species, giving rise to radially mesostructured frameworks. The presence of HCl facilitates the protonation of both TiO6 and RuO6 octahedra, guiding their edge-sharing polycondensation under slightly reducing, oxygen-deficient conditions, thus favoring the formation of rutile-type frameworks45. The gradual crystallization feature from mini-crystallites during hydrothermal treatment also validates this phenomenon (Fig. S3). Importantly, the structural coherence between RuO2 and TiO2, owing to their closely matched lattice parameters (Tab. S1), enables uniform substitutional doping at the atomic level rather than forming phase-separated Ru clusters, as corroborated by the comparable micelle intermediates in Ru–Ti and Ti–only systems (Fig. S2d). Note that the hydrothermal treatment primarily achieves the solidification of radial mesostructure and initiates Ru–O–Ti coordination. The complete incorporation of Ru into TiO2 lattice predominantly occurred during calcination, which simultaneously removes the template and promotes crystalline ordering (Fig. 1c), as evidenced by the phase evolution and thermogravimetric analysis results (Fig. S4). This stepwise, integrated synthesis route provides an approach for constructing hierarchically ordered, multicomponent mesoporous oxides with tailored interfaces for electrocatalytic applications.
Synthesis and characterizations
The large-scale field-emission scanning electron microscopy (FESEM) image reveals a uniform branched nanosphere morphology with an average particle size of ~250 nm for the synthesized mesoporous Ru–Ti oxide solid solution (Fig. S5). Each nanosphere features multiple cylindrical mesoporous nano-bundles oriented from the core, forming a flower-like architecture (Fig. 2a, b). Transmission electron microscopy (TEM) image further evidences opened mesochannels with radial alignment, which facilitate mass and gas diffusion (Fig. 2c). Statistical analysis shows that each nanosphere typically contains 10–12 radial branches according to close inspections from different angles (Fig. 2d, e). High-resolution TEM (HRTEM) images disclose parallel lattice fringes with an interplanar spacing of 0.324 nm, corresponding to the (110) plane of rutile, which is identical to that of mesoporous TiO2 spheres synthesized through the same recipe (Figs. 2f and S6). The elongated diffraction spots with hexagonal symmetry observed in the selected area electron diffraction (SAED) pattern confirm the single-crystal-like characteristic of the mesopore walls and the absence of RuO2 derived from phase segregation (Fig. 2g). Note that the crystallographic orientation is partially at the branches while the entire nanospheres are still polymorphs (Fig. S7). Nitrogen sorption isotherms display the characteristic type IV curve at P/P0 = 0.5–0.9, indicative of the uniform mesoporous structure, as also evidenced by the pore size distribution centered at 9.0 nm (Fig. 2h, i). The broad peak at around 40 to 60 nm is ascribed to the interstices between branches and nanospheres. As a reference, the pure mesoporous TiO2 nanospheres with similar radial orientation were prepared (Fig. S8). The Brunauer–Emmett–Teller (BET) surface area and pore volume of the mesoporous solid solution are calculated to be 89 m2 g−1 and 0.44 cm3 g−1, comparable to that of the rutile mesoporous TiO2 (Table S2).

a, b SEM images with different magnifications, c Dark-field STEM image of the branched meso-RuTiO2 nanospheres prepared by customized assembly. d Structural model, e High-magnification SEM images of the meso-RuTiO2 nanospheres. f HRTEM image, and g SAED pattern of the meso-RuTiO2 nanospheres. h Nitrogen sorption isotherms, i pore size distribution, j, k aberration-corrected HAADF-STEM images and structural model, l EELS spectrum of the meso-RuTiO2 nanospheres. m Ru and Ti content obtained from XPS spectra under different Ar etching time. Source data are provided as a Source Data file.
To provide atomic-scale insight into the structure, aberration-corrected high-angle annular dark-field scanning transmission electron microscopy (HAADF-STEM) measurements were carried out. The presence of isolated bright atomic columns corresponding to Ru atoms embedded within the TiO2 lattice without detectable nanocrystals verifies the formation of a homogeneous solid solution phase (Fig. 2j, k). Elemental mapping further validates the uniform distribution of Ru atoms across mesoporous nano-bundles (Fig. S9). Under high-energy electron beam irradiation, an in situ aggregation phenomenon of Ru cluster in frameworks occurred (Supplementary Video 1), further supporting the metastable Ru incorporation in the TiO2 lattice. The electron energy loss spectroscopy (EELS) analysis identifies the characteristic Ti L2,3-edge, Ru M2,3-edge, and O K-edge, verifying the coexistence of Ru and Ti elements (Fig. 2l). The Ar+-sputtering X-ray photoelectron spectroscopy (XPS) profile further reveals the stoichiometric constitution of Ru0.2Ti0.8O2. The decreasing Ru signal with sputtering depth suggests a surface-enriched Ru distribution, which may contribute to enhanced catalytic activity due to more accessible active sites (Fig. 2m). The energy-dispersive X-ray (EDX) analysis reveals Ru and Ti contents of 20.7 wt% and 42.2 wt% (Fig. S10a), corresponding to a Ru/Ti molar ratio of ~0.23 (Ti/Ru ≈ 4.3), which is consistent with the nominal composition of Ru0.2Ti0.8O2 and previous reports.
Gas-liquid-solid triple-phase interface
To gain mechanistic insights into the solid-phase characteristics, we conducted a control experiment with varied Ru contents at 10 wt% and 5 wt% for comparative analysis (Fig. S10). As shown in the powder X-ray diffraction (PXRD) patterns, the meso-TiO2 exhibits characteristic reflections corresponding to a pure rutile TiO2 phase (I41/amd), while the positive shift to the RuO2 phase with the increase of Ru content implies the formation of a homogeneous solid-solution phase with no phase segregation occurrence (Fig. S11). The Rietveld refinement reveals the lattice parameters of meso-Ru0.2Ti0.8O2 (a = b = 4.58 Å, c = 2.97 Å, and V = 62.54 Å3), and the correlated crystal structure was constructed for calculations (Fig. S11c). In Raman spectra (Fig. S12), the meso-TiO2 exhibits typical bands at 236, 443, and 608 cm−1, corresponding to low-frequency Ti-O-Ti bending (t2g-O 2p π interactions), Eg bending (t2g-O 2p π overlap), and A1g symmetric Ti-O stretching (eg-O 2p σ anti-bonding states) of rutile phase46. These modes progressively weaken in the Ru–Ti solid solutions, reflecting the distortion of Ti-O-Ti linkages and altered orbital overlap caused by the Ru–O–Ti bond. The Ru incorporation with a modified local octahedral field around Ti4+ redistributes the t2g and eg orbital energies and weakens the Ti-O vibrations, demonstrating the impact of Ru doping on both structural order and electronic configuration of the TiO2 lattice. To further validate this phenomenon, XPS analyses were conducted. The full spectra exclude the presence of other compounds (Fig. S13a). In the high-resolution Ti 2p region, peaks at 464.0 and 458.3 eV correspond to Ti4+ in pristine meso-TiO2. Upon Ru incorporation, a negative shift is observed, suggesting partial reduction of Ti4+ to Ti3+ due to lattice distortion and charge compensation (Fig. S13b). Electron paramagnetic resonance (EPR) spectra reveal an increased g-value of 1.97 (Fig. S13c), consistent with the formation of Ti³⁺ species and associated oxygen vacancy defects. In the Ru 3d region, deconvoluted peaks at 281.1 eV (Ru 3d5/2) and 285.3 eV (Ru 3d3/2) are assigned to the Ru4+ state (Fig. S13d), confirming the oxidation state of Ru in lattice13. Progressive positive shifts of Ru 3d and O 1s peaks as the Ru content increases suggest a modified local electronic environment and enhanced electron-withdrawing capability of the solid-solution lattice39. The increased intensity at 531.5 eV further implies the generated oxygen vacancies in solid solution (Fig. S13e).
X-ray absorption near-edge structure (XANES) spectra at the Ru K-edge display the negative shift of the absorption edge of meso-Ru0.2Ti0.8O2 compared to RuO2, indicating a nominal Ru valence lower than +4 (Fig. 3a). Quantitative analysis based on the scaling relation between absorption energy and oxidation state confirms the Ru valence at +3.90 in meso-Ru0.2Ti0.8O2 (Fig. S14a), mainly attributed to strong Ru–O–Ti interaction for stabilized Ru sites within the solid solution. The Fourier transform extended X-ray absorption fine structure (FT-EXAFS) spectrum of Ru reveals distinct Ru–O and Ru–Ti coordination peaks at 1.90 and 3.69 Å, further indicating a shorter Ru–O bond length compared to 1.94 Å in RuO2 (Inset of Fig. 3a and Table S3). This bond contraction, accompanied by a slightly elongated Ru–Ti (Ru-Ru) distance, suggests a lattice distortion in the Ru–Ti solid solution oxide compared to pristine RuO2. The shortened Ru–O bond may arise from a reduced Ru coordination number, which locally decreases the Ru valence state and increases its ionic radius, while simultaneously enhancing Ru–O covalency and bond strength. Such strengthened Ru–O interactions are expected to improve the structural robustness of active sites under acidic OER conditions, contributing to the high durability. The application of EXAFS wavelet transform (WT) analysis also provides evidence for the coordinated environment of Ru in solid solution (Figs. 3b and S13b). In the density of state (DOS) plot of meso-TiO2, a distinct gap between the valence and conduction band can be observed, demonstrating the semiconducting feature of TiO2 with a wide band gap (Fig. 3c). In contrast, the band gap disappears in the Ru–Ti oxide solid solution, suggesting the transformation into a metallic conductor with electronic states near the Fermi level. This observation is fully consistent with subsequent ultraviolet photoelectron spectroscopy (UPS) measurements (Fig. S15e), which provide detailed insight into the progressive modification of the material’s surface electronic structure upon Ru incorporation. To gain more insights into the electronic structure, the electron localization function (ELF) maps were performed, showing notably higher values around Ru–O bonds than Ti–O bonds (Figs. 3d and S15a,b). This enhanced electron localization in Ru–O regions suggests a stronger covalent Ru–O bond or electronic interaction due to the higher electronegativity of Ru with d orbitals, which could offer favorable sites for facilitated adsorption and activation of reactants. Besides, the low-ELF regions surrounding Ru are more extensive than those around Ti in pure TiO2, indicating a higher degree of electron delocalization in Ru-rich regions with enhanced electrical conductivity. UV–Vis absorption spectra and corresponding Tauc plots (Fig. S15c, d) indicate a progressive narrowing of the bandgap with increasing Ru content in the solid solutions, suggesting significant alterations in the electronic structure. This behavior further supports the transformation of the material from a wide-bandgap semiconductor to a conductive material. Analysis of the interfacial electronic structure of the catalyst via UPS (Fig. S15f) revealed that as the Ru doping concentration increased, the work function of the material continuously rose from 4.06 eV for pure TiO₂ to 4.83 eV (20% Ru doping). This change fundamentally reflects the significant modification of the surface electronic properties induced by Ru incorporation. The increase in work function indicates a downward shift of the Fermi level relative to the vacuum level, suggesting that Ru species act as electron acceptors, enhancing the material’s ability to capture and stabilize electrons. Since the material forms a RuxTiyO2 solid solution through substitution of Ti sites by Ru atoms, significant band bending is induced at the interface, and a built-in electric field directed from the TiO₂ matrix toward the Ru active centers is established. This reconstruction of the electronic structure provides an efficient electron transport pathway for catalytic reactions: on one hand, it improves interfacial charge separation efficiency, and on the other hand, it accelerates surface reaction kinetics.

a Ex situ Ru K-edge XANES spectra of the Ru foil, RuO2, and meso-Ru0.2Ti0.8O2. Inset: EXAFS fitting results and ball-and-stick model diagram. b WT-EXAFS curves of the meso-Ru0.2Ti0.8O2. c Total density of states (DOS) for the meso-Ru0.2Ti0.8O2 and meso-TiO2. d Electron localization function (ELF) maps of the meso-Ru0.2Ti0.8O2. e Gas bubble adhesive force of the meso-Ru0.2Ti0.8O2. f Corresponding bubble state images captured during the adhesive force tests. Source data are provided as a Source Data file.
We further carried out contact angle (CA) measurements to investigate the liquid-gas phase behavior during reactant transport. Notably, the water droplet rapidly spreads on the surface of meso-Ru0.2Ti0.8O2, showing an enhanced hydrophilic nature compared to the commercial RuO2 with a contact angle of 105° (Fig. S16 and Supplementary Video 2). This superhydrophilicity is attributed to the open, high-surface-area titania networks for mass diffusion. Additionally, gas bubble contact angle measurements exhibit a higher CA of 152° for the meso-Ru0.2Ti0.8O2 than commercial RuO2 (Fig. S17a and Supplementary Video 3), demonstrating the enhanced aero-phobicity. The combination of superhydrophilicity and aero-phobicity is expected to largely facilitate reactant diffusion and gas bubble detachment under high current densities in acidic OER. To further validate this hypothesis, we measured the adhesive force between oxygen bubbles and the catalyst surface. The meso-Ru0.2Ti0.8O2 exhibits an adhesive force of ~0 µN, enabling spontaneous and complete bubble detachment without morphological deformation, as also confirmed by the sequential images captured at different test stages (Fig. 3e, f and Supplementary Video 4). In contrast, the commercial RuO2 shows a significantly higher adhesive force of ~5 µN, which could hinder bubble release and potentially accelerate catalyst degradation due to mechanical disturbance (Fig. S17b). Overall, the integrated surface properties of meso-Ru0.2Ti0.8O2, characterized by high wettability and minimal bubble adhesion, significantly enhance interfacial mass transport, indicating its potential applicability for high-performance, industrial-scale PEM water electrolysis systems.
OER and PEMWE performances
The OER behavior of the mesoporous solid solution was first assessed in a standard three-electrode system using 0.5 H2SO4 electrolyte, with commercial RuO2 as the benchmark (Fig. S18). In linear sweep voltammetry (LSV) curves (Fig. 4a), the meso-Ru0.2Ti0.8O2 demands an overpotential (η) of only 257 mV to reach a current density of 10 mA cm−2, which is lower than commercial RuO2 (302 mV) and enhanced to many RuO2-based catalysts (Tab. S4). At a higher current density of 100 mA cm−2, the overpotential of meso-Ru0.2Ti0.8O2 remains at a moderate 319 mV, while commercial RuO2 fails to reach this current density within the same potential window, highlighting the enhanced activity attributed to high surface area. Tafel slope analysis (Fig. S19a) reveals a lower slope of 59 mV dec−1 for the meso-Ru0.2Ti0.8O2 compared to 92 mV dec−1 for the commercial RuO2, indicating the accelerated reaction kinetics and efficiency in the formation of oxygenated intermediates under acidic condition. Moreover, electrochemical impedance spectroscopy (EIS) measurements (Fig. 4b) show that the meso-Ru0.2Ti0.8O2 exhibits the lowest charge transfer resistance (~20 Ω) compared to lower-Ru-content sample (~38 Ω) and commercial RuO2 (~24 Ω), suggesting charge transport characteristics in the mesoporous structure (Fig. 4b). To determine the electrochemically active surface area (ECSA), double-layer capacitance (Cdl) tests were conducted (Fig. S19b). The Cdl of meso-Ru0.2Ti0.8O2 reaches 46.0 mF cm−2, significantly higher than that of lower-Ru-content samples, indicating an increase in ECSA upon Ru incorporation (Fig. S20). Besides, the mass activity, specific activity, and turnover frequency (TOF) values (Table S5) were further calculated at 1.53 V vs. RHE. The meso-Ru0.2Ti0.8O2 catalyst exhibits a mass activity of 921.6 A g−1Ru, a specific activity of 0.091 mA cm−2ECSA, and a TOF of 0.2412 s−1, significantly higher than those of other samples, suggesting possible relevance for practical application.

a LSV polarization curves of different catalysts RuO2, meso-TiO2, meso-Ru0.05Ti0.95O2, meso-Ru0.1Ti0.9O2, meso-Ru0.2Ti0.8O2. Conditions: 0.5 M H2SO4 (pH = 0), 5 mV s−1, 0.1 mgRu cm−2, 1600 rpm, 25 °C. b EIS Nyquist plots for different catalysts. c I–V curves of PEMWE cell using the meso-Ru0.2Ti0.8O2 at different mass loadings as anode catalyst at 60 °C. d Chronopotentiometry curve of PEMWE device using the meso-Ru0.2Ti0.8O2 as anode catalyst and Pt/C as cathode catalyst operated at 1 A cm−2 at 60 °C. Source data are provided as a Source Data file.
Motivated by the high activity of the meso-Ru0.2Ti0.8O2 catalyst, we further investigated the performance of meso-Ru0.2Ti0.8O2 in a practical PEMWE device. A full-cell configuration was assembled using meso-Ru0.2Ti0.8O2 as the anode catalyst, commercial Pt/C as the cathode catalyst, and Nafion 115 as the proton exchange membrane. The meso-Ru0.2Ti0.8O2 || Pt/C achieves a current density of 1.0 A cm−2 at a low cell voltage of only 1.65 V (Fig. 4c), lower than that measured for commercial RuO₂ under the same conditions. Even under an ultralow Ru loading of 0.02 mgRu cm−2, the electrolyzer maintains a current density of 1.0 A cm−2 at 1.72 V, compareable to the DOE 2025 target (1.0 mgRu cm−2, 1.72 V@1 A cm−2). Moreover, the meso-Ru0.2Ti0.8O2 can operate steadily at 1.0 A cm−2 for over 450 h with a minimal voltage decay rate of 21.1 μV h−1 (Fig. 4d). Post-reaction characterizations (Fig. S21) of the meso-Ru0.2Ti0.8O2 catalyst confirm the preservation of radial morphology without collapse or aggregation in characteristic rutile phase, further underscoring its verified structural stability during prolonged acidic electrolysis, which strongly verifies the desired Ti-Ru incorporation for suppressed Ru overoxidation. A comparative summary of state-of-the-art PEMWE devices indicates stable operation and performance of meso-Ru0.2Ti0.8O2 for scalable hydrogen production among RuO2-based OER anode catalysts (Fig. S22)17,24,47,48,49,50,51,52,53,54,55,56,57, which benefits from the synergistic contribution of its mesoporous structure and homogeneous solid-solution composition.
In situ measurements and theoretical insights
To elucidate the origin of the enhanced stability of the mesoporous solid solution, we adopted in-situ XANES spectroscopy to monitor the evolution of Ru electronic structure under OER operating conditions. As presented in Fig. 5a, Ru K-edge XANES spectra were recorded from the open circuit potential (OCP) to 1.23 V, and subsequently up to 1.83 V vs. RHE. With the increase of applied potential, the absorption edge progressively shifted to higher energies, indicating a continue oxidation of Ru species. Quantitative valence fitting reveals that the oxidation state of Ru in meso-Ru0.2Ti0.8O2 increases from +3.54 at OCP to +3.75 at 1.23 V, and further to +3.80 at 1.43 V vs. RHE. Remarkably, when the potential reaches 1.63 V vs. RHE, the Ru oxidation state stabilized at +3.80, and remains nearly unchanged even with further increase to 1.83 V, where it slightly increased to +3.90. Interestingly, the initial Ru valence at OCP is slightly lower than that of pristine RuO2, which may be attributed to partial electron transfer from the TiO2 lattice to Ru centers. This lattice-mediated electronic modulation effectively stabilizes the Ru sites in a more reduced and active state at open circuit conditions. As the applied potential increased to 1.63 V vs. RHE, the Ru valence approached +3.80 and remained nearly constant despite the onset of vigorous OER, indicating that the Ru electronic structure is effectively buffered against overoxidation. Besides, the Ru oxidation state first decreases and then increases as the applied potential increases, accompanied by a corresponding evolution in the local Ru–O coordination environment (Fig. S23 and Table S6). At low potential (~1.2 V), partial reduction of Ru leads to slightly elongated Ru–O bonds and a reduced effective coordination number, indicating a more relaxed local structure. Upon further increasing the potential, the Ru–O coordination number gradually increases toward octahedral coordination while the Ru–O bond lengths shorten, consistent with the formation of higher-valence Ru species and strengthened Ru–O bonding. This self-limiting oxidation behavior mitigates the formation of soluble high-valence Ru species responsible for catalytic degradation through dissolution. These results highlight that the electronic coupling between Ru and TiO2 host lattice plays a role in buffering Ru oxidation state to maintain a stable and catalytically favorable window, thereby ensuring long-term durability under high anodic potentials.

a In situ Ru K-edge XANES spectra, and corresponding Ru valence state analysis (inset) of the meso-Ru0.2Ti0.8O2 at different applied potentials from OCP to 1.83 V vs. RHE in 0.1 M HClO4 during OER process. b In situ DEMS signals of the generated 32O2, and 34O2 versus time during LSV tests in H218O electrolyte for the meso-Ru0.2Ti0.8O2. c In situ FT–IR curves at different applied potentials. d The free energy (ΔG) diagrams of reaction pathways suggested by AEM and OPM on the meso-Ru0.2Ti0.8O2. The corresponding intermediate state configurations for e OPM and f AEM on the meso-Ru0.2Ti0.8O2 (blue: Ru, pink: Ti, red: lattice O, yellow: adsorbed O, and grey: H). g Schematic illustration for the material design of high-efficiency mesoporous solid solution with gas-liquid-solid triple-phase interface. Source data are provided as a Source Data file.
To further probe the underlying reaction mechanism, we performed in-situ differential electrochemical mass spectrometry (DEMS) with isotope-labeled electrolyte water H218O as electrolyte (Fig. 5b). During OER operation, the evolved oxygen gas was analyzed to determine the contribution of lattice oxygen participation. The presence of 34O2, formed by the combination of 16O from the electrolyte and 18O from catalyst lattice, serve as a key indicator of the lattice oxygen mechanism (LOM). Quantitative analysis reveals that only a small fraction (8.1%) of the evolved oxygen is 34O2, while the majority (91.9%) is 32O2, which originates solely from the electrolyte. This result suggests that lattice oxygen participation is effectively suppressed on the meso-Ru0.2Ti0.8O2 catalyst, favoring a non-LOM pathway. Such pathways typically proceed via the adsorbate evolution mechanism (AEM) or oxide path mechanism (OPM), both of which are less prone to catalyst degradation and thus desirable for long-term operation in acidic media15. This aligns with the latest findings that stabilizing lattice oxygen is critical for long-term stability, as strain-engineered Pt-RuO231 and demonstrated in Co-RuO232 systems. To elucidate the surface reaction intermediates during OER, in situ attenuated total reflectance surface-enhanced infrared absorption spectra (ATR-SEIRAS) were conducted under varying applied potentials (Fig. 5c). A distinct vibrational band emerges at ~1060 cm−1 at potentials above 1.8 V vs. RHE, which is assigned to the O–O stretching mode in the *OOH intermediate, confirming the participation of the AEM pathway. In addition, a broader signal centered around ~1170 cm-1 appears at higher potentials, corresponding to the vibrational signature of coupled *O–O*, characteristic of the OPM pathway. The simultaneous presence of both vibrational features indicates that the meso-Ru0.2Ti0.8O2 catalyst engages dual-site reaction pathways involving both AEM and OPM, which contributes to its stable oxygen evolution behavior under harsh acidic conditions. This mechanistic duality also highlights the structural and electronic adaptability of mesoporous solid solution capable of efficient and stable OER via complementary reaction routes.
To elucidate the underlying OER mechanism, we conducted first-principles calculations to determine the preferred two possible AEM and OPM pathways (Fig. 5d). On the RuO2 (110) surface, there are two distinct catalytic sites: the fivefold coordinatively unsaturated site (CUS) and the sixfold-coordinated bridge site (BRI)58. In pristine RuO2, the Ru atoms at CUS sites are recognized as the dominant active centers for OER, where the *OOH intermediate formation constitutes the rate-determining step (RDS) in the AEM pathway. This supports the widely accepted AEM dominance on commercial RuO259. However, in meso-Ru0.2Ti0.8O2, the spatial isolation of Ru centers due to Ti substitution disrupts the formation of adjacent Ru-CUS pairs, effectively suppressing potential bimetallic Ru–Ru interactions that are often involved in AEM catalysis (Table S3). Our calculations reveal that the free energy barrier for *O to *OOH step in AEM is 2.091 eV for the meso-Ru0.2Ti0.8O2 (Fig. 5f), significantly higher than in pristine RuO2, indicating a thermodynamically disfavored AEM pathway due to Ti incorporation. In contrast, for the OPM pathway (Fig. 5e), where the RDS involves the coupling of surface-bound *O and *OH to form *O–O* intermediate, the calculated energy barrier is only 1.581 eV. Moreover, the overpotential (η) for AEM is estimated at 0.861 V, much higher than 0.361 V calculated for OPM, further confirming that the OPM pathway is thermodynamically favored in mesoporous solid solution (Supplementary Data 1). We note that the calculations employ idealized surface models under static conditions and therefore do not fully capture potential-dependent reconstruction, explicit solvent dynamics, and defect distributions; the computed energetics are intended to indicate qualitative mechanistic trends. These results are in high agreement with the in-situ spectroscopic results and isotope-labeling experiments, jointly demonstrating that Ti-induced lattice modulation in meso-Ru0.2Ti0.8O2 redirects the OER pathway from AEM to OPM, contributing to its enhanced activity and durability under acidic conditions.