
Rhona O’Connell, StoneX Financial Ltd
Any views expressed here are of the writer and do not reflect a house view either from StoneX Financial Ltd., nor from Nasdaq.
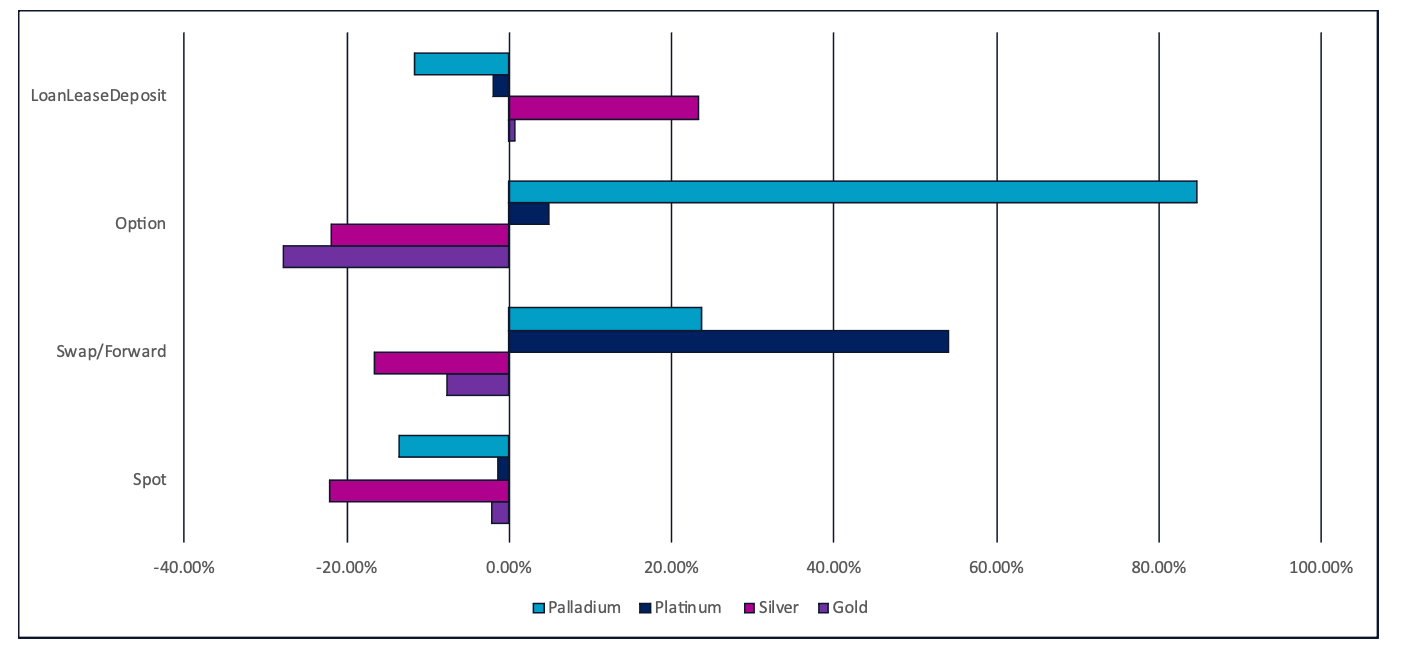
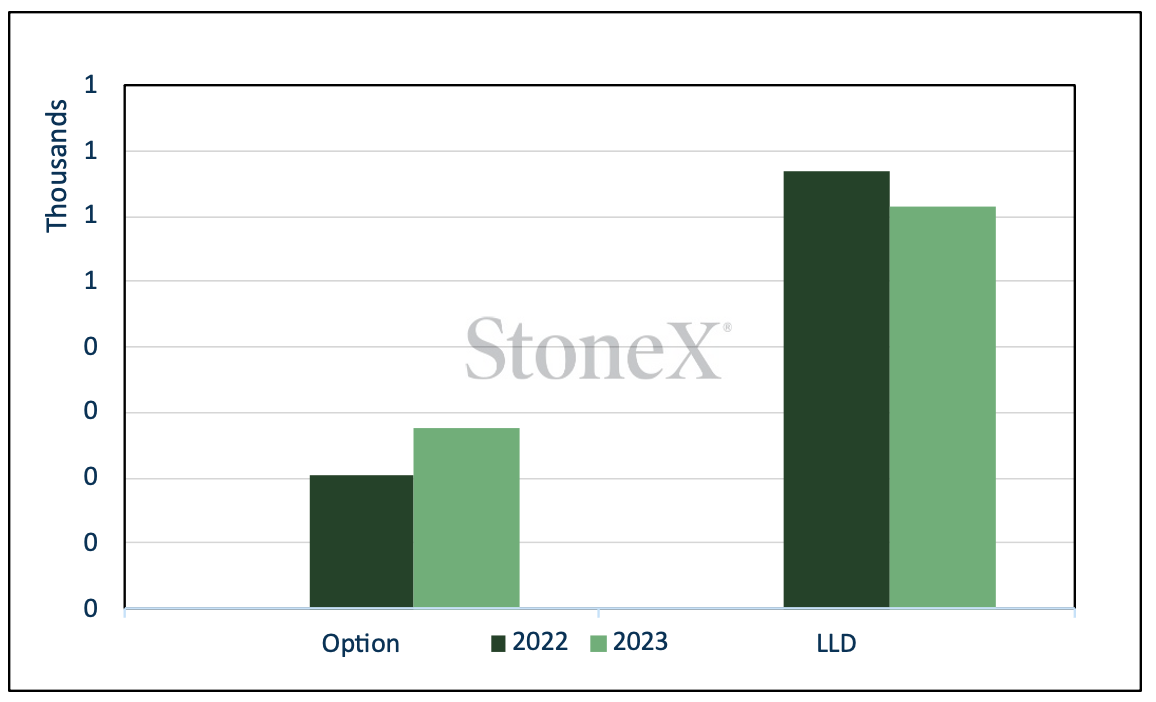
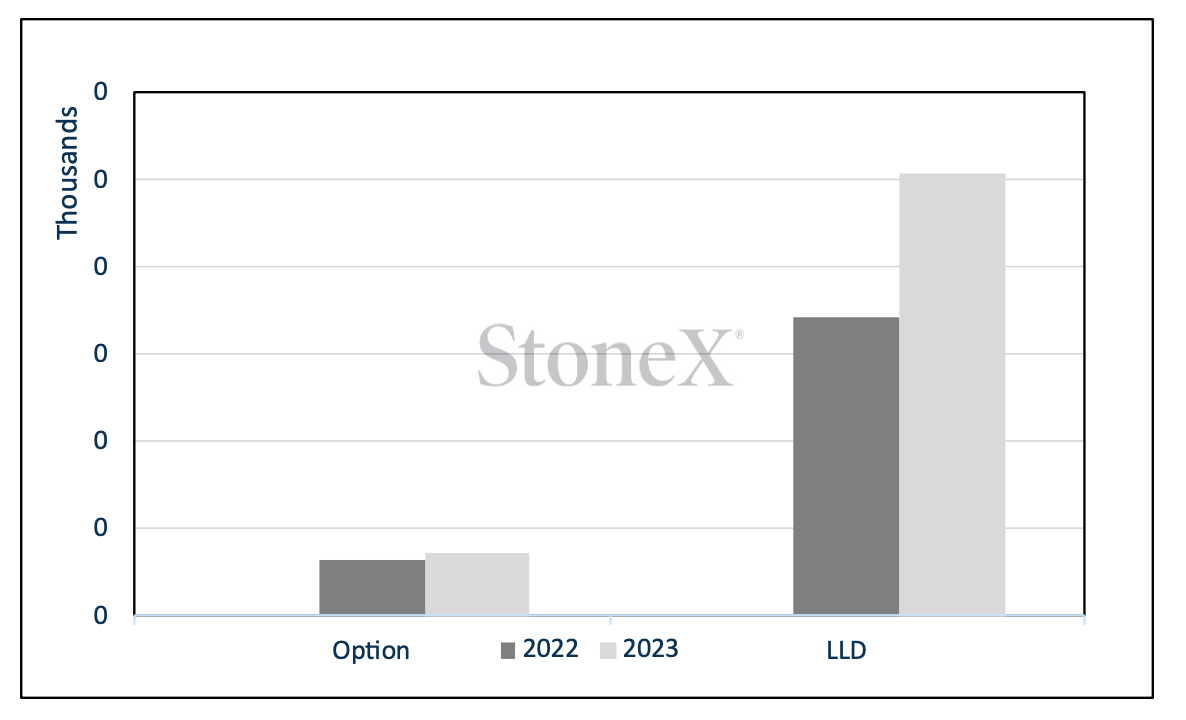
Daily December average compared with daily average for January-November 2023
Source: LBMA
Welcome to our monthly round-up of the LBMA OTC trading volumes in gold, silver, platinum and palladium, as recorded on a daily basis by the Association. These are split into spot, swap/forward, options and LoanLeaseDeposit (LLD) and give a flavour of the markets’ activity and how they were influenced by external forces and news items.
Given that this is the January 2024 issue, we are including a quick encapsulation 2023 vs 2022 so this particular document will be dominated by charts – after all, every picture tells a story.
General introduction: –
The above chart shows that spot volumes for all metals were marginally down against the first eleven months of the year; this is the normal pattern for December. The pick-up in options and swaps/forwards in platinum and palladium, though, suggest some industrial bargain-hunting interest as both those metals’ prices rallied during the month – and it is also highly likely that some beleaguered producers or mid-stream industry fabricators may have sold into the hard rally in palladium in mid-month (palladium swap/forward volumes were substantially higher in December than the average for the rest of the year). The forward activity in platinum is possibly also offset to a degree by short positions on NYMEX.
The only other increase in December was the LLD sector in gold and silver, which could well represent some producer hedging, certainly in the latter metal as silver had rallied strongly in November and traded above $25 in the first week of December; certainly the highest volumes of the month were concentrated at the beginning thereof.
Last year saw LBMA OTC volumes increase against 2022 in all elements except gold options (down 21%) and Platinum LLD (down 8%).
GOLD
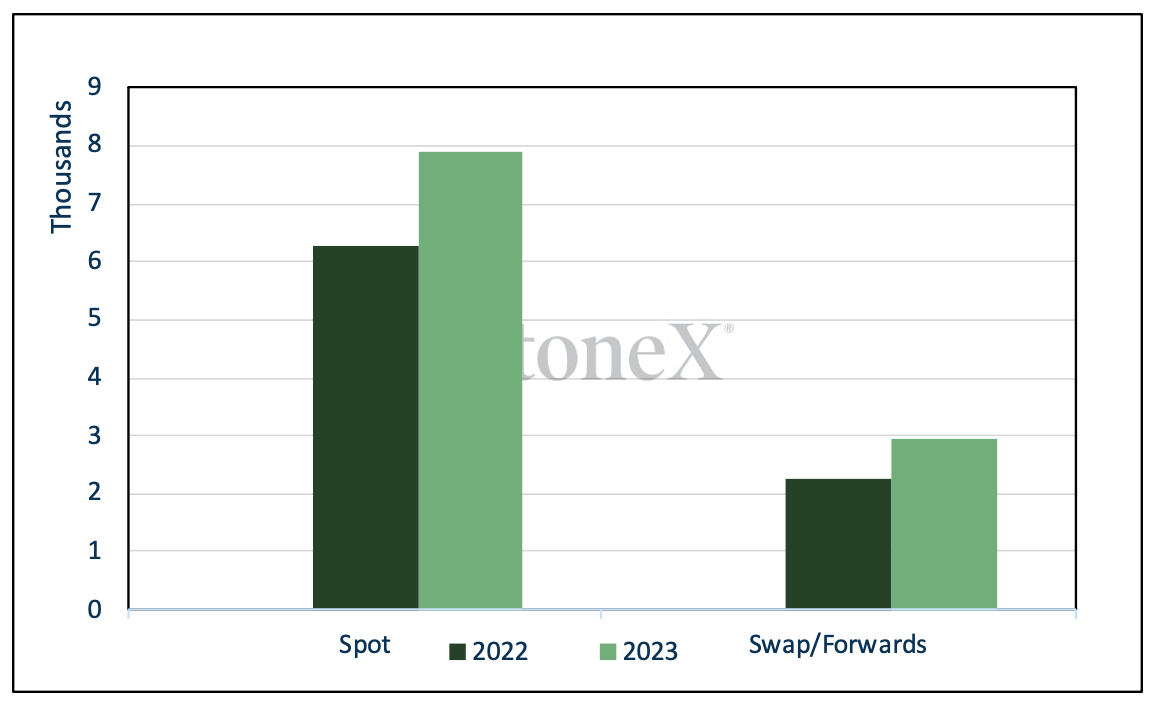
The year as a whole: – spot gold volumes were a multiple of 47 times global mine production. Total volume including all the OTC derivatives was 71 times Global mine production.
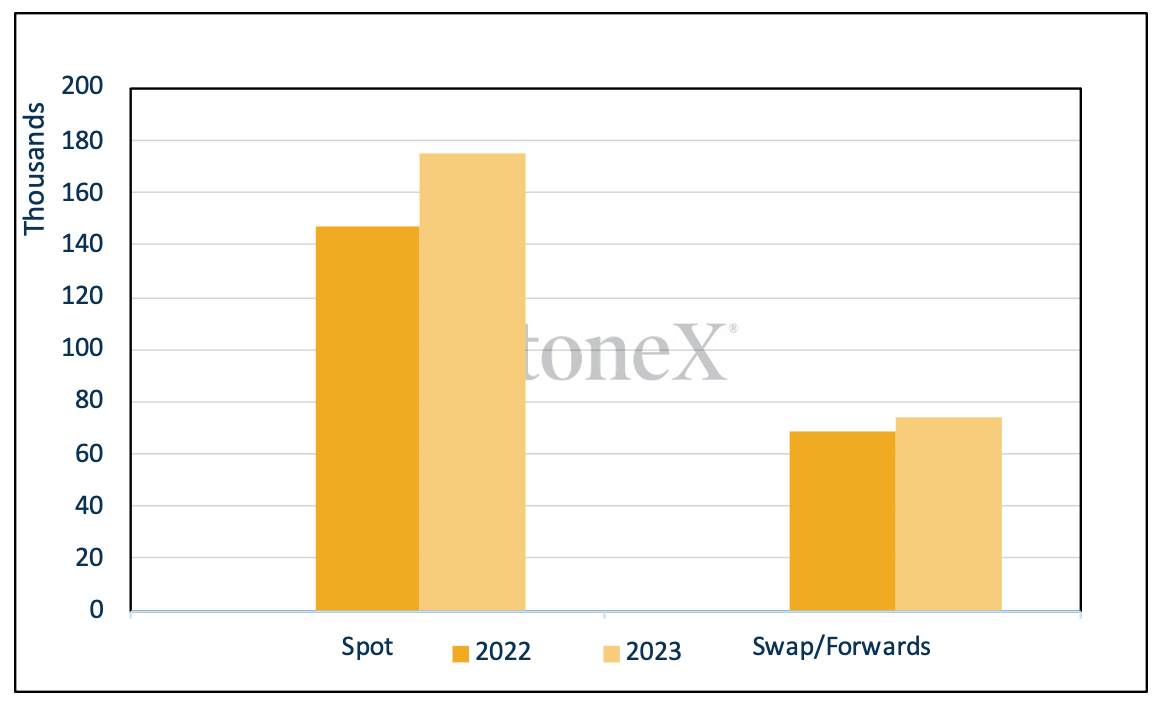
Gold spot and swap/forwards; tonnes
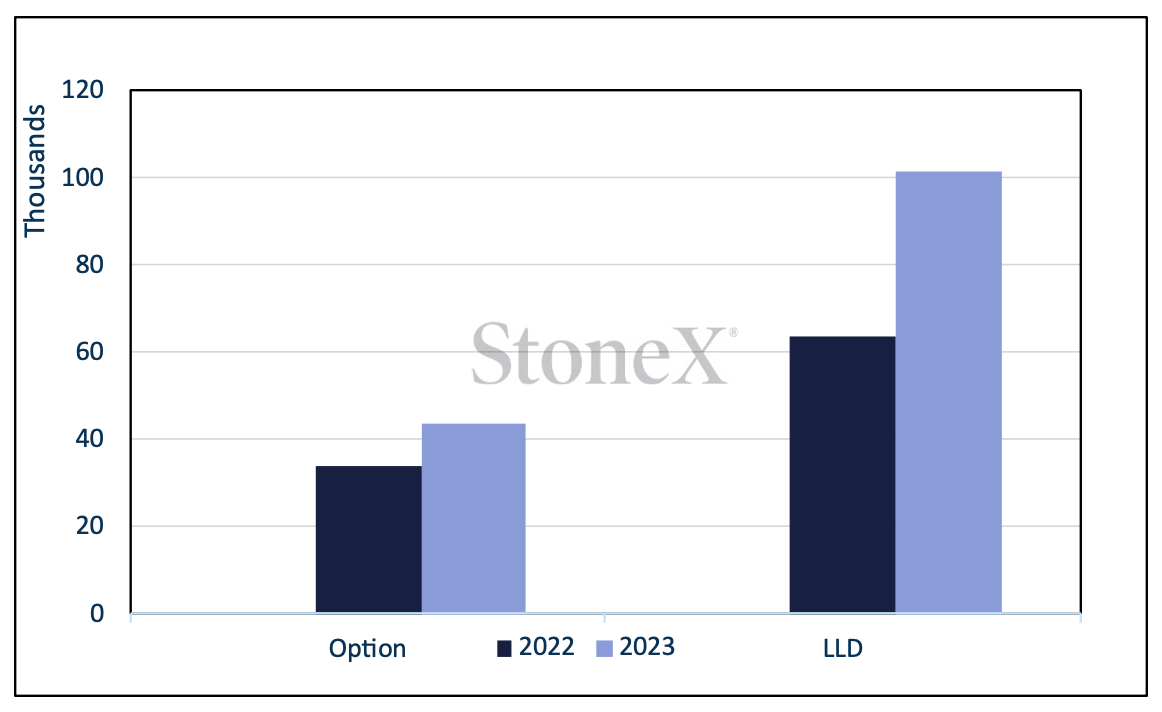
Gold options and LLD; tonnes

Source: LBMA, StoneX
Gold continued to respond to increasing tension in the Middle East and the gradual increase in the involvement of some western forces , and of course the debate about the Federal Reserve’s interest rate intentions was a continual subject of debate. The FOMC Statement and Fed Chair Jay Powell’s Press conference on 13th December saw a burst of enthusiasm through the financial markets as it was implied that the Fed has started talking about cuts; in the end a number of Committee members felt compelled to make public statements trying to dispel the delay that cuts would be coming in 2024, possibly as soon as March. Certainly the bond markets, as usual, took a much more benign view than even the softer rhetoric from the Fed.
Gold bounded up to an afternoon LBMA Auction price of $2,046 on the 14th, after $1,982.50 the previous day – a gain of 3.2% in 24 hours. The move, though, was in light volume (and of course thin volumes can make for deceptively wide price-swings) and there followed a correction in mildly heavier volume. The move had set the scene for further gains, however, as gold clambered to a high for the month of $2,089 at month-end.
The only days of any action in spot, swap/forwards and options were at the start of December, with heavy spot volumes on 4th when the price started its correction, having traded a very wide range, spiking up to $2,135 then dropping sharply to the support from the 10-day moving average at $2,017 and closing slightly off the lows. This action was also Fed-driven; initially the markets interpreted comments from Chair Powell as meaning that rate cuts were on the horizon; then the correction, when it came, was dramatic and accompanied by a jump in US bond yields. At that point the markets were pricing in a 55% chance of a rate cut in March (that reached 80% not long thereafter, but has now evaporated). Forward activity was incredibly heavy, at 16.9M ounces (525t) so there is little doubt that some market participants took advantage of the price action (and may have helped to fuel the reversal).
The only other activity of note was in the LLD sector towards month-end as spot prices approached $2,100, suggesting hedging activity.
Spot gold volumes, December, M ounces

Source: LBMA
All of this may well be leading to increased risk aversion and has thus been helping to underpin gold, but not – until technical issues kicked in in the first days of December – to give it much independent upward impetus
Gold in key local currencies, January 2023 to date
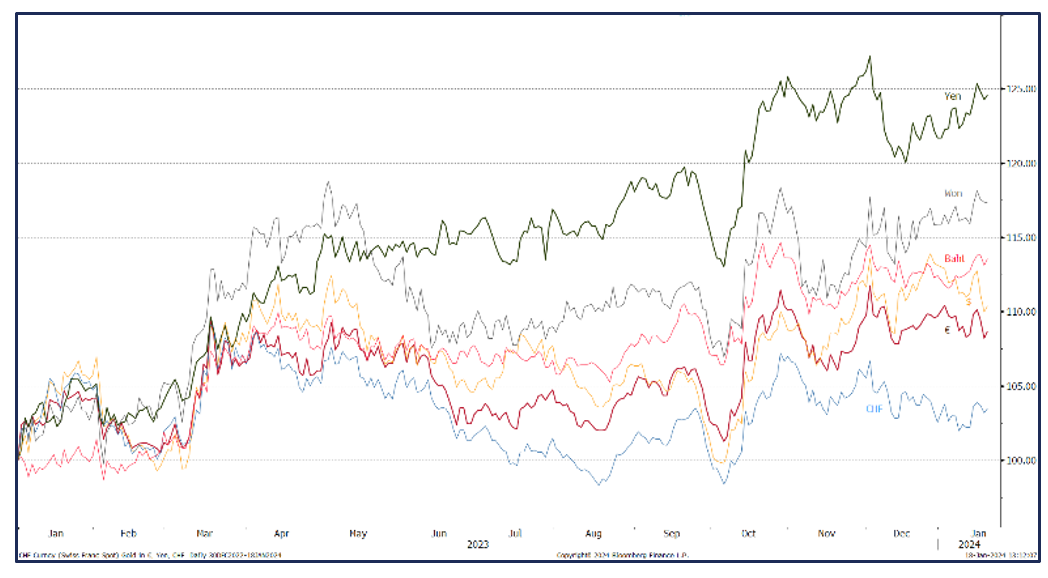
Source: Bloomberg, StoneX
In the background, Exchange Traded Products were mixed, with ten days out of 21 posting new creations, but there was one heavy day of net sales that almost single-handedly swung the net position into the red column, with falls of ten tonnes over the month. For the whole of 2023, The World Gold Council (the most reliable source) shows a fall of 244t (funds exodus of $14.7Bn), leaving holdings at year -end of 3,226t, AUM $214.4 Bn. World mine production is roughly 3,650t.
The Money Managers’ activity on COMEX over December saw a 53t (10%) decline in outright longs and a 15% fall in shorts, taking the outstanding net position to 331t at year-end compared with a twelve-month average of 218t.
SILVER
The year as a whole: – spot silver volumes were a multiple of 71 times global mine production. Total volume including all the OTC derivatives was 104 times global mine production.
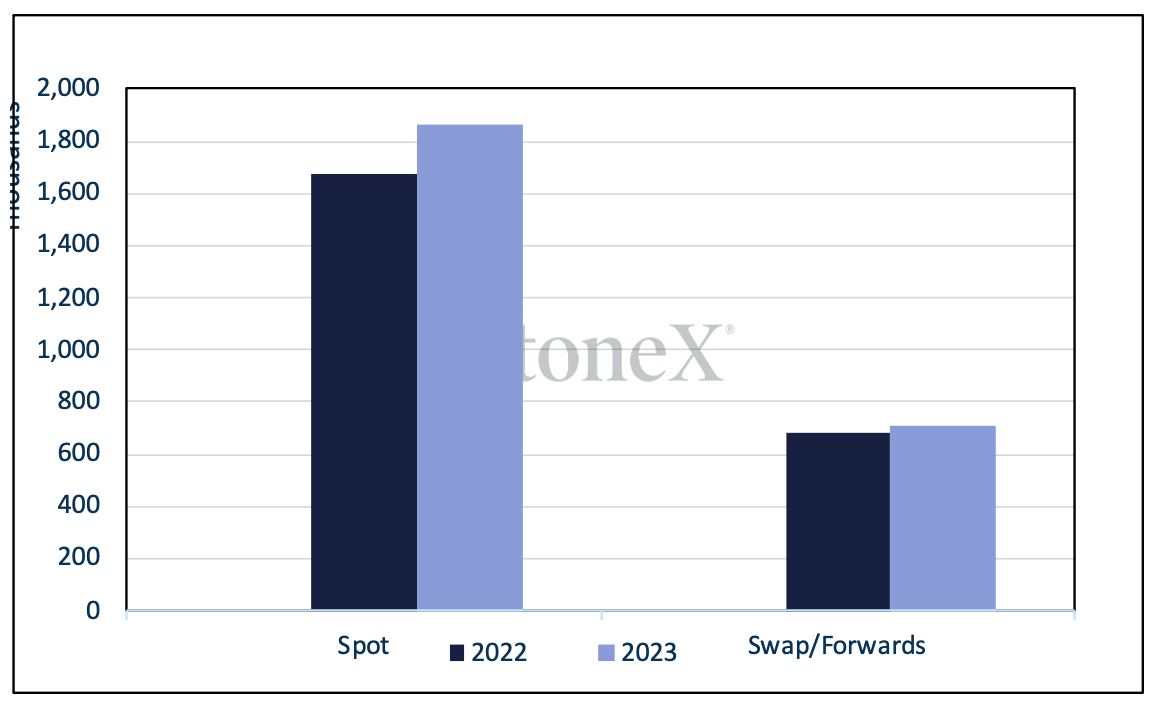
Silver spot and swap/forwards; tonnes
Silver options and LLD; tonnes
Source: LBMA, StoneX
December spot volumes were down 13 % against January-November and in keeping with the time of year, first half-month volumes were roughly 36% over those of the second half, taken across the board. Spot was busiest in the first week, while swaps and forwards were busy across the whole of the first fortnight. Options showed some life in mid-month and thereafter, while the LLD sector was busier, but not noticeably so, at the start of the month.
As we noted in the introduction, silver had crested $25 at the end of November and the heavy volumes across the board sin the first few days of the month clearly indicate market participants capturing these higher prices and contributing also, therefore, to the reversal. Much like gold, the 4th traded a wide volume, between $25.76 and $24.42 (5%) and started a series of seven consecutive days of falls. This was accompanied by long liquidation and fresh shorts on COMEX until the price rebounded towards $23.80 in mid-month – unsurprisingly on the same day that gold bounced as the markets decided that they had over-interpreted the outlook for the Fed’s rate cycle. Options volumes picked up at this point, suggesting that the $24 strike was in play. Bargain hunting also appeared in the Exchange Traded Products.
So the essence of December, therefore, was that $25 represented an opportunity to lock in prices, while $24 and below was seen as good value.
Gold, silver, the correlation and the ratio, year-to-date
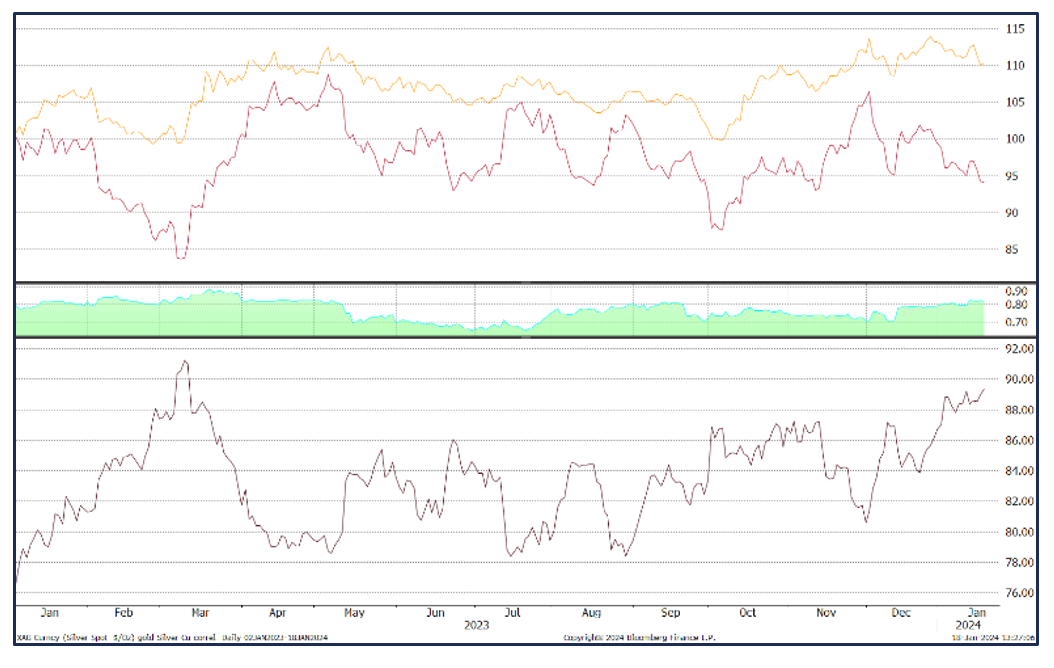
Source: Bloomberg, StoneX
Spot silver volumes, December, M ounces
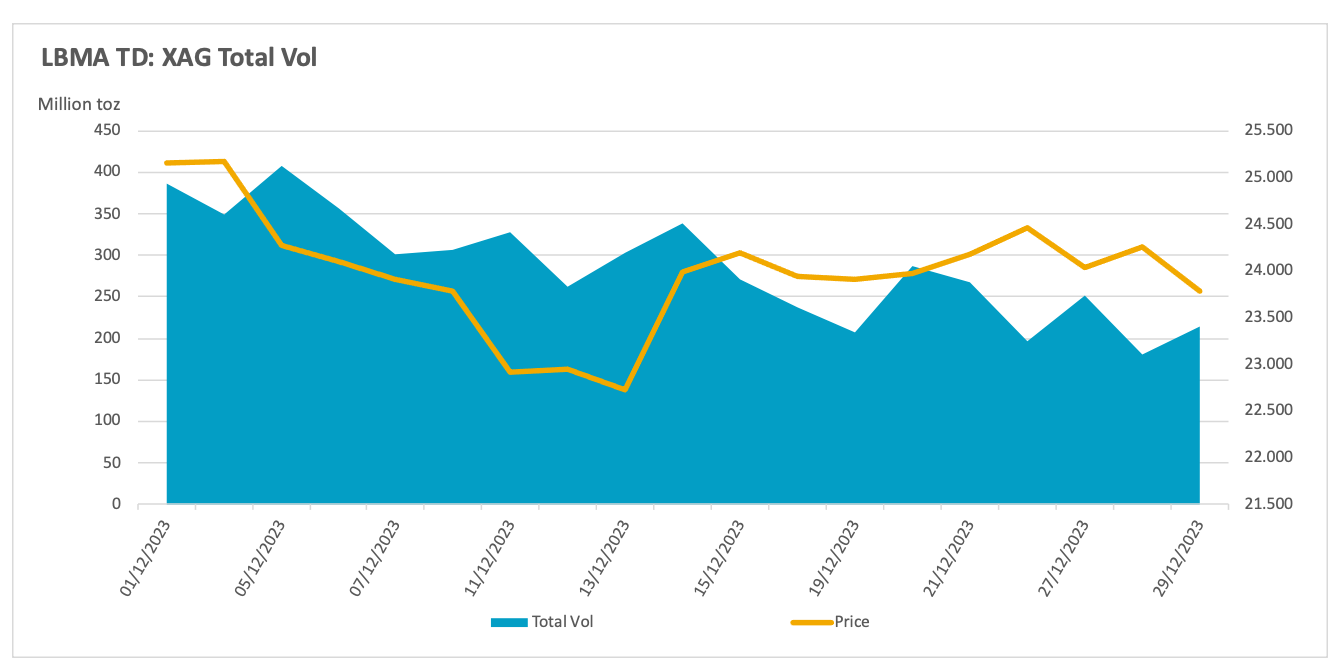
Source: LBMA
Activity on COMEX was again similar to that of gold, with positions contracting on both sides Outright longs came down by 20% or 1,456t while shorts contracted by 10% or 336t. This left the net long at 1,342t against a twelve-month average of 1,649t. The outright short position, at 3,225t, was below the twelve-month average of 4,407t although it has expended again in early January… The Exchange Traded Products struggled, along with gold, with just nine days of net creations and a net fall of 415t. This is only marginal, representing just 1.8% of the end-October total. For context, global annual mine production is approximately 26,000tpa.
PLATINUM
The year as a whole: – spot platinum volumes were a multiple of 46 times global mine production. Total volume including all the OTC derivatives was 69 times global mine production.
Platinum spot and swap/forwards; tonnes
Platinum options and LLD; tonnes
Source: LBMA, StoneX
From a fundamental standpoint, the falls in palladium and rhodium prices mean that some platinum primary supply is under threat, notably in South Africa. One company is reported to have been offering voluntary redundancies, while another is looking at restructuring and Amplats has flagged that it could lose 0.5M ounces of PGM output this year (3.3M from 3.8M). Given the long-term outlook for palladium and rhodium it would not be a surprise to see further announcements of cutbacks this year. The problems with power supplies from Eskom have not retreated and it now looks as if at least 15t of platinum is building up as work-in-progress, as some ore has been mined but not fully treated because of power supply restrictions. The miners are being cautious and we should not expect any of this stockpile (and the numbers here are conservative estimates) to start reaching the market until the second half of 2024 at the earliest. These disruptions are more likely to affect the forward curve than the outright spot price given that the metal will eventually reach the market.
Spot platinum volumes, December, 000 ounces
Source: LBMA
On the demand side, the programme for substituting some palladium loadings with platinum, reflecting the period at the start of the decade when palladium was at a hefty premium to platinum, is due to complete during the third quarter for next year. It is possible that we sill we some reverse substitution after this, but given the onward march of vehicle electrification it is not yet clear how much money the market stakeholders would be prepared to commit to retooling an instrument that will eventually become redundant. More of this in the palladium section.
Meanwhile the markets are still looking to the prospect for platinum usage in fuel cells over the longer term as the vehicle fleet electrifies, while diesel usage, especially in off-road vehicles and in China remains solid, although diesel vehicles now only comprise roughly 30% of the European vehicle purchases; for many years, largely due to favourable taxation policies, diesel comprised more than 50% of European vehicle purchases.
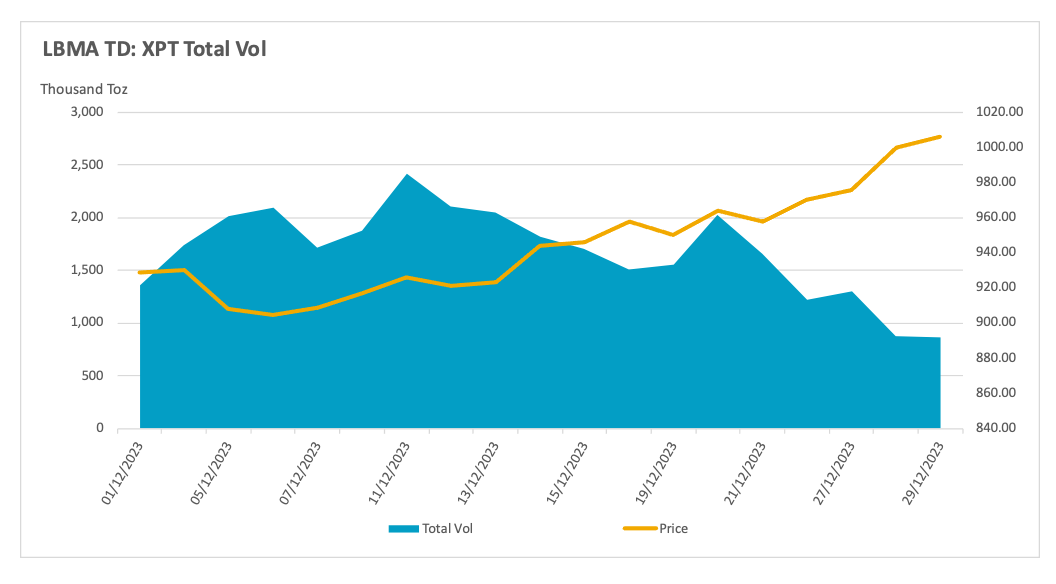
Trading patterns: December volumes were interesting. Prices eased in the first few days but then went on a lively bull run, moving from $890 on the 12th to a high of $1,015 (28th) before easing from an overbought position and no doubt some year-end profit-taking and book-squaring. (The move was reversed in the first half of January, with $900 again coming under pressure). The swap/forward markets were very busy in the first three weeks, suggesting industrial forward hedging, especially given that platinum has a reasonable long-term outlook. The reports of Amplats’ potential output reduction almost certainly helped the upward impetus also. Average daily volume in swaps/forwards was 24% higher than the January-November average.
Spot platinum and NYMEX inventories, five-year view

Source: Bloomberg, StoneX
Exchange Traded Products were mixed, but there was some buying activity as prices rose; this activity was more likely to be a price taker than a price maker given the fundamental developments in the background. Of 21 trading days in December, eleven saw net creations for a .net gain of one tonne of metal.
NYMEX activity was the reverse of November, with longs adding 15% (7.4t) and shorts contracting by 24% or 4.7t to leave the net position in a long of 25.8t. After a number of weeks in which the outright shorts had been veering wildly in one direction or another, suggesting some speculative jobbing of the market, or possibly also some hedging of material from decommissioned plants, conditions have now settled. The month-end change was the prelude to a series of consecutive weeks posting net long, and points to a change in sentiment.
PALLADIUM
The year as a whole: – spot platinum volumes were a multiple of 46 times global mine production. Total volume including all the OTC derivatives was 69 times global mine production.
Platinum spot and swap/forwards; tonnes

Platinum options and LLD; tonnes
Source: LBMA, StoneX
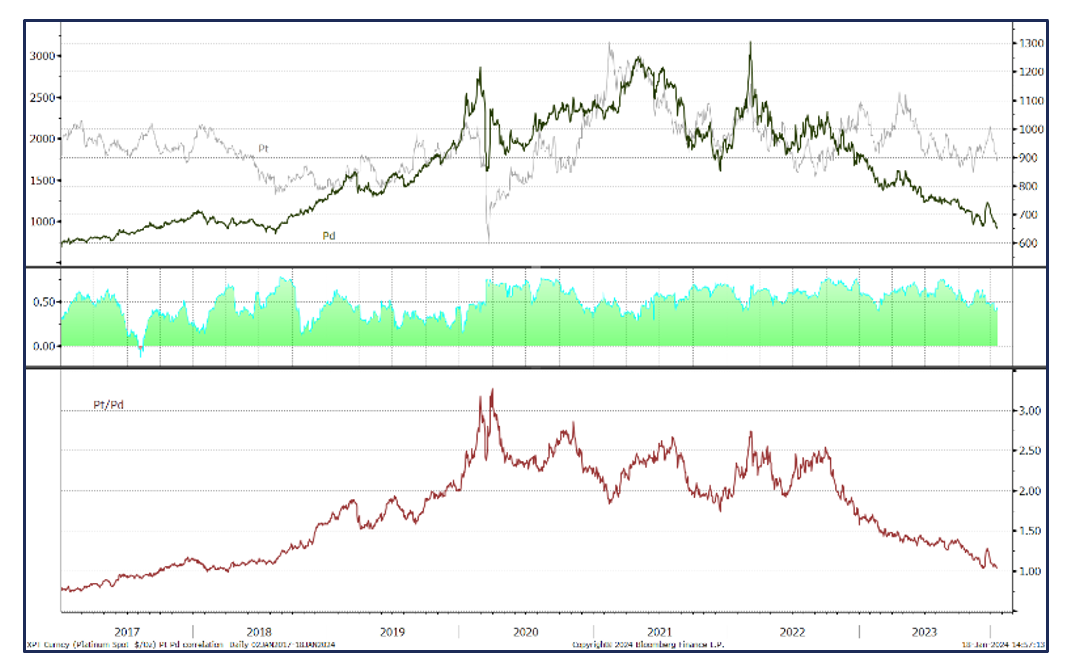
Palladium remains under a cloud and is likely to do so for the foreseeable future. That said, the massive price falls of the past three years (apart from the short-lived spike in early 2022) have taken the spot price below the $1,000 level to six-year lows and the premium to platinum has come down to just $30 in early January and it is only a matter of time before the two cross over. As noted in the section on platinum, the past eighteen months or so have seen platinum encroaching on palladium’s role in the emission control catalysts in the auto sector, as a result of the massive premium that palladium had been enjoying over platinum prices. That programme will be complete somewhere between June and August 2025. Whether there is any subsequent reverse engineering is still open to question given that ICE vehicle production is being eroded by electric vehicles, but given that this path to full electrification will take at least another 15 years we should probably be ready for some shift in tooling once more.
Platinum, palladium, and the correlation
Source: Bloomberg, StoneX
Palladium opened December on by continuing the bear run that and started in late November, falling from $1,090 to $925, posted on the 5th, before just over a week of consolidation and then a massive short-covering rally, taking spot from $994 to $1,119. Arguably, this was triggered by news that the United Kingdom was planning measurers that would prevent British individuals and companies from “directly or indirectly [acquiring] metals which originate in Russia or are located in Russia” including aluminium, cobalt, copper, lead, tin and zinc.
Palladium was not on the list, but because of the publicity surrounding sanctions (and some self-sanctioning also), and the fact that Russian brands are currently suspended from LPPM Good Delivery lists, sentiment spilled over and triggered a wave of short covering; in the week to Tuesday 19th December the outright shorts on NYMEX dropped from 44.5t to 32.8t (and fell again the following week, but by a much smaller margin). Some of the later short covering may have been year-end book-squaring / profit takngi, especially as some fresh shorts developed in early January. Longs continued to liquidate over the month as a whole, leaving the final net position in a short of 18.4t, the lowest for six months as stakeholders squared off.
Prices continued to rise until peaking at $1,250 on both 19th and 22nd December; then reality set in and all of that upward move had been wiped out by mid-January, with only one day of gains in a total of 17 trading days.
As far as the OTC numbers are concerned, the stand-out was a big pick-up in swap/forward volumes during that hard mid-month rally, as market participants locked in improved prices. Swap/forward volumes over the month were on average 24% higher than in the first eleven months of the year.
There was also some very heavy options activity in mid-month as the rally kicked off, suggesting that both the $1,100 and $1,200 options may have been in paly – and given the fresh volatility in the market, it may have been that they were bring offered rather than bid.
Palladium spot volumes, November, 000 ounces

Source: LBMA
The ETPs were narrowly mixed, oscillating around the 16t level, which compares favourably with the year’s opening levels of just under 14t. Among the four metals covered here, palladium had the highest number of days posting net creations, but only very narrowly – just 13 days from a total of 21.
This nervous and illiquid market that will at some stage generate another short-covering rally, but the overriding sentiment is that any strength in price (barring exogenous shocks) will be generated by short-covering and nothing else.
The views and opinions expressed herein are the views and opinions of the author and do not necessarily reflect those of Nasdaq, Inc.