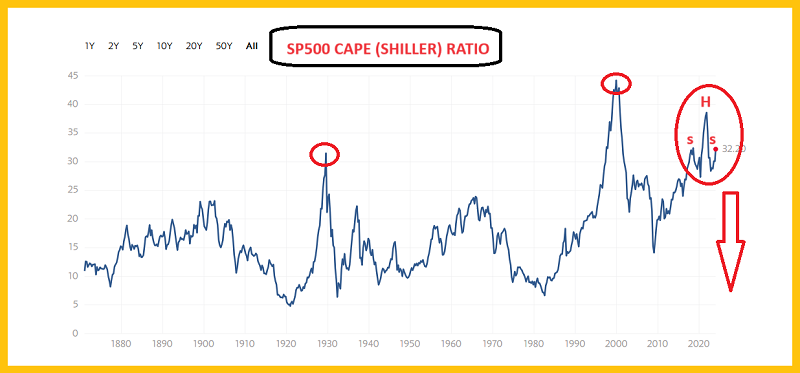
With a CAPE (inflation-adjusted P/E ratio) that Icarus would have a hard time reaching, the US stock market is ripe for a major fall.
It can be argued that the outrageously overvalued US stock market has devolved into a macabre poster boy for the hideous debt-funded global meddling expeditions of the nation’s government and major banks.
Shelter has become “rising house price equity” for the average US person. Basic goods like food and health care have become unaffordable, yet the government and banks happily race to launch more debt-funded overseas regime change wars.
These wars consistently turn the targeted citizens into de facto cave dwellers. Many now look like dead and mangled characters in a Mad Max movie.

The good news is that the hideous charade may be coming to an end. There’s a potential double-headed H&S top on the Dow and the first week of 2024 trading was negative. That’s an ominous sign for the year!
In the short-term, the stock, commodity, bond, and markets could become very volatile.
Given the wild market action and the solid tactics we use with items like , , , , SDOW, etc.
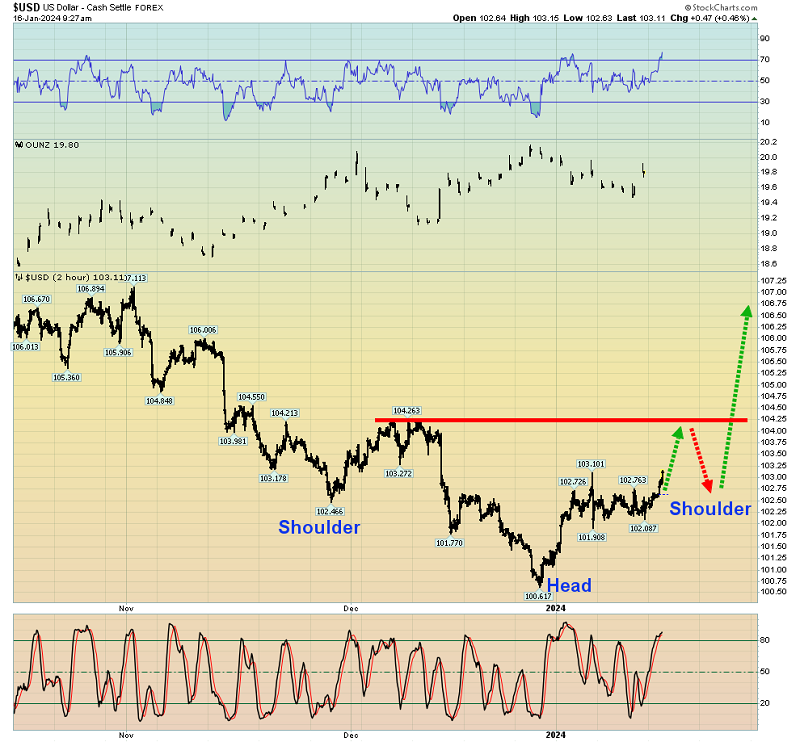
The has a possible inverse H&S bottom pattern. The head of the pattern is itself a loose inverse H&S.
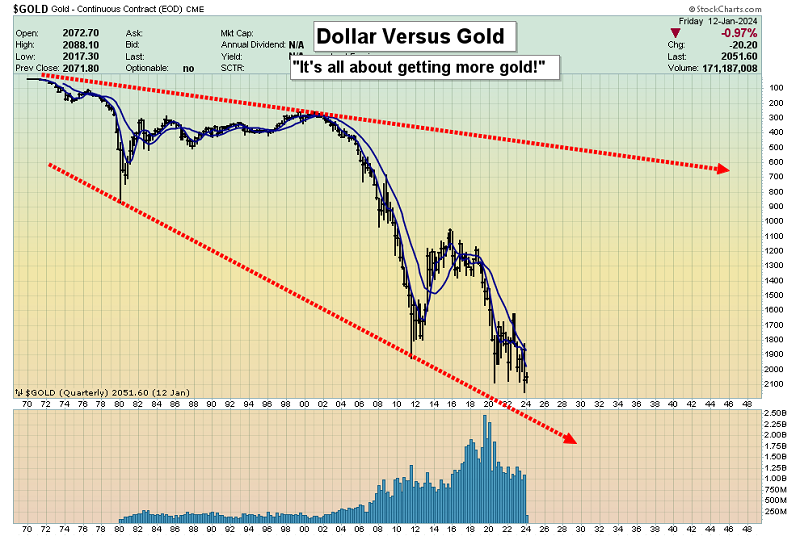
Could an institutional money manager charge into safe-haven US fiat bring a swoon for gold? Gold is the ultimate currency, so any significant price sale needs to be bought. Fear of a gold price sale is illogical.
Also, any gold price dip is likely to be short-lived because it’s likely only a matter of time before US government meddling in Gaza and Israel results in an expansion of that war.
And a rise in the price of .

Oil, the dollar, and rates have been in sync since the summer.
If the dollar and rates are beginning a substantial rally, oil likely is too. That’s a death knell for the US stock market, but if there’s a ramp-up in the 2021-2025 war cycle, any swoon in the price of gold is likely just a short-term event an event to be bought.
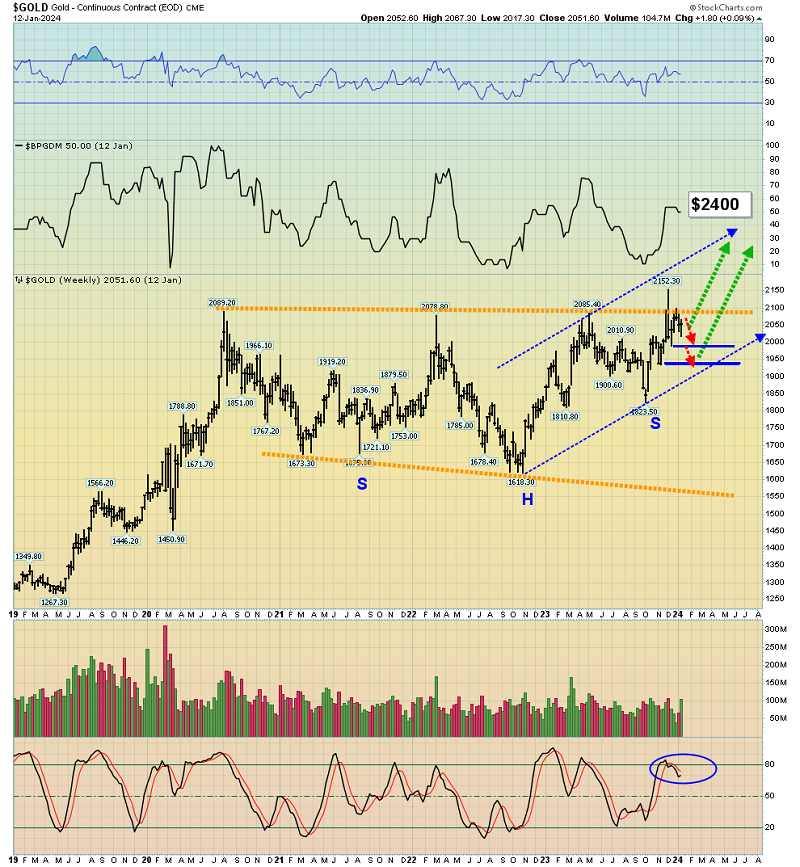
The weekly gold futures chart. It can be argued that gold has successfully broken out above the key $2000 round number zone and is consolidating that breakout now.
There’s also a big broadening pattern in play that amateur investors call a “triple top”. Broadening price action indicates a situation that is out of control.
It doesn’t take a rocket scientist to notice that US government debt and meddling is out of control. The use of the stock market as a poster boy is also out of control.
If there is a short-term price sale for gold, where should investors buy? Should they buy and miners too?
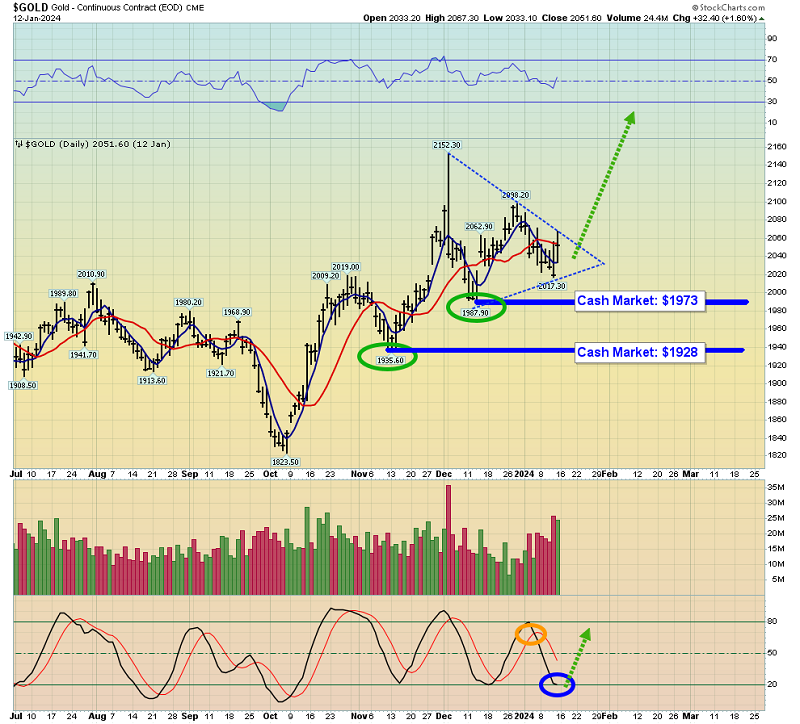
The daily gold futures chart. A price sale that sees gold trade near the December or November lows would create a spectacular buying opportunity.
For gold, silver, and for an array of mining stocks too! Basis the cash market price, that would be around $1973 and $1928.
Gold doesn’t necessarily trade at either of these important buy zones, but if it does, investors need to be prepared to buy, and to do so without hesitation.
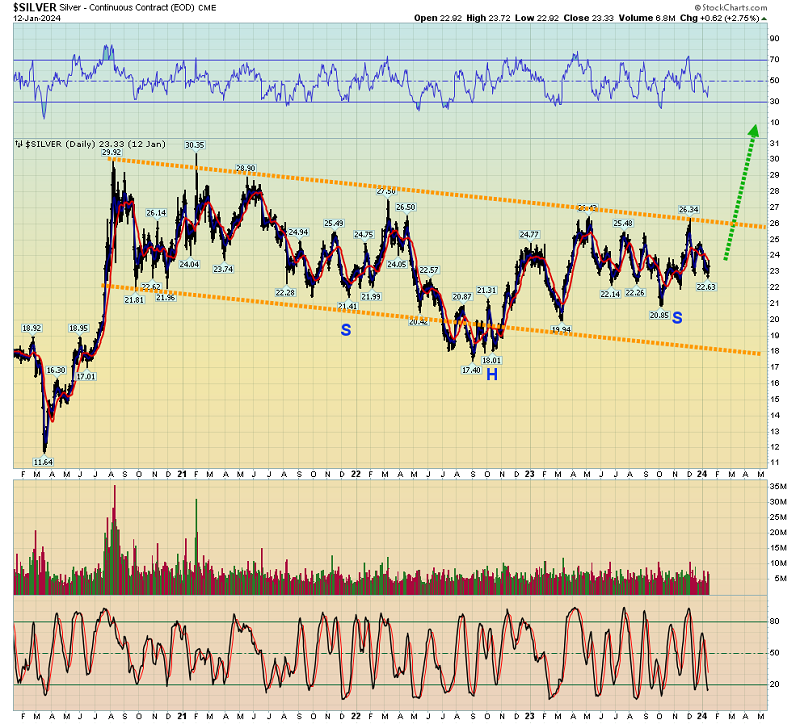
Since 2020, silver has been trading in what is best described as an annoying but bullish rectangular drift.
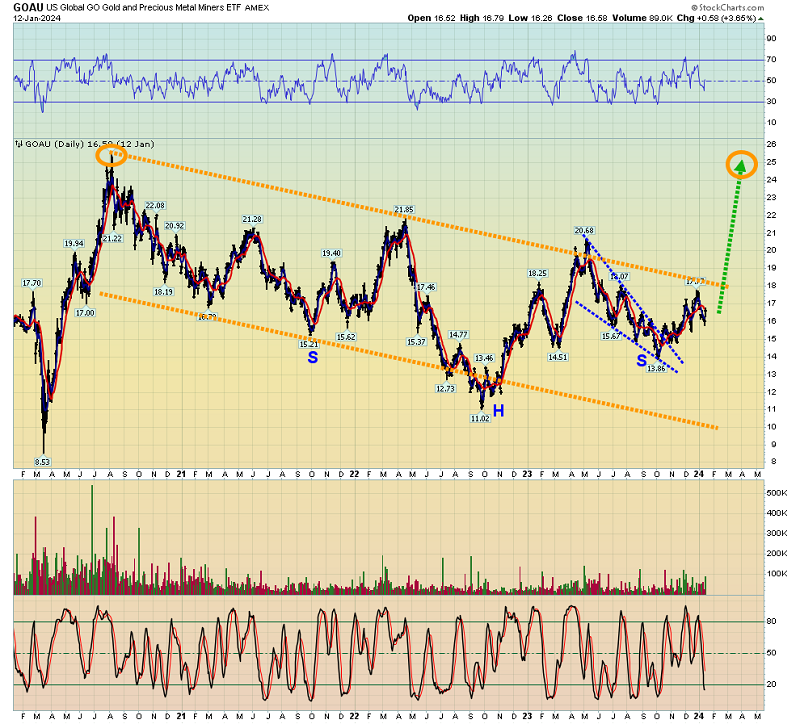
The ETF looks similar to silver. There have been lots of buy and sell opportunities for both silver bullion and gold stocks within the drift zone, and the next one would be defined by a gold price sale into $1973.
Gold will see thunderous buying from India’s “titans of ton” citizens if there is a price sale into $1973, and Western commercial traders on the COMEX will follow their lead.
In the coming years, the demand from India will intensify on all the major price sales.

The bottom line: Gold bugs of the world have nothing to fear as this day begins. The smile is Somasundaram’s, and the caption is mine: Smile, if you love all that is gold!


