|
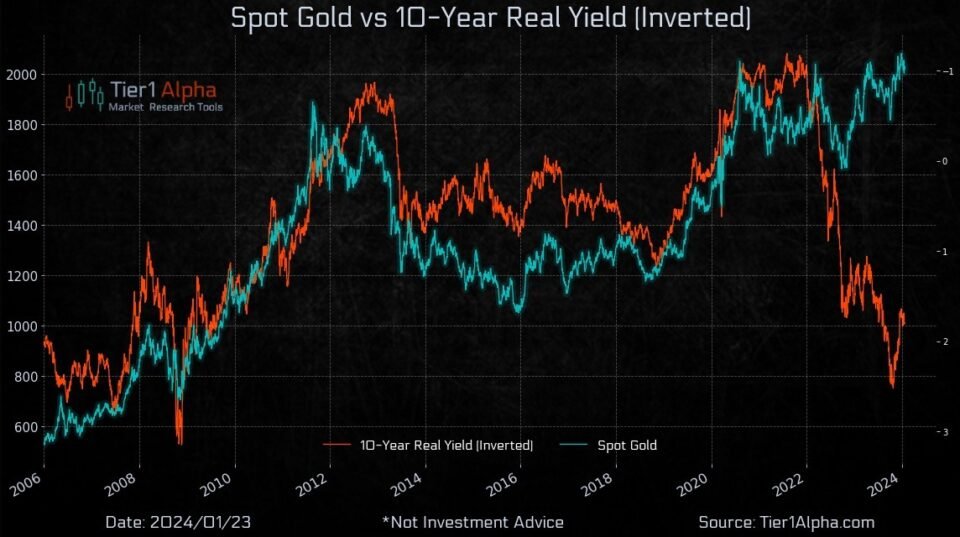
Below is a chart and brief excerpt from today’s Market Situation Report written by Tier 1 Alpha. If you’re interested in learning more about the Hedgeye-Tier 1 Alpha partnership, there’s more information here.
|
We are bringing back the alligator charts to the bonus section. The reason for the correlation divergence in today’s example is quite interesting.
The advent of gold ETFs in the United States in 2004 marked a pivotal shift in the investment landscape, fundamentally altering gold’s role in the financial markets. Historically, gold’s price was static, or it was seen as an illiquid asset tucked away in the coffers of a select group of investors. The dynamic has transformed forward to today: gold has become a highly liquid financial asset. This transition is underscored by the sheer volume of gold held by ETFs in the U.S., surpassing $100 billion. In this new era, the marginal price of gold is not anchored to its physical allure but is driven by its financial demand. Investors now juxtapose the expected real return of gold against a suite of other liquid financial assets. Consequently, it’s reasonable to posit that gold’s future behavior will mirror the patterns established in recent decades, detaching from historical precedents such as those of the 1970s.
Here are some analytics for you, looking at the interplay between real gold prices and real yields from 2006 through 2022. Using a regression model with the logarithm of real gold prices against the 10-year TIPS market yields, an inverse correlation presents itself: a 100-basis-point uptick in real yields typically precipitates a 22.2% contraction in real gold prices. This “real duration’ of gold,” while purely empirical and subject to fluctuation akin to the variable correlation between equities and bonds, is a testament to gold’s responsiveness to macroeconomic forces. For instance, the significant dip in gold prices in April 2013, preceding the spike in fixed income yields, corroborated the historic “real duration” metric, suggesting that gold prices can serve as a harbinger for shifts in yield landscapes.
Yet, when we adjust the gold price for movements in real yields, we gain a more nuanced understanding of its valuation over time. The “real-yield-adjusted gold price” offers a lens that factors in the fluctuating the opportunity cost of holding gold. While not a panacea for all price movements, this adjustment reveals a more constrained range of fluctuation, barring episodes of extreme inflation as witnessed in early 2022. The launch of gold ETFs and significant market inflection points like the 2008 financial crisis have undeniably influenced gold prices by altering investor demand or risk perception. Nonetheless, the empirical evidence underscores real yields as the dominant factor in determining gold’s price, solidifying its status as a financial asset. As such, in a milieu where real yields are rising, gold prices should ostensibly decline to maintain equilibrium in investor demand. Conversely, an ascension in gold prices can be anticipated if real yields fall.
|
Learn more about the Market Situation Report written by Tier 1 Alpha.
|
HELPFUL LINKS:
Join New Subscriber Orientation
New Conference: Hedgeye Live 2024 May 2-5
Hedgeye University | Become a Better Investor
Hedgeye Education Center | Learn More About Hedgeye
WATCH | Position Sizing A Long-Only Portfolio with Keith
New Product Alert: P.S. Insights
Free Edition of The Macro Show – Recession Risk Rising: Are You Prepared?
Learn About Our New Sectors: Global Technology Pro and Software Pro


