

Highlights of the week: British inflation, ECB rate decision, UK manufacturing and services PMI
Wednesday
UK inflation rate at 06:00 AM GMT. The consensus is for a decline from 2.8% to 2.7% in June. If the consensus is correct, then it would be the yearly low figure of British inflation and could potentially create some short minor losses for the quid since it could influence the decisions of the Bank of England at their next meeting.
Thursday
ECB Interest rate decision at 12:15 GMT. The market consensus is that the central bank of Europe will keep the rates stable at 2.40%. If there is a surprise rate hike, then the Euro might find support against other major currencies, while a cut might create some losses in the short term. Investors and traders are rather focused on the subsequent press conference following the release, which will be focusing on getting possible insights on the monetary policy steps ahead.
Japanese inflation rate at 23:30 GMT. The expectations for June are that the rate could go up to 1.7% from the previous 1.5%. This might be somewhat bullish news for market participants trading the yen.
Friday
Flash British manufacturing PMI at 08:30 AM GMT. The expectations for the figure are at 52 compared to the previous 52.5. UK manufacturing has managed to remain above the 50-point mark since October 2025, and if the expectations are confirmed, then it might create some short-term gains for the pound.
Flash British services PMI at 08:30 AM GMT. Market participants are expecting the publication to increase to 49.3 points compared to the 48.8 points of June. The services sector in the UK has managed to remain above the 50-point mark for the last 20 months (excluding April of 2025 and May 2026). This could support the narrative of expecting the figure to come out higher than 50 points, in which case it could create support for the quid in the aftermath of the release.
USOil, daily
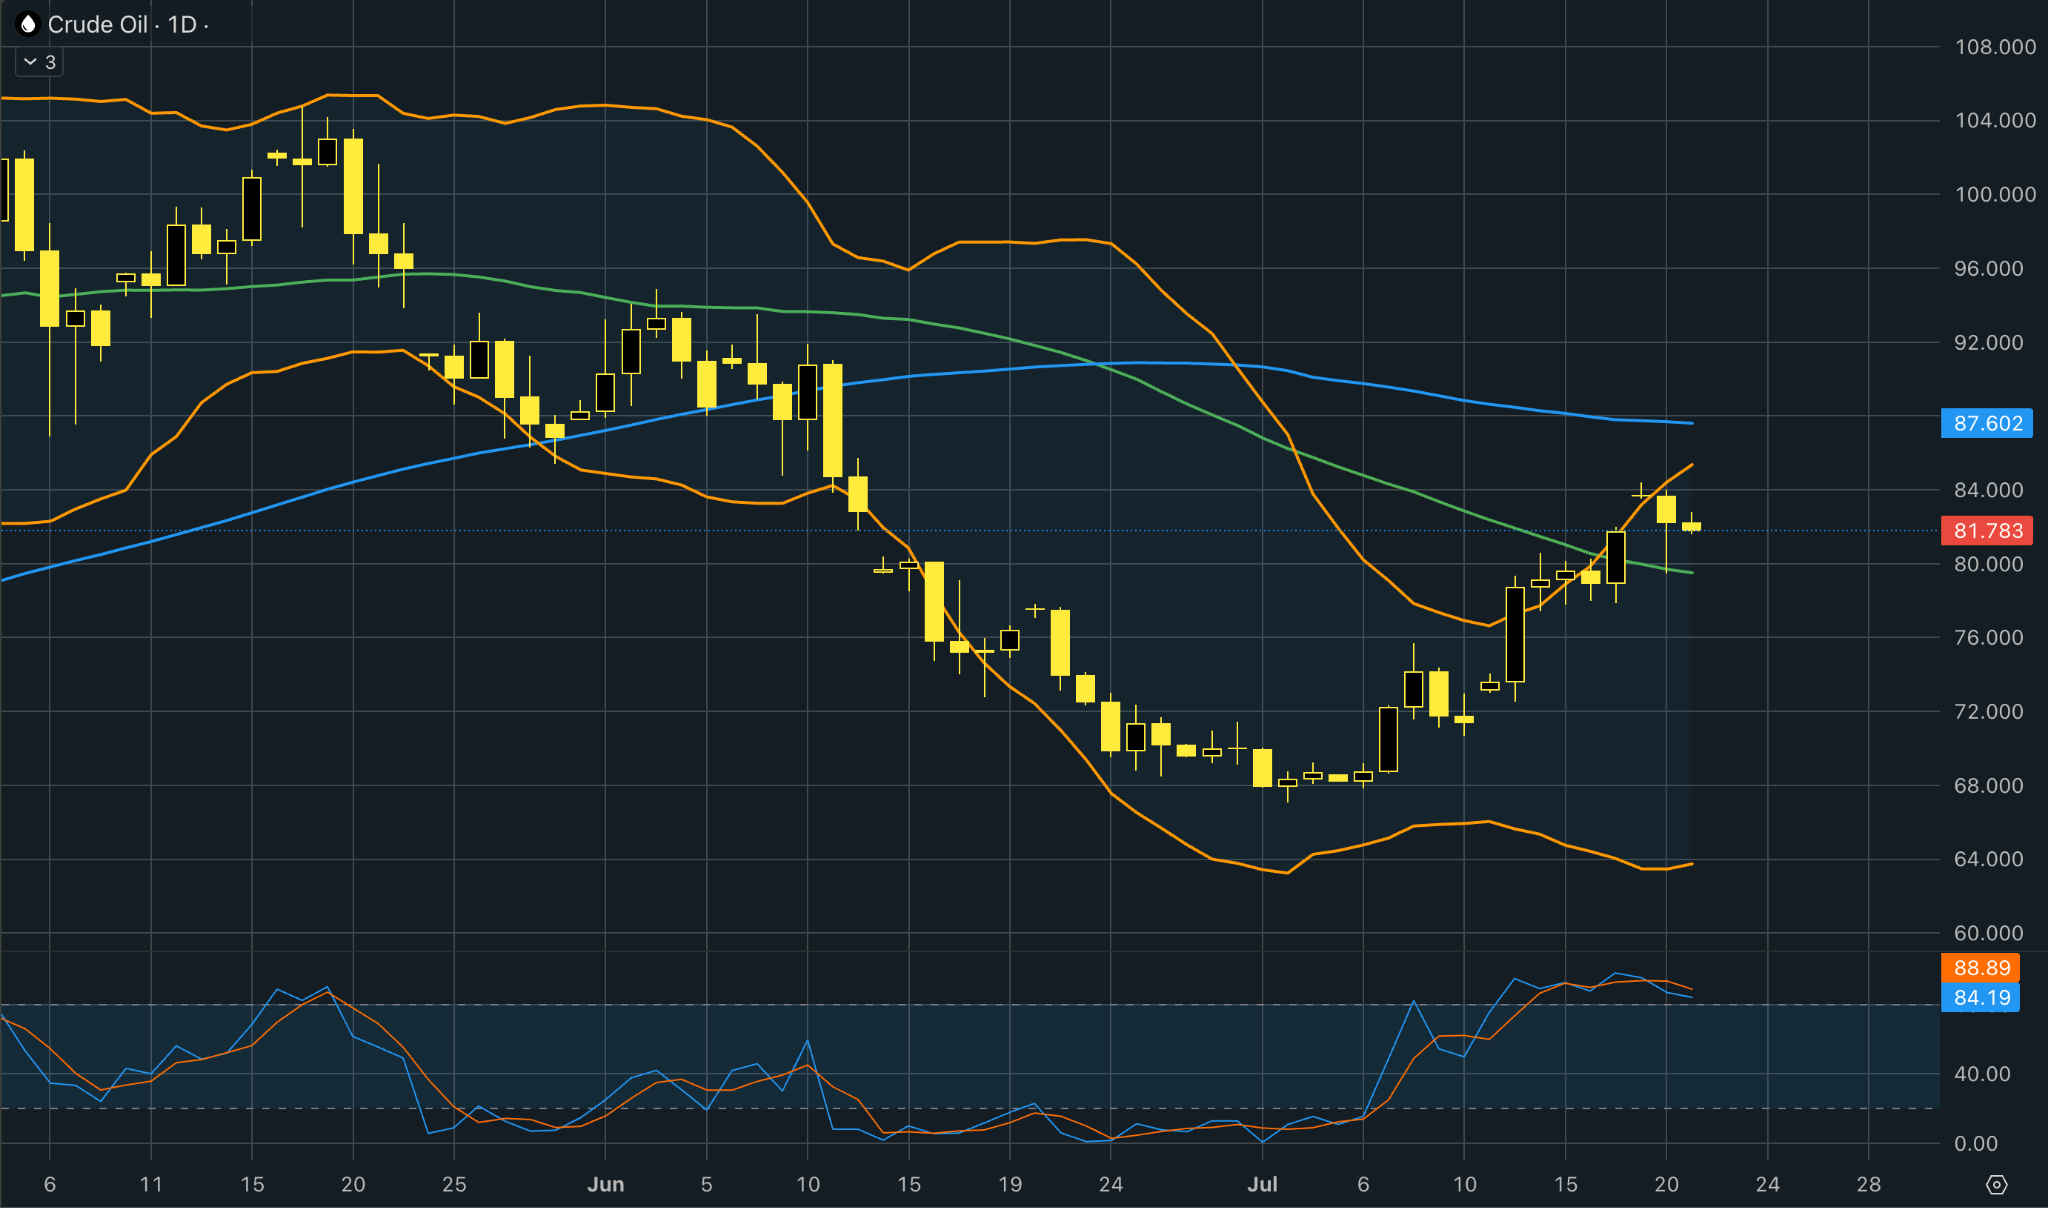
Oil prices edged lower after strong gains in the previous two sessions as traders balanced escalating tensions between the US and Iran with renewed diplomatic efforts to secure a ceasefire. Despite ongoing military strikes and retaliatory attacks, reports of proposals for a temporary halt in hostilities eased some supply concerns. However, risks remain elevated as threats to key shipping routes in the Strait of Hormuz and the Red Sea continue to fuel fears of potential supply disruptions. With global oil inventories already tight, any disruption to maritime infrastructure could trigger renewed price volatility.
From a technical perspective, crude oil has extended its recovery but is now showing signs of losing momentum after failing to sustain a move above the recent highs near $84. Price has climbed above the 50-day SMA, indicating improving short-term sentiment, but it remains below the 100-day SMA, suggesting the broader trend is still cautiously bearish. The Bollinger Bands have begun to widen, reflecting increased volatility during the recent rally, while the Stochastic oscillator remains in overbought territory and is beginning to turn lower, pointing to the risk of a short-term pullback. A break above $84 would strengthen the bullish case and expose the 100-day SMA around $87.60, whereas failure to hold above the 50-day SMA could trigger a corrective move back toward the $76–78 support zone.
Gold-Dollar, daily
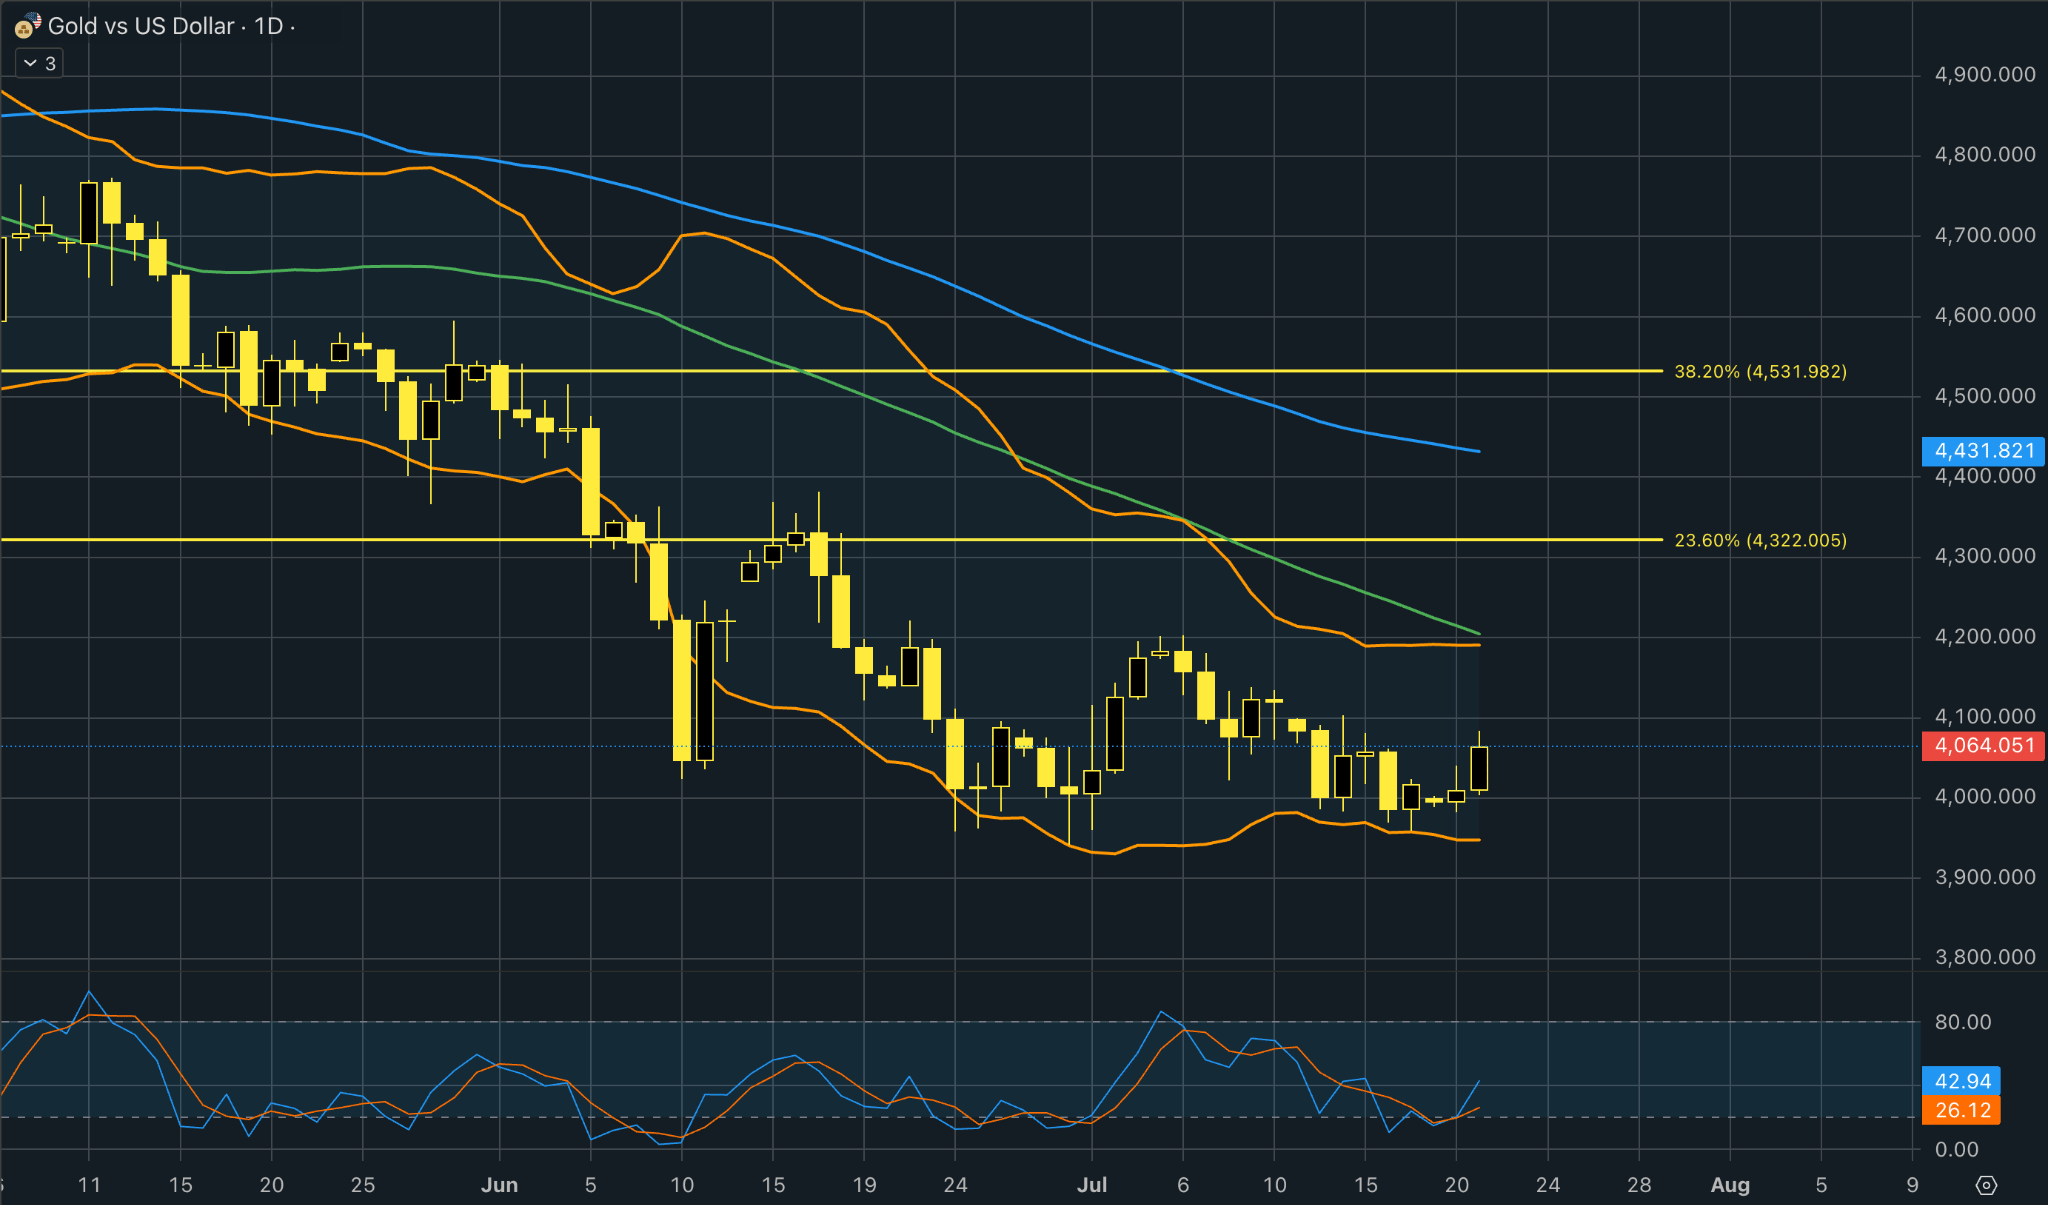
Gold rose to a one-week high as investors bought on recent weakness while monitoring developments in the Middle East and their potential impact on inflation. Although oil prices eased slightly, ongoing geopolitical tensions continued to raise concerns over higher energy costs, which could keep inflation elevated and reinforce expectations of higher US interest rates. Since gold does not generate interest, a higher-rate environment may limit further gains. Still, the precious metal found support around the key $4,000 level, suggesting continued dip-buying, while uncertainty over the conflict and the Federal Reserve’s policy outlook is likely to drive near-term price direction.
From a technical point of view, gold remains in a broader downtrend, with price continuing to trade below both the 50-day and 100-day SMAs, keeping the bearish structure intact. After failing to sustain a recovery above $4,150, the metal has returned toward the lower Bollinger Band, suggesting selling pressure remains dominant. The Stochastic oscillator has turned higher from oversold territory, indicating that short-term momentum is improving and could support a limited rebound. However, unless gold breaks above the 23.6% Fibonacci retracement at $4,322, the recovery is likely to remain corrective. The Bollinger Bands have started to narrow, pointing to easing volatility after the recent decline, while stronger resistance is seen near the 38.2% Fibonacci retracement at $4,532. Overall, the technical outlook remains bearish unless buyers reclaim these key resistance levels.