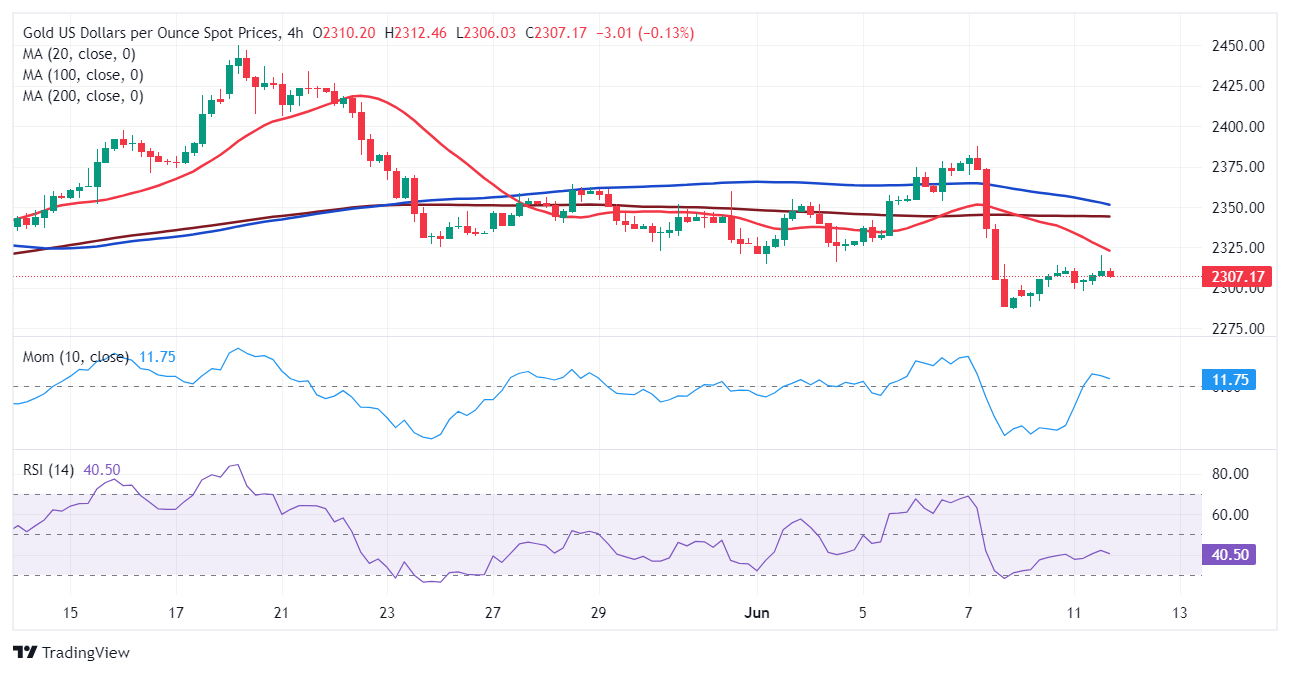
XAU/USD Current price: $2,307.17
- Financial markets maintained a cautious stance ahead of upcoming US events.
- Federal Reserve monetary policy announcement and US inflation coming up next.
- XAU/USD under selling pressure near $2,300, bearish breakout around the corner.

Spot Gold retreated from an intraday high of $2,319.79, with XAU/USD now trading below $2,310.00. Financial markets maintained the wait-and-see stance throughout Tuesday, as the macroeconomic calendar had nothing relevant to offer, and with first-tier events coming on Wednesday. Asian and European shares finished the day in the red and weighed on American indexes, which maintained the US Dollar on the winning side amid prevalent risk-aversion.
Investors await to hear from United States (US) policymakers, as the Federal Open Market Committee (FOMC) is undergoing a two-day meeting and will announce the outcome on Wednesday. The US central bank is widely anticipated to keep the Fed funds rate at the current rate of 5.25%-5.50%, and a rate cut is not seen until September at the earliest. Inflation has ticked marginally higher in the first quarter of the year, while the labor market remains tight, pushing the Federal Reserve (Fed) into maintaining a hawkish stance.
Ahead of the FOMC announcement, the country will release the May Consumer Price Index (CPI), foreseen up 0.1% MoM and 3.4% YoY, the latter matching the April reading. The figures tend to impact the FX board, despite the Fed’s preference to look at the Personal Consumption Expenditures (PCE) Price Index when making monetary policy decisions.
XAU/USD short-term technical outlook
The daily chart for XAU/USD shows that bears retain control. The Momentum indicator bounced within negative levels, advancing but below its midline, while the Relative Strength Index (RSI) indicator aims to resume its slide at around 44. At the same time, the pair is trading below its 20 Simple Moving Average (SMA), while the longer moving averages maintain their upward slopes far below the current level.
In the near term, according to the 4-hour chart, the technical picture favors a downward extension. A firmly bearish 20 SMA cap advances while extending its slide below the 100 and 200 SMAs. Finally, technical indicators gain downward traction between negative levels, although not strong enough to suggest a break below the recent lows.
Support levels: 2,300.00 2,286.60 2,272.90
Resistance levels: 2,315.50 2,328.40 2,342.35

