
Global fund administrator Citco has published its Quarterly Hedge Fund Report for Q3 2026. The report examines hedge fund performance, investor flows and operational activity across Citco’s client base, providing a snapshot of how the industry performed during the third quarter.
Key findings:
- Hedge fund performance moderated in Q3, with a weighted average return of -0.7%, following a particularly strong second quarter which saw returns of 12.3%. Despite the decline, more than half (53%) of funds delivered positive returns, while the year-to-date weighted average return stood at 10.5%.
- Commodities and global macro strategies led performance, returning 11.9% and 3.1% respectively during the quarter. Event driven funds were the weakest performers, declining 3.8%, followed by multi-strategy funds at -1.4%, fixed income arbitrage at -1.1% and equity strategies at -1%.
- Investor demand remained strong, with hedge funds attracting $36bn of net inflows in Q3, just below the $39.1bn recorded in Q2. This brought year-to-date net inflows to well over $100bn, with the industry continuing to attract fresh capital despite softer quarterly returns.
- Multi-strategy and hybrid funds continued to dominate allocations, attracting $15.4bn and $12.3bn of net inflows respectively during the quarter. Funds of funds also saw strong investor demand, recording a further $5.7bn in net inflows.
- The largest funds remained the primary beneficiaries of investor capital, with funds managing more than $10bn in assets under administration attracting $24.9bn of net inflows during Q3. Regionally, the Americas led allocations with $20.8bn, followed by Europe at $13.8bn and Asia at $1.4bn.
Operational activity also remained elevated. Citco’s Middle Office Solutions team processed a record 208,210 treasury payments during Q3, surpassing the 200,000 mark for the first time. Meanwhile, trading volumes moderated over the summer before recovering in September, with straight-through processing remaining high at an average of 97.6% throughout the quarter.
Taken together, the data suggests that investor appetite for hedge funds remains resilient despite a more challenging quarter for performance. While returns softened following Q2’s exceptional gains, continued inflows have pushed year-to-date allocations beyond $100bn, with multi-strategy, hybrid and larger funds remaining the main beneficiaries of investor demand. Operational activity also continues to reflect sustained levels of activity across the industry.
Executive Summary
Hedge funds came back down to earth in Q3, with a dip in performance after a double-digit return in Q2.
With major asset classes experiencing headwinds, the weighted average return across hedge funds administered by the Citco group of companies (Citco) came in at -0.7%, although more than half (53%) of funds were still positive.
The dip followed the best quarterly performance of the decade so far in Q2, when the quarterly return came in at 12.3%. In Q3, event driven funds were down the most, with a weighted average return of -3.8%, followed by multi- strategy funds at -1.4%, fixed income arbitrage strategies at -1.1%, and equity strategies down 1%. Commodities strategies were the outlier, with a gain of 11.9%.
On an Assets under Administration (AUA) basis, returns were mixed in Q3, with larger funds seeing dips in returns while medium and smaller-sized strategies fared better.
Investors have backed hedge funds this year, with net inflows every quarter, and Q3 was no different, with inflows totalling $36bn, just below the $39.1bn in Q2. Hedge funds have taken well over $100bn in net inflows year-to-date, with multi-strategy and hybrid funds continuing to attract the majority of assets.
Meanwhile, the number of treasury payments processed quarterly by Citco’s Middle Office Solutions team broke above the 200,000 mark for the first time in Q3. Daily average trading volumes remained lower than those seen at the start of 2026, with activity closely tracking levels seen in Q2.
This was a tougher quarter for hedge funds after the outsized returns seen in Q2, but this was nothing out of the ordinary – investors will naturally review portfolios after a period of strong returns.
The diversification benefits of hedge funds continue to help drive net inflows across the majority of strategies, in particular multi-strategy funds, and we remain on track for a bumper year in terms of net inflows, with no let-up in demand as we head into the final quarter.
Declan Quilligan
Head of Hedge Fund Services, Citco Fund Services (Ireland) Ltd.
Overview of data
Performance Data
We have considered funds for which we deliver daily PNL/NAV reporting. We only include returns for those strategies where we believe we have sufficient daily service delivery on that strategy.
Treasury
Data on payments volumes are constituted by all dispatched payments including Letter of Acceptances (LOAs). Excludes all payments to investors/ limited partners.
Performance
Commodities strategies were the big winners in Q3, with a weighted average return of 11.9%, while the majority of other strategies were in the red.
Alongside commodities, only global macro strategies were positive, at 3.1%, with event driven the worst performing at -3.8%, followed by multi-strategy at -1.4%, fixed income arbitrage at -1.1%, and equities at -1%.
Year-to-date (YTD) the picture is very different for a number of strategies. Global macro took top spot with a weighted average return of 26.4%, followed by commodities at 14.3%, and equities at 12.2%.
Multi-strategy funds stand at 7.2% YTD, and only event driven funds are negative, at -1.7%.

Q3 2026 Performance By Strategy
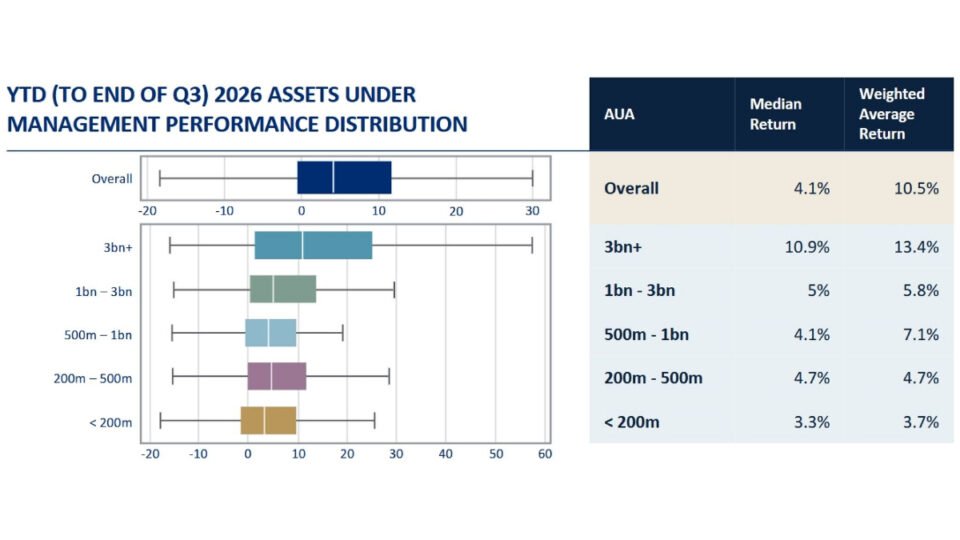
Funds with more than $3bn of AUA had a weighted average return of -0.6%, while funds with between $1bn-$3bn were the worst performers, at -2.1%. The smallest funds with less than $200m of AUA followed, at -0.1%. Other categories saw small gains.
On a YTD basis, the largest funds are still in double-digit territory, with a weighted average return of 13.4%. All other categories are also positive.

Trade Volumes
July:
Trade volumes softened in July, declining 4.2% versus June, in line with the seasonal slowdown typically observed during the Northern Hemisphere summer months. A shift in direction in some assets classes contributed to the overall reduction in processed trade volumes despite pockets of elevated activity across alternative asset classes.
Activity was lower across rate and index derivatives, which experienced volume declines, but this was offset to some extent by commodity and equity derivatives volumes, which increased by 17% compared to June. Meanwhile, credit default swaps continued their recent upward trajectory, rising a further 10% month-over- month.
August:
Trade activity moderated in August, with daily average volumes declining 5.9% versus July, although on an annual basis, daily activity remained 2.5% higher than August 2025.
Equity swaps and equities remained the largest contributors to processed volumes in August, although their daily averages fell by 11% and 4% respectively from July. The decline was partly offset by a spike in commodity futures options which more than doubled from the previous month, as well as by increased trading in equity options and commodity futures which rose by 12% and 9% respectively. Market volatility was subdued, with the VIX falling by 2 points versus July.
September:
Trade volumes rose 3.7% month-on-month, although activity remained marginally below levels seen in September 2025. The increase was broad- based across several products, led by interest rate futures, up 31%, index futures, up 23%, and cross rates, up 22%. Currency and government bond volumes also increased, while private placements recorded a particularly sharp rise from August’s lower base. In contrast, equity and equity swap volumes declined modestly, while commodity futures were down approximately 8%. Market volatility remained subdued in September.
Summary:
Q3 saw trading activity moderate through the Northern Hemisphere summer before recovering in September, with overall activity remaining broadly in line with Q2. Despite easing from record levels seen at the start of 2026, trading volumes remained elevated across Citco’s client base. The most significant change through the year has been the sharp normalization in index option activity from the exceptional levels recorded in Q1, with Q3 activity running at approximately 1% of the Q1 peak. At the same time, equities and equity swaps remained the largest contributors to activity, while September saw renewed participation across currencies, rates and index-linked products. Citco’s platform continued to maintain high Straight-Through Processing rates throughout the quarter, averaging 97.6%.

Treasury
The number of treasury payments processed quarterly by Citco’s Middle Office Solutions team broke above the 200,000 mark for the first time in Q3.
Quarterly volumes came in at 208,210 payments, driven by a record month in July when payments were above 74,000. This helped beat the previous record quarterly payment total of 193,433 set in Q2 of this year.
There is a consistent long-term trend of increased outsourcing of treasury functions which Citco has observed since these reports began at the start of the decade, and this marks the second consecutive quarter of growth.

Investor Flows
There was another bumper quarter for hedge fund inflows in Q3, building on the decade high seen in Q2.
Net inflows totalled $36bn, just below the $39.1bn in Q2, thanks to subscriptions of $75.9bn which were well ahead of redemptions.
Multi-strategy and hybrid funds continued to attract the majority of assets, with net inflows of $15.4bn and $12.3bn respectively, while a further $5.7bn went into Funds of Funds. Other strategies had smaller net inflows or outflows.
The largest funds with more than $10bn of AUA saw $24.9bn of net inflows across the quarter, just below the $26.7bn seen in Q2, followed by the $1bn-$3bn and $5bn-$10bn categories, both of which came in at $4.4bn. The smallest funds with less than $1bn also saw net inflows of $2.3bn.
Meanwhile, the Americas took the top spot in terms of regional flows, at $20.8bn, taking over from Europe which had net inflows of $13.8bn in Q3. Asia saw $1.4bn of net inflows.

