

October 6, 2026
Senior Portfolio Strategist
Fixed Income Strategies
Portfolio Advisory Group – U.S.
Key points
-
Low-rate era is over: Long-term yields have ascended to 20-year highs
even as central banks lowered short-term rates—we believe this is a
structural shift, not a temporary spike. -
Supply-demand mismatch: Global trends that supported decades of low
rates are reversing as capital previously deployed around the world is
increasingly pulled back home, reducing demand while bond issuance
stays high. -
Healthy repricing, not a crisis: Strong economic growth, investment
and rising “neutral” rates are driving yields higher—we expect
continued upward pressure until equilibrium is reached.
When the Federal Reserve started cutting interest rates from a level of
5.5 percent back on Sept. 18, 2024, the U.S. 10-year Treasury yield was
3.7 percent and the U.S. 30-year was 4.0 percent—and neither yield has
traded lower than those levels in the two years since. Not only that, each
now trades around levels not seen in nearly 30 years.
Despite the Federal Reserve (and many global central banks) cutting
short-term policy rates considerably in recent years, longer-dated bonds
have been rising steadily throughout—culminating in the 10- and 30-year
sovereign bond yields of most developed-market countries hitting fresh
multidecade highs in recent weeks and months.
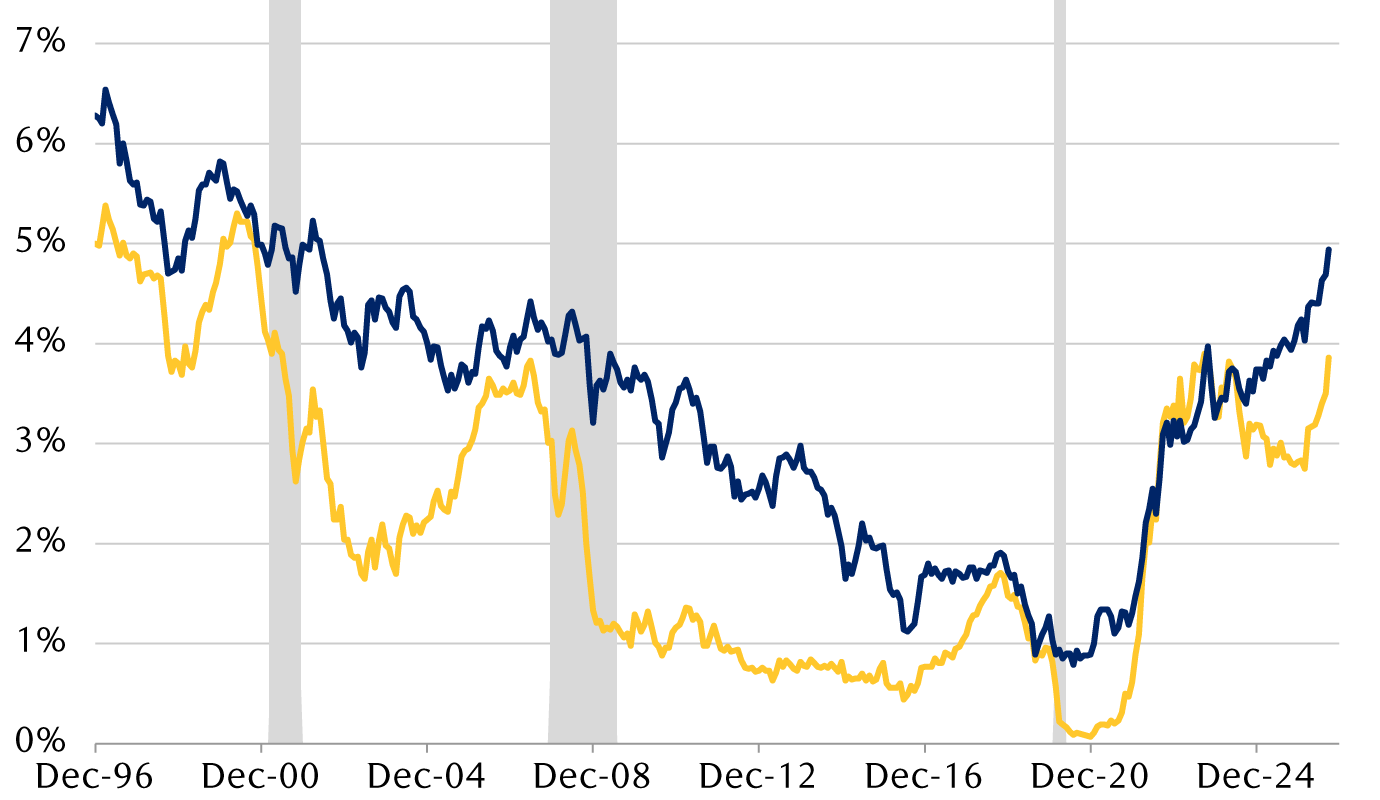
The chart below captures this dynamic in action. The ICE BofA
1-3 Year Global Sovereign Plus Index yield fell as low as 2.8 percent
earlier this year, down from 4.0 percent in 2023. But as short-term rates
started falling in recent years, long-term yields took a one-way flight
higher. The ICE BofA 10+ Year Global Sovereign Plus Index yield now stands
at 4.9 percent, eclipsing all previous levels dating back to 2002.
Clearly, short-term yields are now playing catch up, rising over 100 basis
points in the past six months alone and are now on the cusp of exceeding
even the peak rates of 2023—a time when global inflation was running north
of 10.0 percent—compared to around 4.5 percent today. For many, that may
seem like a circle that is difficult to square, but we’ll get to that
momentarily.
Follow the leader?
Short-term bonds finally playing catch-up to long-term bonds
-
U.S. Recessions
-
Global 1- to 3-year bond yield
-
Global 10+ year bond yield
Source – RBC Wealth Management, ICE BofA Global Sovereign Plus 1-3
Year Index, ICE BofA Global Sovereign Plus 10+ Year Index; data
through 9/23/26
The line chart compares the yields on global bonds with maturities
between 1 and 3 years (represented by the ICE BofA Global Sovereign
Plus 1-3 Year Index) to the yields on bonds with maturities of 10
years or more (represented by the ICE BofA Global Sovereign Plus 10+
Year Index) between Dec. 1996 and Sept. 2026.
Shorter-maturity bond yields fell below longer yields during the
2020 U.S. recession and rose with longer yields in 2021 and 2022.
Shorter yields diverged lower in 2024 and 2025, but have recently
begun to catch up to longer yields.
Regardless, longer-dated bond yields have clearly been flagging something
that perhaps central banks, short-term policy rates and markets generally
did not—and it seems as though there are a lot of issues that have been
percolating in global bond markets for years, which are now coming to a
head, with bond markets once again being front-page news.
Any lingering doubts about whether the world has truly left the era of low
interest rates behind should now be quashed, in our opinion. But if the
era of low rates is behind us, then what’s ahead?
The dawn of an old millennium
Since 2000, low interest rates have been the name of the game. Both the
Federal Reserve and European Central Bank (ECB) cut policy rates to
1.0 percent in 2004, before the Global Financial Crisis ushered in an era
of zero percent—and in some cases negative—interest rates that persisted
for years.
In this context, the recent spike in yields might seem confounding, if not
alarming. Yet historically speaking, current yields sit only at the lower
end of what arguably might be considered “normal.”
Parallels have often been drawn to the 1990s, a seemingly idyllic time of
robust economic growth, steady inflation fueled by strong productivity
gains and massive investment. Of course, those parallels are even easier
to draw today given the scale of the AI-related infrastructure buildout,
the impact on economic activity and the potential to raise economic
productivity.
The corporate demand for capital is now competing with the government
demand for capital as global debt and deficits remain elevated even during
a time of solid economic growth—the cost of money is simply going higher
as a result.
Therefore, we think the yield levels that prevailed in the late 1990s are
as good a guess as any with respect to where the next stopping point for
global yields might be.
Next shoe to drop?
Given the sharp rise in yields, a lot has already been priced into
markets. But is the global bond selloff nearing the beginning of the end,
or is it simply at the end of the beginning?
In the U.S., traders are now looking for the Fed to raise rates to
5.00 percent (currently 4.00 percent); the Bank of England to 5.00 percent
(currently 3.75 percent); the ECB to 3.50 percent (currently
2.50 percent); the Bank of Canada to 3.50 percent (currently
2.50 percent) and the Bank of Japan to 2.00 percent (currently
1.25 percent).
Though yields have repriced a lot of risks, we still harbor concerns that
lingering factors could fuel another leg higher.
-
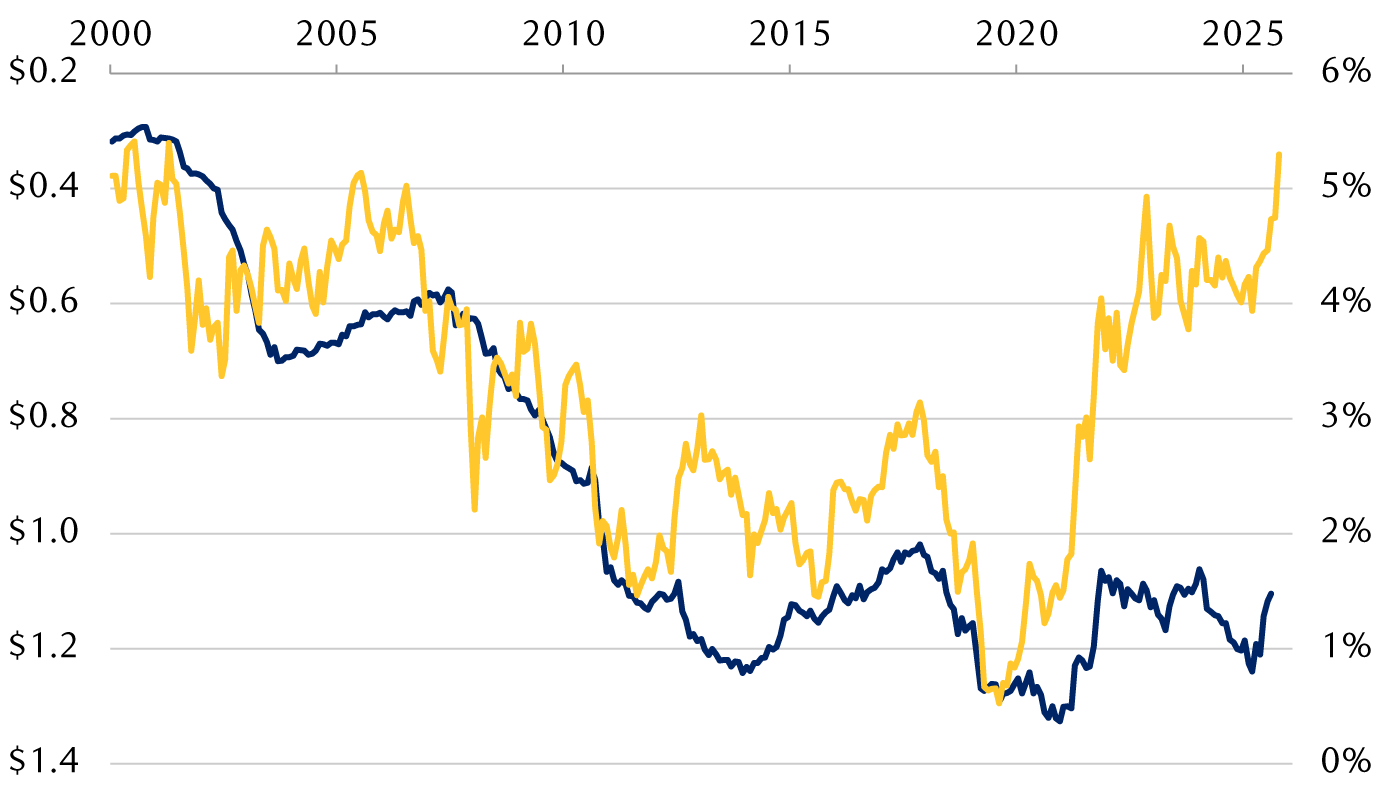
Bond supply versus bond demand. With all the bond
issuance, a natural question is who is going to buy it? As the second
chart (below) shows, a generation of disinflation and low—and at times
negative—interest rates caused Japanese investors to leave their home
market in search of yield, bulking up on U.S. Treasuries to the tune of
$1.3 trillion from barely $200 billion 25 years ago. But as Japan has
staged an economic comeback—and interest rates have normalized with
their global peers—domestic investors may find more attractive
opportunities closer to home. If the relationship shown in the chart
holds, it would suggest that every $100 billion change in Japanese
holdings contributes to a +/- 50 basis point change in the 10-year
Treasury yield. As of July 2026, Japan’s holdings are already down $120
billion so far this year and about $300 billion from the peak levels in
2021. Broadly speaking, if bond supply continues to rise and demand
lags, then naturally yields will keep rising until supply and demand are
brought back into balance. -
Economic overheating. The so-called “neutral” rate of
interest that keeps economic balance—stable prices and maximum
employment—has been rising in recent years and is likely notably higher
at the moment as a result of AI-related investment, in our assessment.
Put differently, that would mean that the Fed’s three 2025 rate
cuts—when neutral rates were rising—were perhaps the equivalent of
something like six rate cuts. That’s significant monetary stimulus that
would be hitting the economy now, given it acts with a lag. To wit, U.S.
purchasing managers’ indexes for Sept. 2026 flagged a sharp uptick
in economic activity, which also caused a spike in Treasury yields. The
risk, in our view, is that the Fed might already be behind the curve
despite raising rates at its September meeting and may have to raise
rates even more than currently priced in by markets. -
Term premiums. In the U.S., we see risks around the
Fed’s seeming retrenchment under Chair Kevin Warsh in the form of less
communication and limited forward guidance, while the Treasury
Department’s encroachment into markets this year in the form of currency
interventions and enlarged Treasury bond buyback programs could tarnish
its credibility and distort market signals. Those two factors, along
with others including debt and deficits, are reasons we believe
investors could demand greater term premiums—or higher yields—to buy and
hold longer-dated government bonds. Estimates of the current term
premium on the U.S. 10-year Treasury are currently just 0.8 percent,
which is still barely half of the average levels that prevailed prior to
2008.
Treasury yields fell as Japan bulked up on U.S. debt; now a reversal risks
a further rise in yields
-
Japan U.S. Treasury holdings (USD trillions, inverted, left)
-
10-year U.S. Treasury yield (right)
Source – RBC Wealth Management, Bloomberg, U.S. Treasury Department;
data through 9/23/26
The line chart shows the amount of U.S. sovereign debt held by Japan
and the 10-year U.S. Treasury yield, from 2000 through mid-2026. As
Japan’s Treasury holdings increased from $0.3 trillion in 2000 to
more than $1.3 trillion in 2020, the U.S. 10-year yield trended
downward. Since 2020, the 10-year yield has increased from around one percent
to five percent. Japan’s debt holdings have decreased moderately, with a
recent sharper decrease to roughly $1.1 trillion.
All that said and as is often the case, the cure for high yields is high
yields themselves—either they rise so high that investors can’t ignore the
value and rush in to buy them, or something breaks. As it stands, we don’t
see the risk of either as particularly high, and that is why we maintain
the view that we have held all year: global yields are more likely to keep
grinding higher.
A recalibration, not (yet) a reckoning
At the end of the day, we see no single factor that explains the ongoing
rise in global yields; we don’t see two factors; we don’t even see three
factors. There are dozens of things at play.
To be sure, while we think the Middle East war and the spike in oil prices
have played a notable role in the rise of longer-term bond yields and the
swift repricing of central bank rate hike expectations, we think its
importance is somewhat overstated. The consistent rise in longer-term bond
yields predates this year’s spike in oil prices and has been telling a
more fundamental story underpinned by the structural factors at play.
But when we take a step back, it simply seems that all the normal signals
coming from both markets and the economy point to one simple truth:
interest rates just need to be higher, and markets are in the midst of
repricing that reality.
Key U.S. borrowing costs rising on the back of the benchmark 10-year
Treasury yield
-
U.S. Recessions
-
30-year U.S. mortgage rate
-
U.S. corporate index yield
-
U.S. Treasury index yield
Source – RBC Wealth Management, Bloomberg US Treasury Index,
Bloomberg US Aggregate Corporate Index, Mortgage Bankers
Association; data through 9/21/26
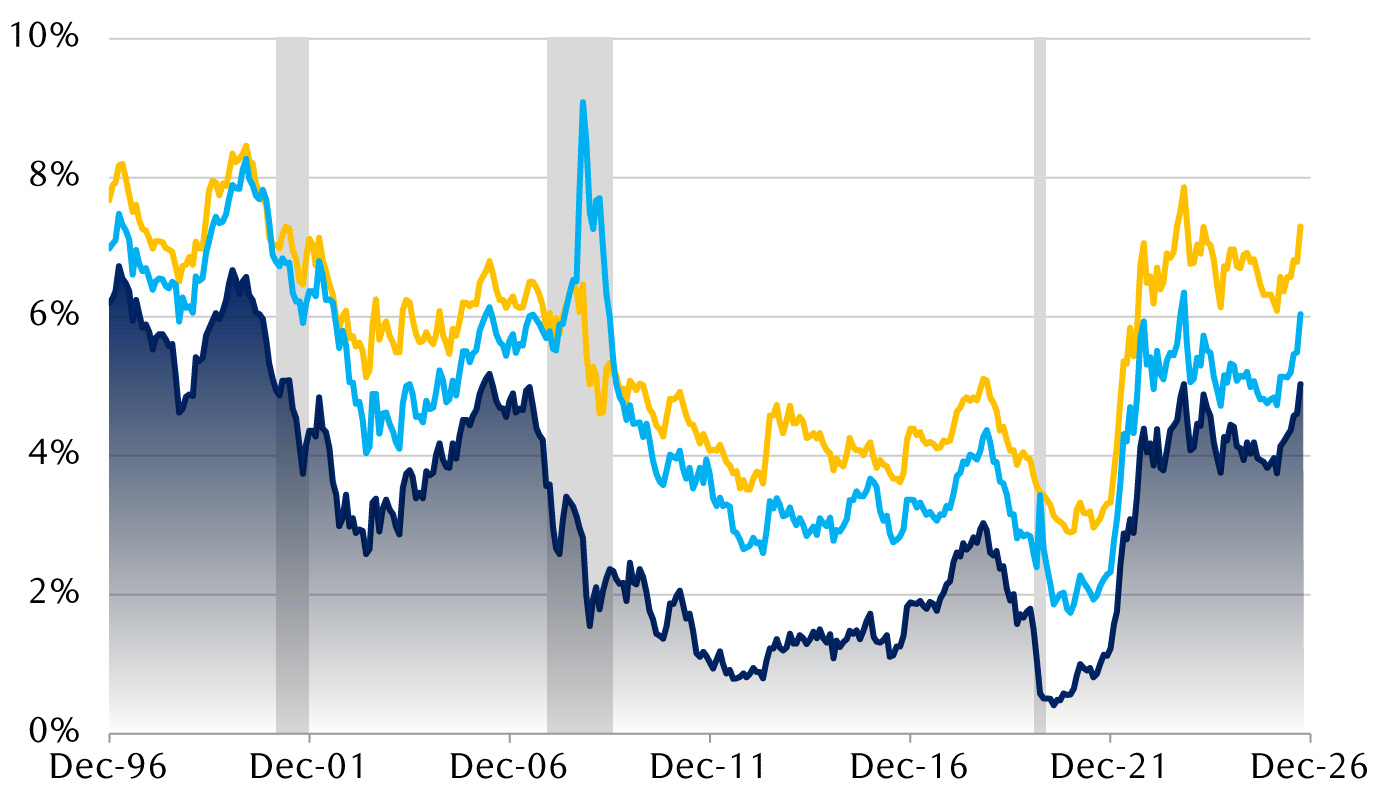
The chart shows the yields on U.S. corporate debt (represented by
the Bloomberg Aggregate US Corporate Index) and U.S. Treasuries
(represented by the Bloomberg US Treasury Index) as well as the
average 30-year U.S. mortgage rate, from Dec. 1996 through
Sept. 2026. All three rose quickly following the end of the
brief 2020 U.S. recession, and have been trending higher again since
the end of 2025.
With much of the focus on the 10-year Treasury yield, which Fed Chair
Kevin Warsh recently characterized as “… the most important asset anywhere
in the world … it’s the risk-free asset which every price of virtually
every asset in the world is related to,” it’s important to solidify our
thinking there. Over the near term, we see it eventually finding a trading
range of 5.25 percent to 5.75 percent. Should the 30-year Treasury yield breach
6.00 percent—which we think is possible—then the 10-year could be dragged toward
that level as well. But our working thesis for now is that, if the Fed
were to take its policy rate toward 5.00 percent, we would add 25 basis points
for a target two-year Treasury yield around 5.25 percent, and then add another 25
basis points for a target 10-year Treasury yield around 5.50 percent as strong
economic growth and low recession risks should keep yield curves
positively sloped rather than inverted.
Finally, and of course, if a fuse has seemingly been lit under global bond
markets, then what happens when it runs out? Well, the powder keg explodes
or—and hopefully—it turns out to be a dud.
In short, we think it proves to be a dud. Bond yields can rise for “bad”
reasons, but they can also rise for “good” reasons. To this point, we
think the bulk of the move has been for largely good reasons. That is,
strong economic growth, higher neutral interest rate levels globally, and
attractive investment alternatives. Of course, there’s a lingering risk
that some of the bad drivers of higher yields come into play like
inflation and/or term premiums, but for now, we err on the side of this
being a healthy recalibration.
RBC Wealth Management, a division of RBC Capital Markets, LLC, registered investment adviser and Member NYSE/FINRA/SIPC.
Senior Portfolio Strategist
Fixed Income Strategies
Portfolio Advisory Group – U.S.